It’s been a massive rally over the last 15 months in the crypto sector since Bitcoin bottom at US$3,800 on Mar. 13, 2020. reaching price at around US$65,000 Bitcoin saw a price explosion of more than 1,600%! Now however the sector seems ripe for some form of a healthy pullback and a breather.
Since the beginning of the year, the price of Bitcoin has increased by almost 100%. Thus, the outperformance of Bitcoin compared to almost all other asset classes continued mercilessly. It seems as if Bitcoin, or rather the crypto sector, wants to suck up everything like a black hole.
Bitcoin´s waning momentum is a warning signal
However, the Bitcoin markets have also been witnessing an increasingly waning momentum since late February. In particular, the pace of the rise had slowed down more and more since prices pushed above US$60,000 in March for the first time. Although another new all-time high was reached on Apr. 14 at around US$65,000, the bulls are showing more and more signs of fatigue after the spectacular rally. Interestingly enough, this last new all-time high coincided exactly with the stock market debut of Coinbase (NASDAQ:COIN).
Only a few days later, a significant price slide down to just under US$50,000 happened, which was caused by a huge wave of liquidations. According to data provider Bybt, traders lost a total of more than US$10.1 billion that Sunday through liquidations forced by crypto exchanges. More than 90% of the funds liquidated that day came from bullish bets on Bitcoin or other digital currencies. In this regard, the world’s largest crypto exchange Binance was at the center of the earthquake with liquidation worth nearly US$5 billion. As the price of Bitcoin fell, many of these bets were automatically liquidated, putting further pressure on the price and leading to a vicious cycle of further liquidations. Many (especially inexperienced) crypto traders were wiped out without warning.
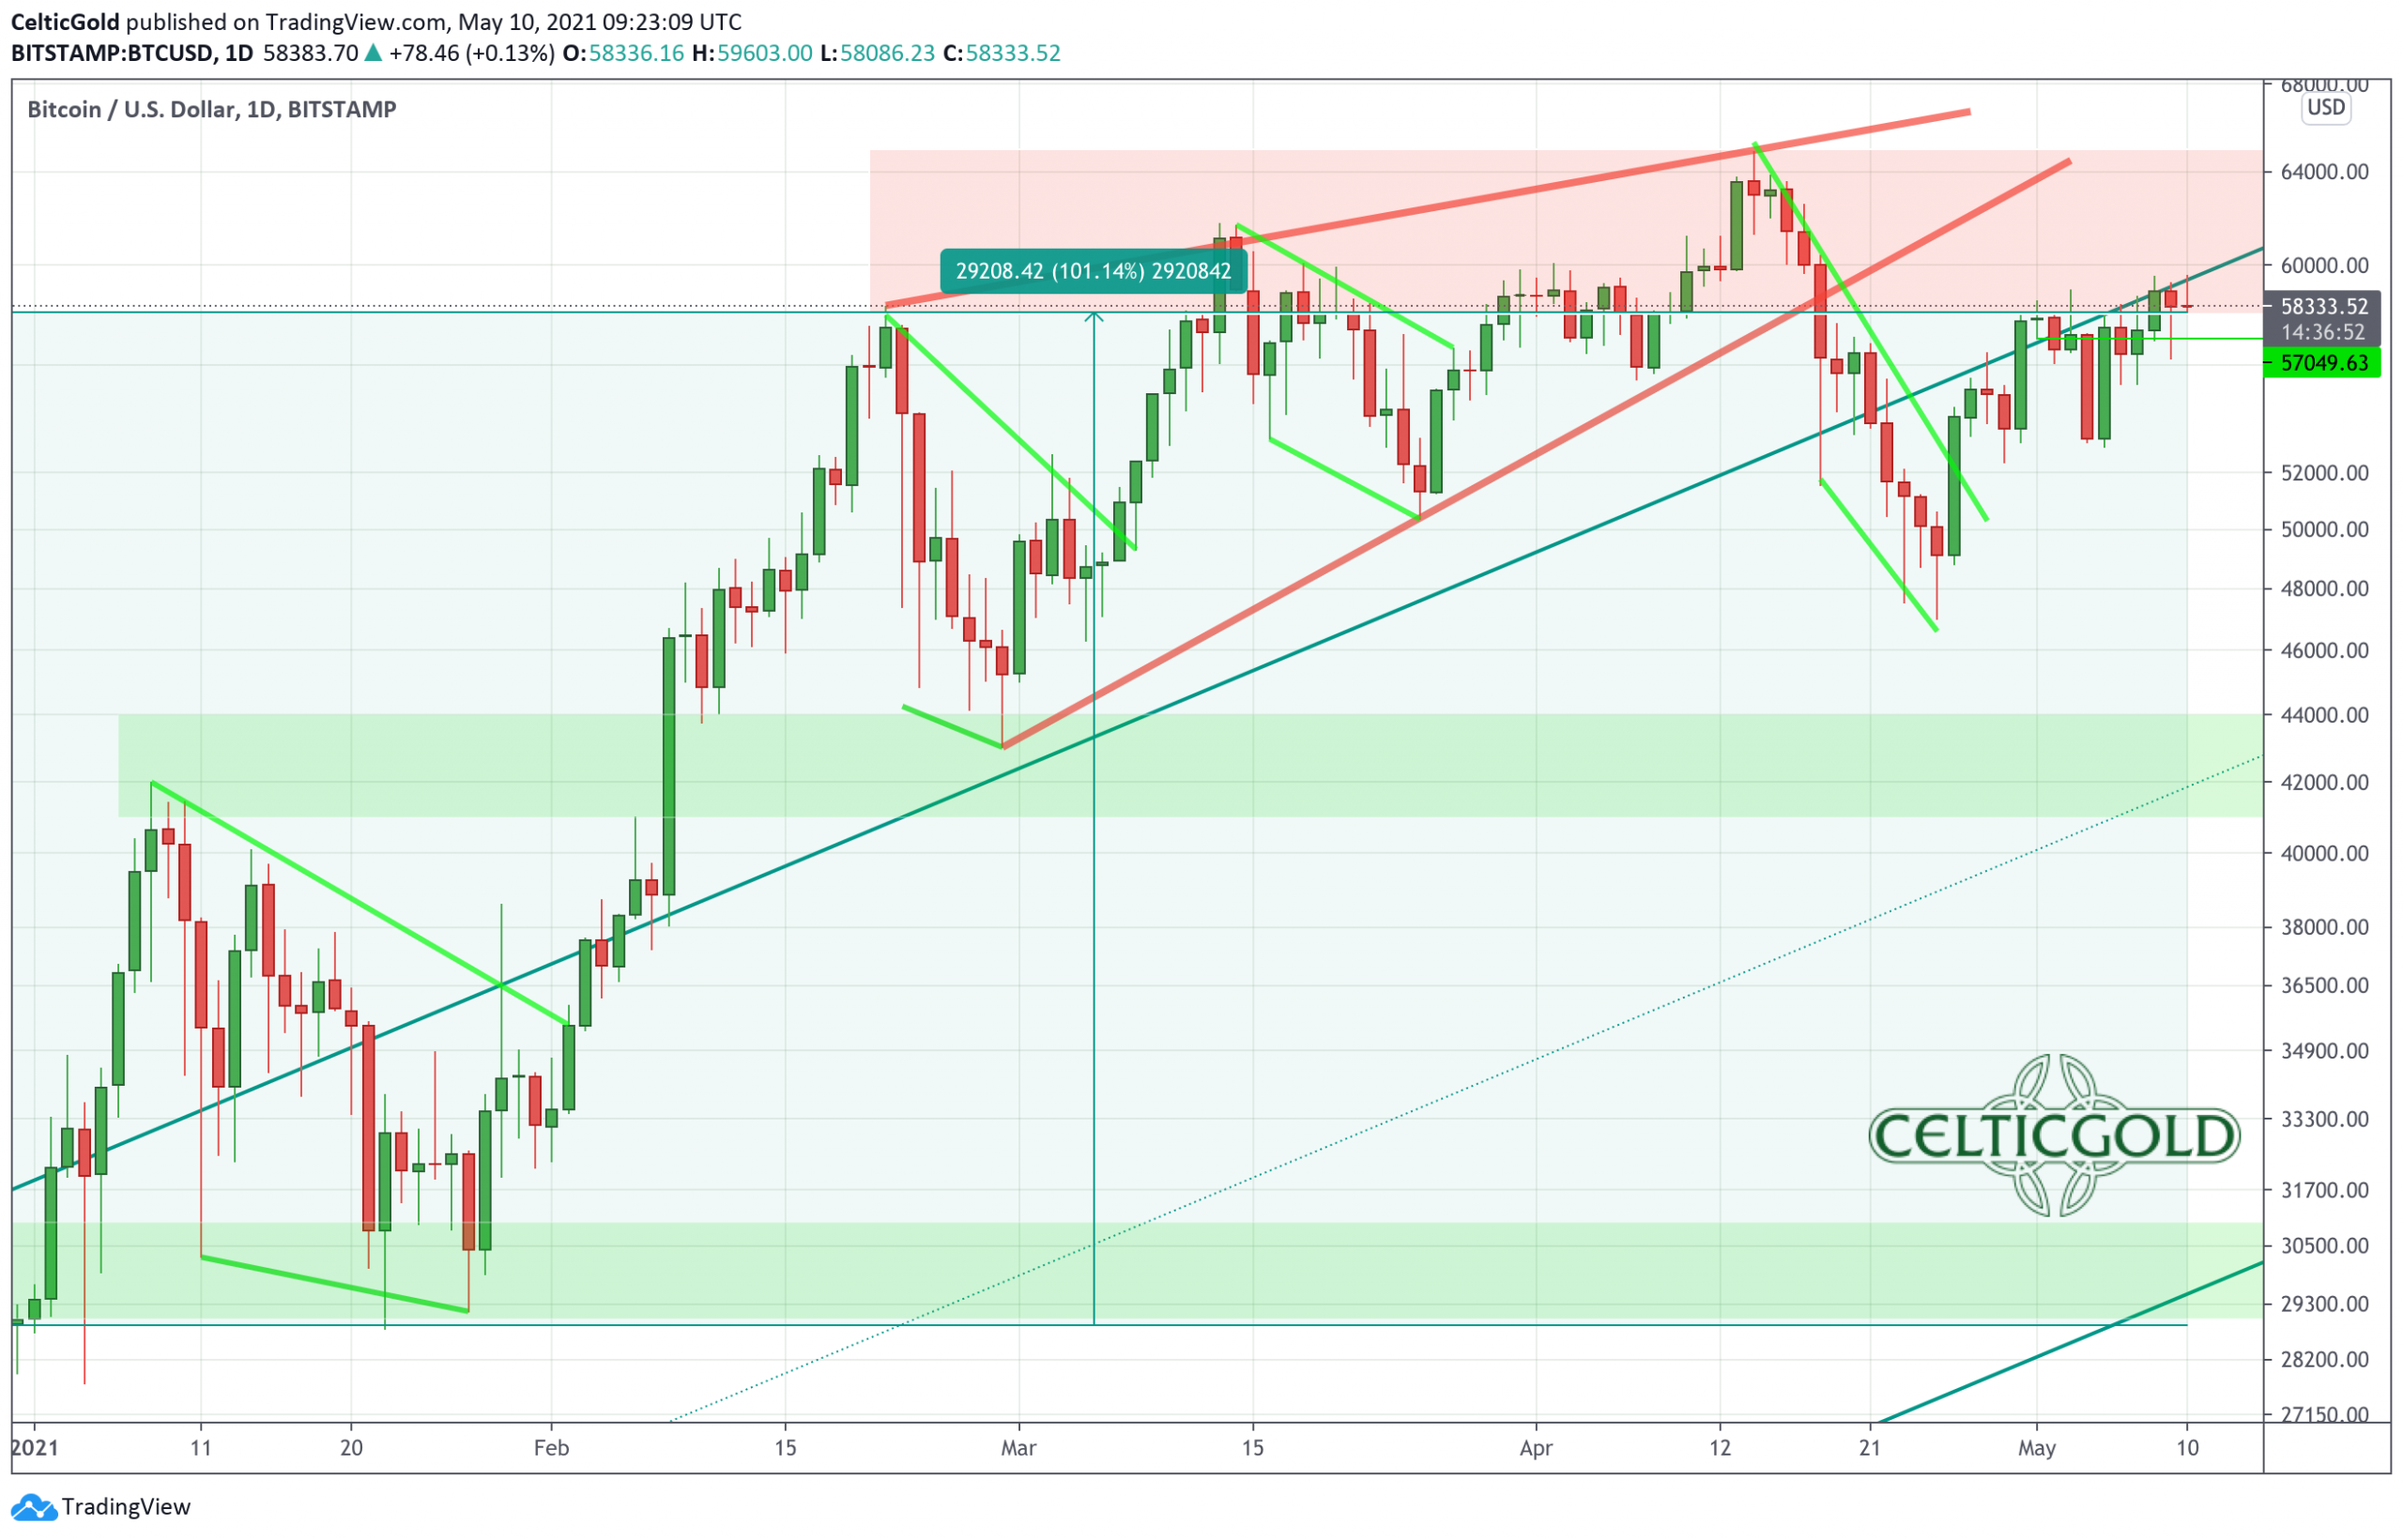
After a quick recovery back to US$56,000, Bitcoin continued its correction and fell back to US$47,000 by Apr. 25. Since then, it has managed a remarkable recovery, as the Bitcoin bulls are trying hard to restart the uptrend. So far, this recovery has at least reached a high of US$59,600. Nevertheless, the price development of bitcoin remains rather tough until recently, while numerous altcoins and so called “shitcoins” experienced incredible price explosions in recent weeks.
The exciting question now is whether the current recovery remains just a countermove within a larger correction or whether the turnaround has already been seen and Bitcoin is therefore on the way to new all-time highs?
Technical Analysis For Bitcoin in US-Dollar
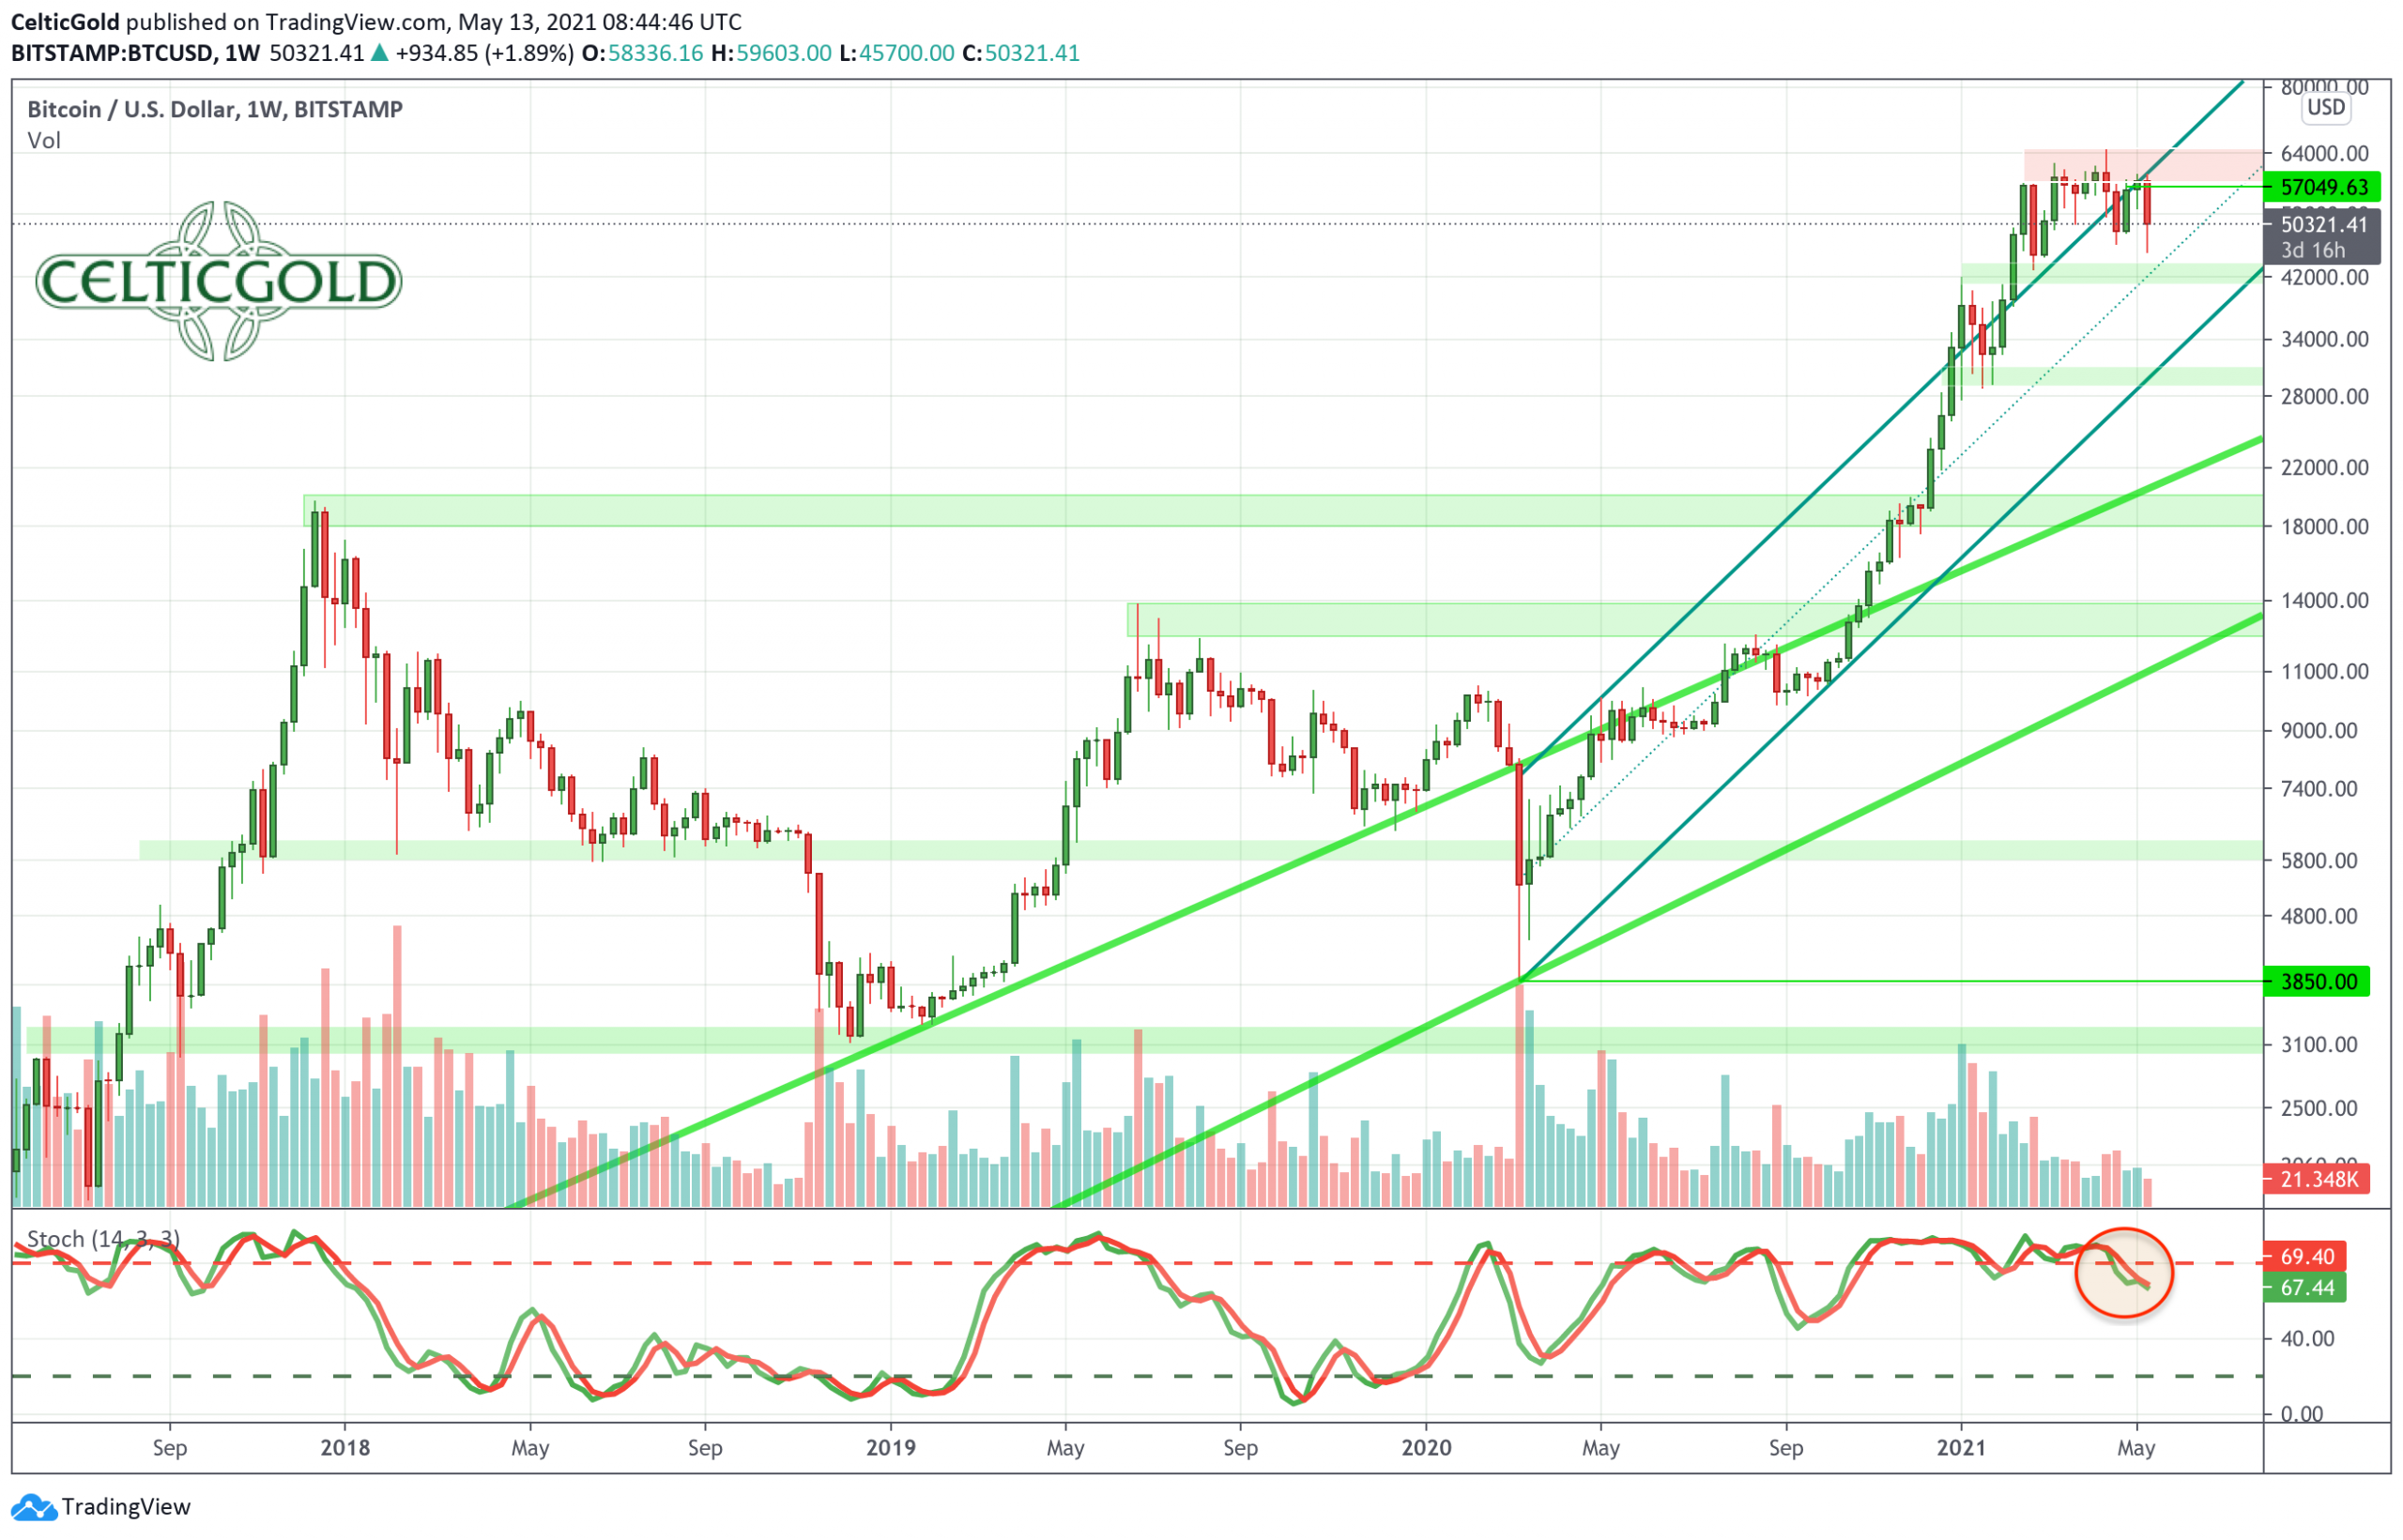
On the weekly chart, Bitcoin has been stuck at the broad resistance zone between US$58,000 and US$65,000 for the past two and a half months. At the same time, the bulls continue trying to break out of the uptrend channel which is in place since 14 months. However, the recent pullback has so far only begun to clear the overbought situation, if at all. A somewhat larger pullback or simply the continuation of the consolidation would certainly do the market good. On the downside, the support zone between US$41,000 and US$45,000 remains the predestined support zone in case the bears should actually show some more penetration. If, on the other hand, price rise above approx. US$61,000, the chances for a direct continuation to new all-time highs increases quite a lot.
Weekly Chart with a fresh sell signal
Overall, the big picture remains bullish and higher Bitcoin prices remain very likely in the medium to longer term. However, since reaching US$58,000 for the first time at the end of February, Bitcoin has been increasingly weakening in recent weeks. Another healthy pullback towards the support zone of US$41,000 to US$45,000 USD could recharge the bull´s batteries. With fresh powers a breakout to new all-time highs in the summer is likely. Obviously, a good buying opportunity cannot be derived from the weekly chart at the moment. Rather, the stochastic sell signal calls for patience and caution.
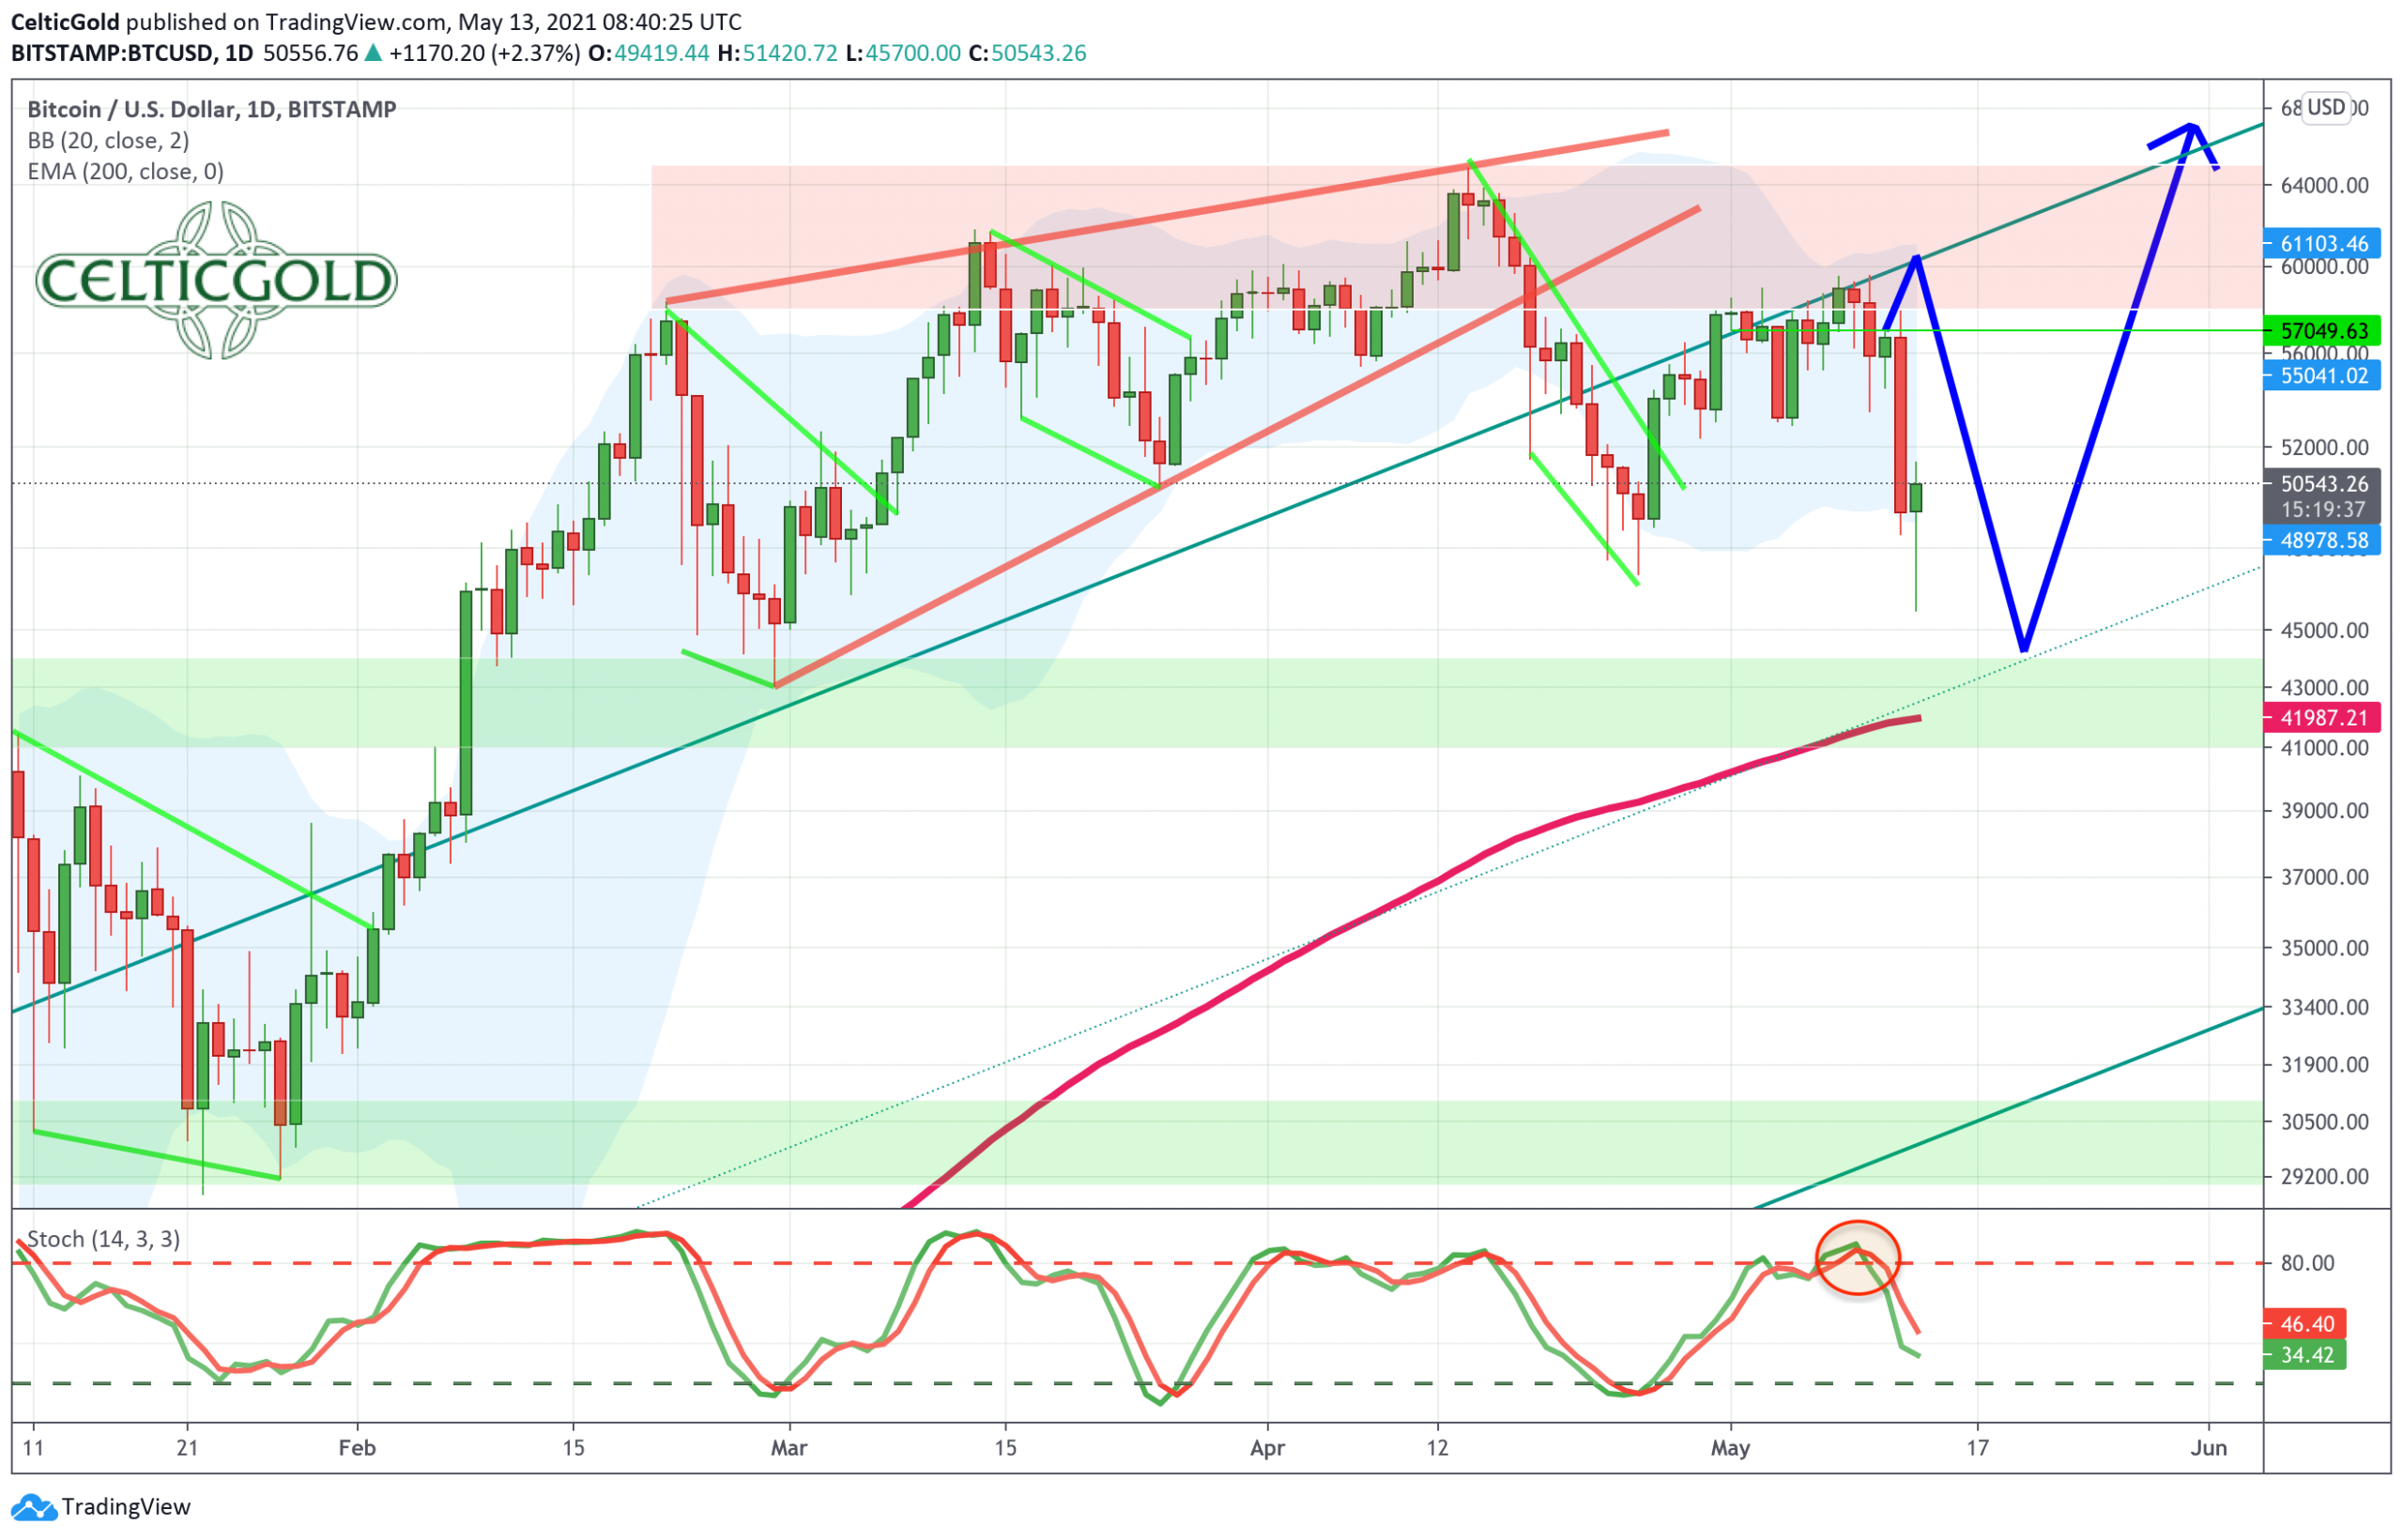
On the daily chart, Bitcoin slipped out of a bearish wedge on Apr. 14 and has been attempting a countermovement since the low at just under US$47,000. However, this recovery is somewhat tenacious and currently hangs on the upper edge of the uptrend channel. Given the overbought stochastic and the relatively large distance to the exponential 200-day moving average (US$41,694), another pullback has an increased probability. The liquidation wave on Apr. 18 clearly showed how quickly the whole thing can slide, given the exuberant speculation with derivatives and leverage.
Of course, the bulls (and thus rising prices) have always a clear advantage in a bull market. Also, in view of the huge monetary expansions, speculation on the short side is not recommended. One is better advised with regular partial profit-taking (without selling one’s core long positions completely) as well as a solid liquidity reserve, with which one can take advantage of the opportunities that arise in the event of more significant pullbacks. The blind “buy & hold” or “hold” strategy has also proven its strengths and can rightfully be maintained given the bullish medium to longer-term outlook.
Daily Chart now on a sell signal
Summarizing the daily chart, Bitcoin is so far “only” in a countermovement within the pullback that began on Apr. 14. Only with a breakout above approx. US$61,000 the bulls would clearly be gaining the upper hand again. In this case, a rally towards approx. US$69,000 USD becomes very possible. On the downside, however, Bitcoin prices below US$53,000 would signal that the bears have successfully fended off the breakout above the upper edge of the uptrend channel in the short term. The next step would then be a continuation of the correction and thus lower prices in the direction of the support zone around US$44,000 as well as the rising exponential 200-day moving average.
Sentiment Bitcoin – Caution, the crypto sector is getting a bit overheated in the short-term
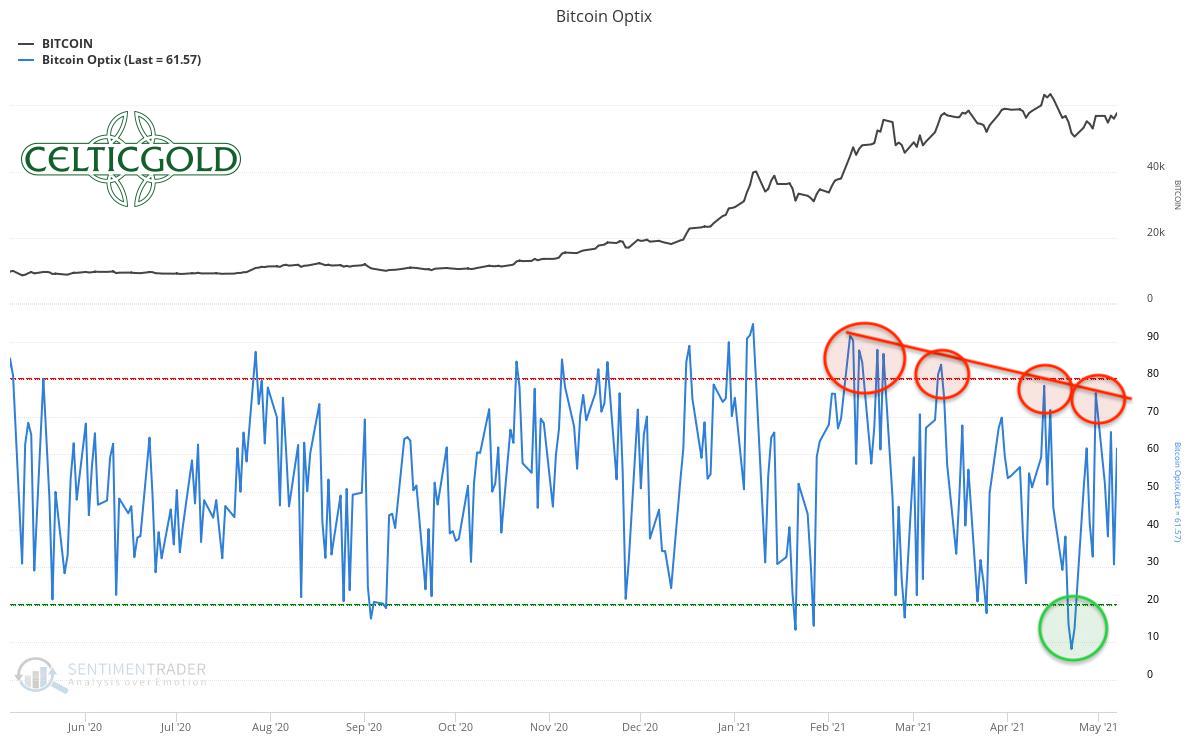
The rather short-term “Bitcoin Optix” currently reports a balanced sentiment. What is striking is the fact that the last sentiment highs since February have always been weaker. I.e. the sentiment momentum is falling. At the same time, the temporary panic on Apr. 25 brought an exaggeration to the downside (panic low = green circle), with which the ongoing recovery can be explained.
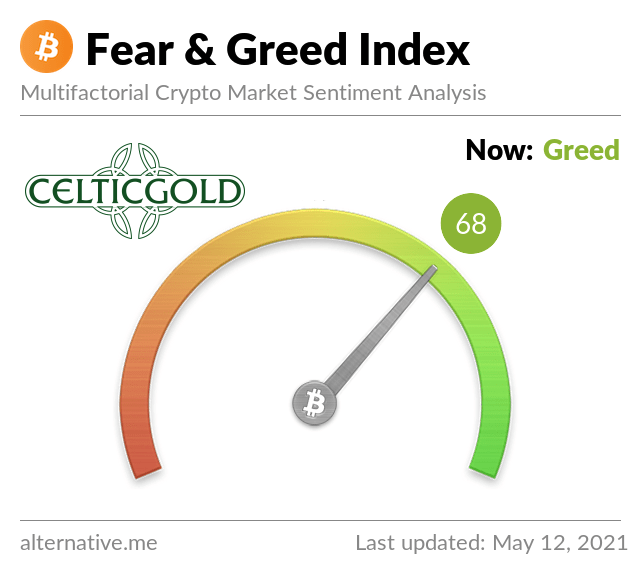
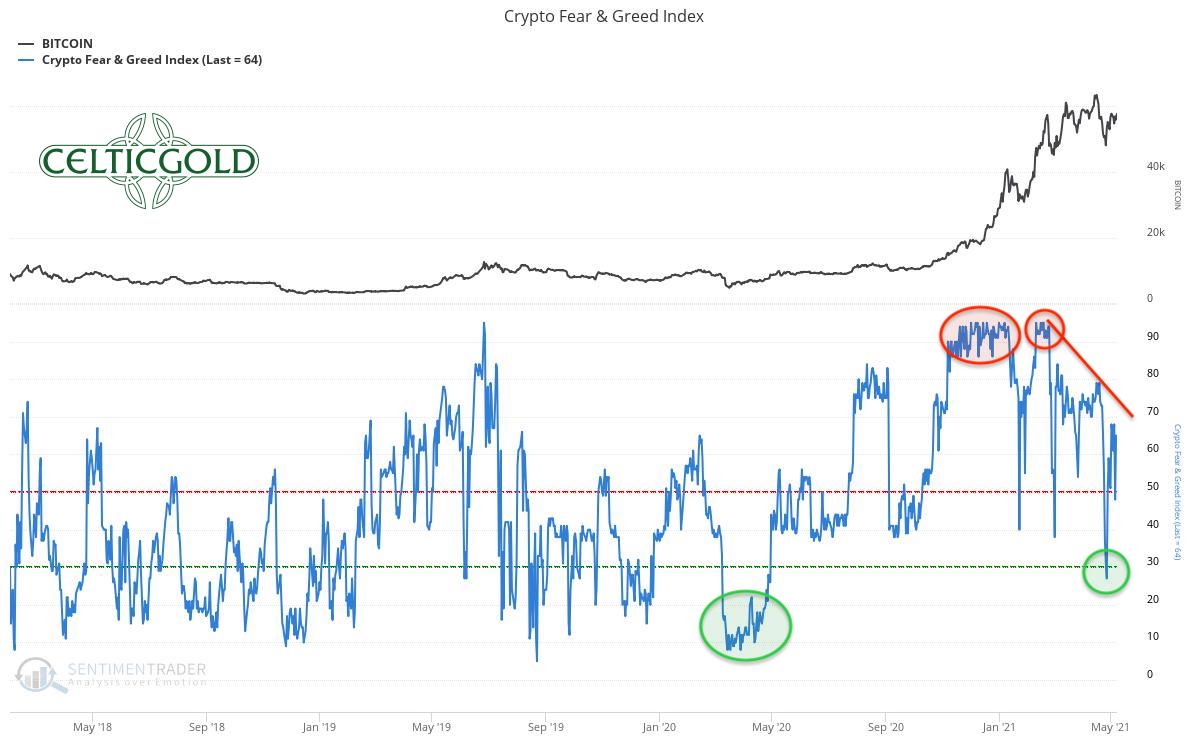
The much more complex and rather long-term “Crypto Fear & Greed Index” currently indicates a slightly exaggerated optimism or “increased greed”.
In the very long-term comparison, sentiment is somewhat overly optimistic.
Overall, quantitative sentiment analysis is increasingly sending warning signals. In particular, the decreasing momentum of the sentiment peaks with simultaneously exploding altcoin prices must be taken seriously. Therefore, a contrarian entry opportunity is definitely not present in the crypto space. Instead, one is well advised to wait patiently for the next wave of panic or liquidation.
Seasonality Bitcoin – Caution, the crypto sector is getting a bit overheated in the short-term
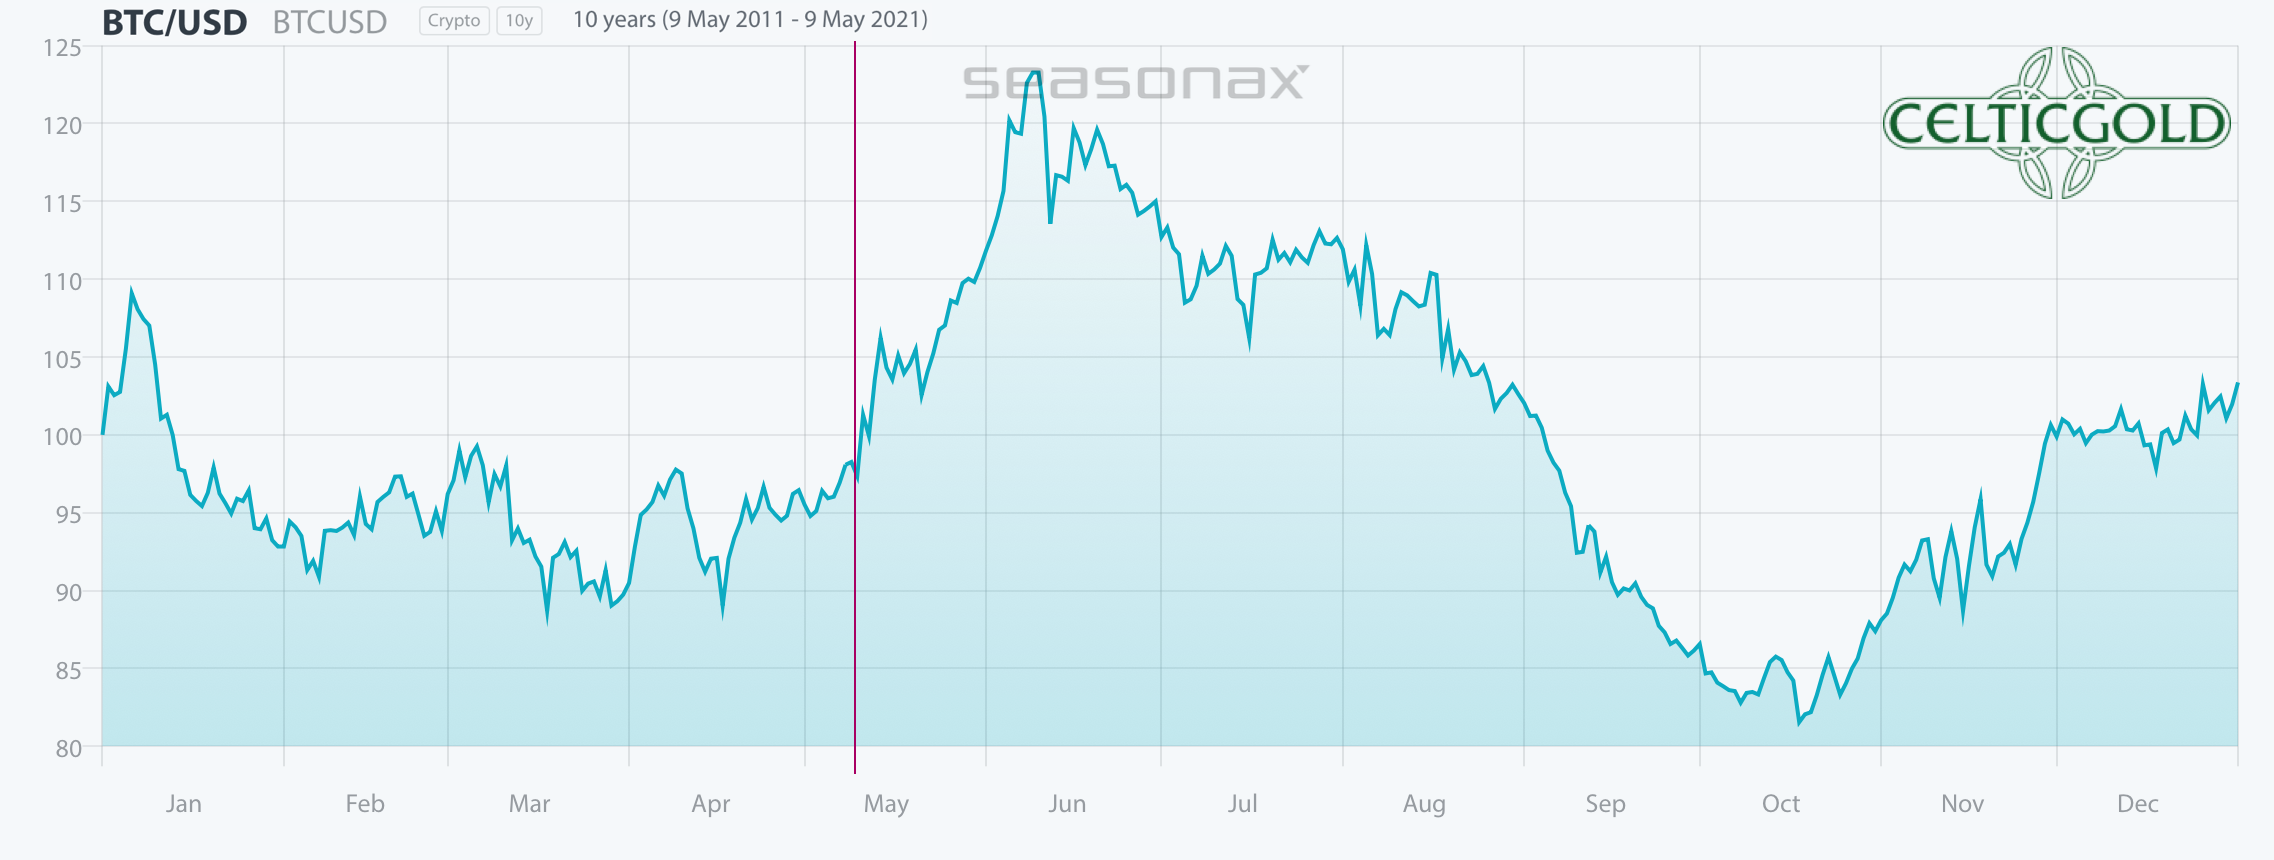
Statistically, the sideways spring phase for Bitcoin ends at the beginning of May. This has often been followed by a sharp rally into June. However, this year Bitcoin only reached an important high on Apr. 14 and has been consolidating since then. Hence, the seasonal pattern doesn’t really match up with this year’s price action so far.
In conclusion, the seasonality is basically changing from neutral to green these days. However, the course of the year has not been in line with the seasonal pattern. A continuation of the consolidation therefore seems more likely.
Sound Money: Bitcoin vs. Gold
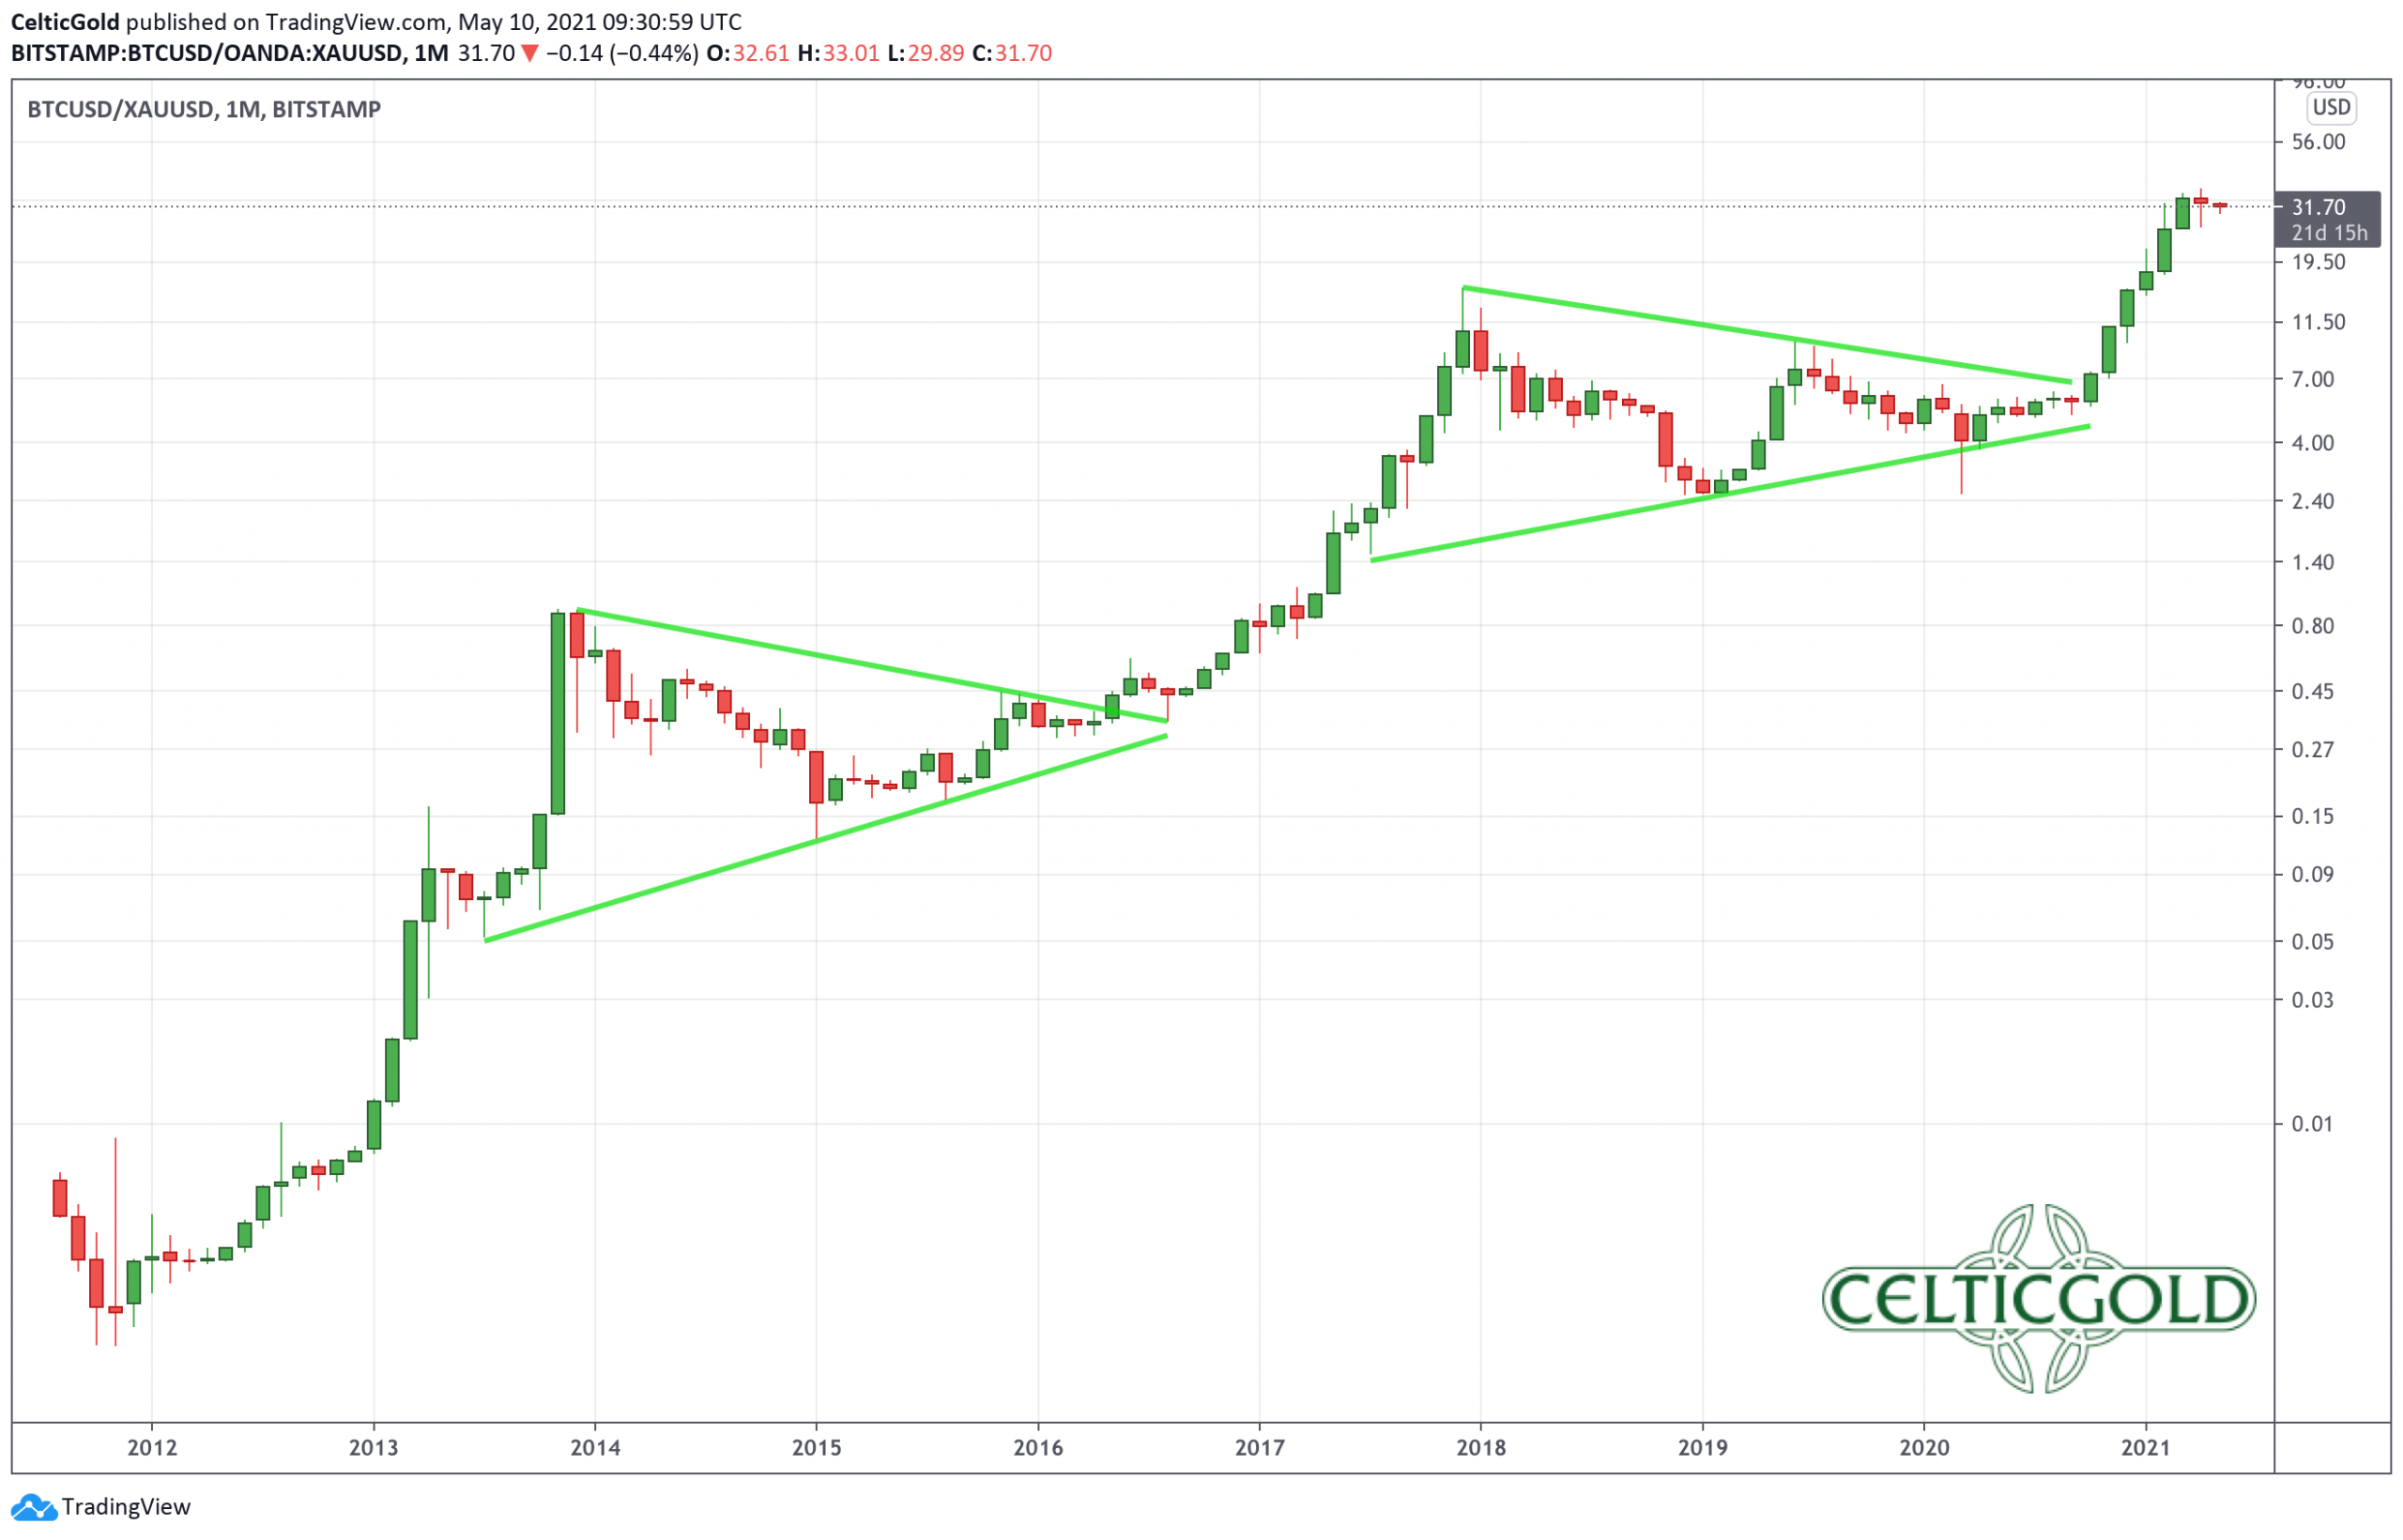
At prices of US$58,075 for one Bitcoin and US$1,835 for one troy ounce of gold, the Bitcoin/gold-ratio is currently trading at around 31.7. This means that you currently have to pay almost 32 ounces of gold for one Bitcoin. Put the other way around, one troy ounce of gold currently costs about 0.03 Bitcoin. Thus, Bitcoin has been running sideways against gold at a high level for a good month and a half.
You want to own Bitcoin and gold!
Generally, buying and selling Bitcoin against gold only makes sense to the extent that one balances the allocation in those two asset classes! At least 10% but better 25% of one’s total assets should be invested in precious metals physically, while in cryptos and especially in Bitcoin one should hold at least between 1% and 5%. If you are very familiar with cryptocurrencies and Bitcoin, you can certainly allocate much higher percentages to Bitcoin on an individual basis. For the average investor, who is primarily invested in equities and real estate, 5% in the still highly speculative and highly volatile Bitcoin is a good guideline!
Overall, you want to own gold as well as Bitcoin, since opposites complement each other. In our dualistic world of Yin and Yang, body and mind, up and down, warm and cold, we are bound by the necessary attraction of opposites. In this sense you can view gold and Bitcoin as such a pair of strength. With the physical component of gold and the pristine digital features of Bitcoin you have a complementary unit of a true safe haven for the 21st century. You want to own both!
Macro Outlook and Crack-Up-Boom
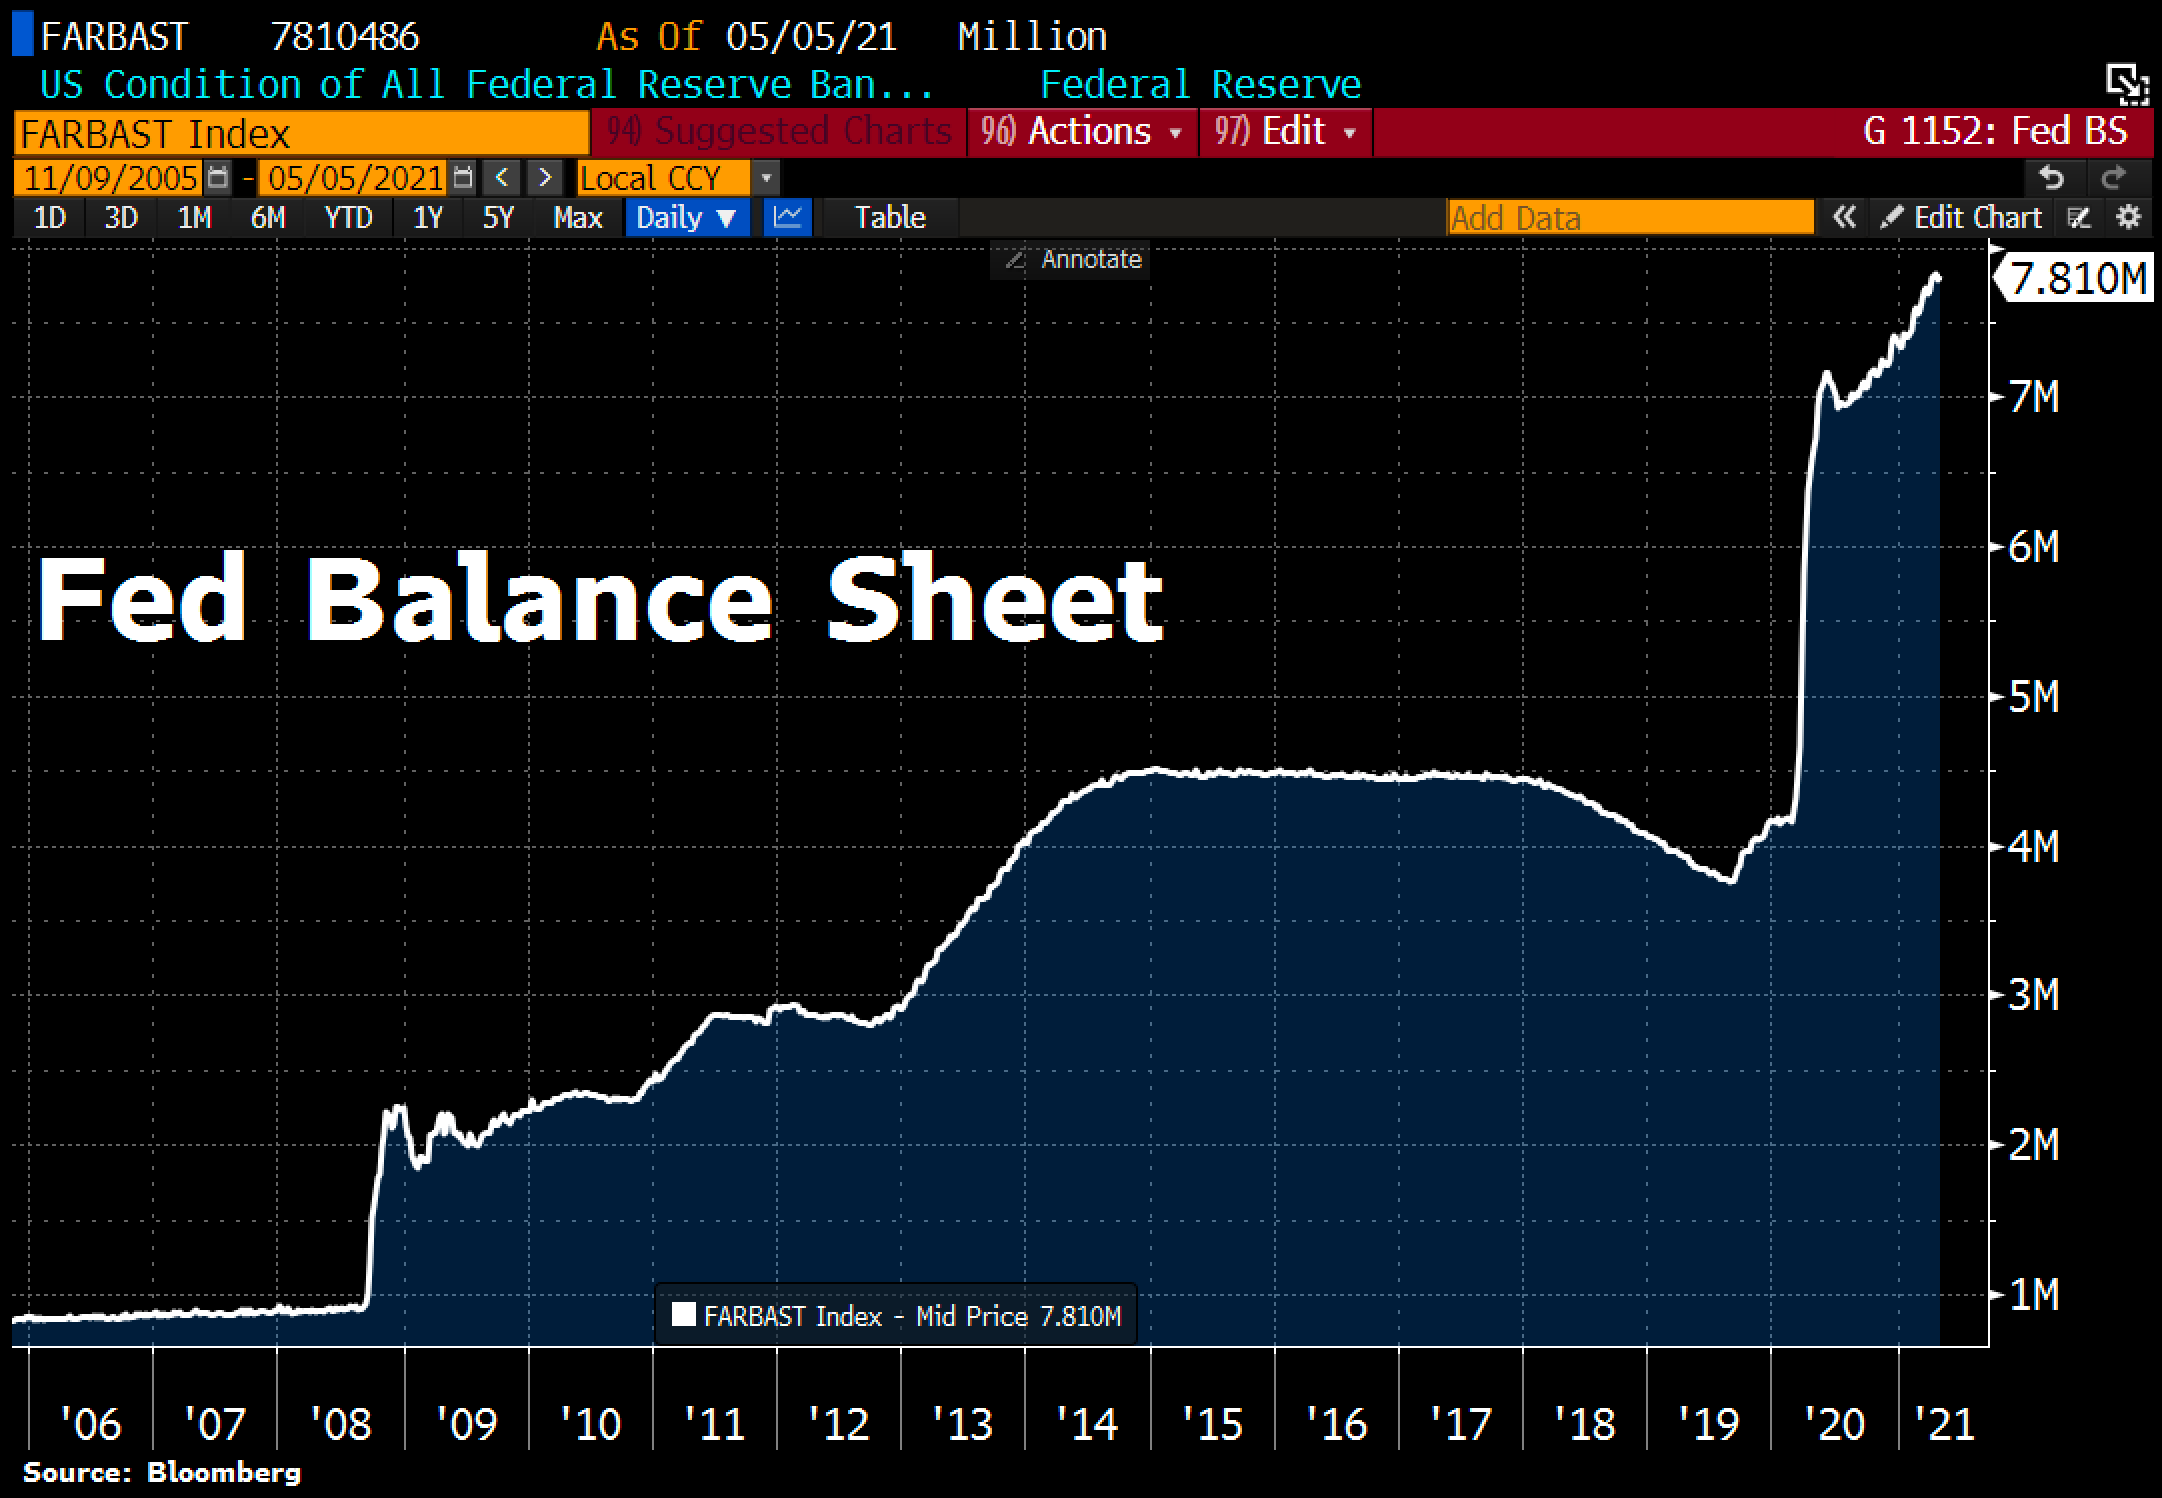
The US Federal Reserve’s total assets continued to rise in recent weeks, reaching a new all-time high of US$7,810 billion. The biggest increase was in holdings of US Treasury securities, which rose by US$25.66 billion to a total of US$5,040 billion.
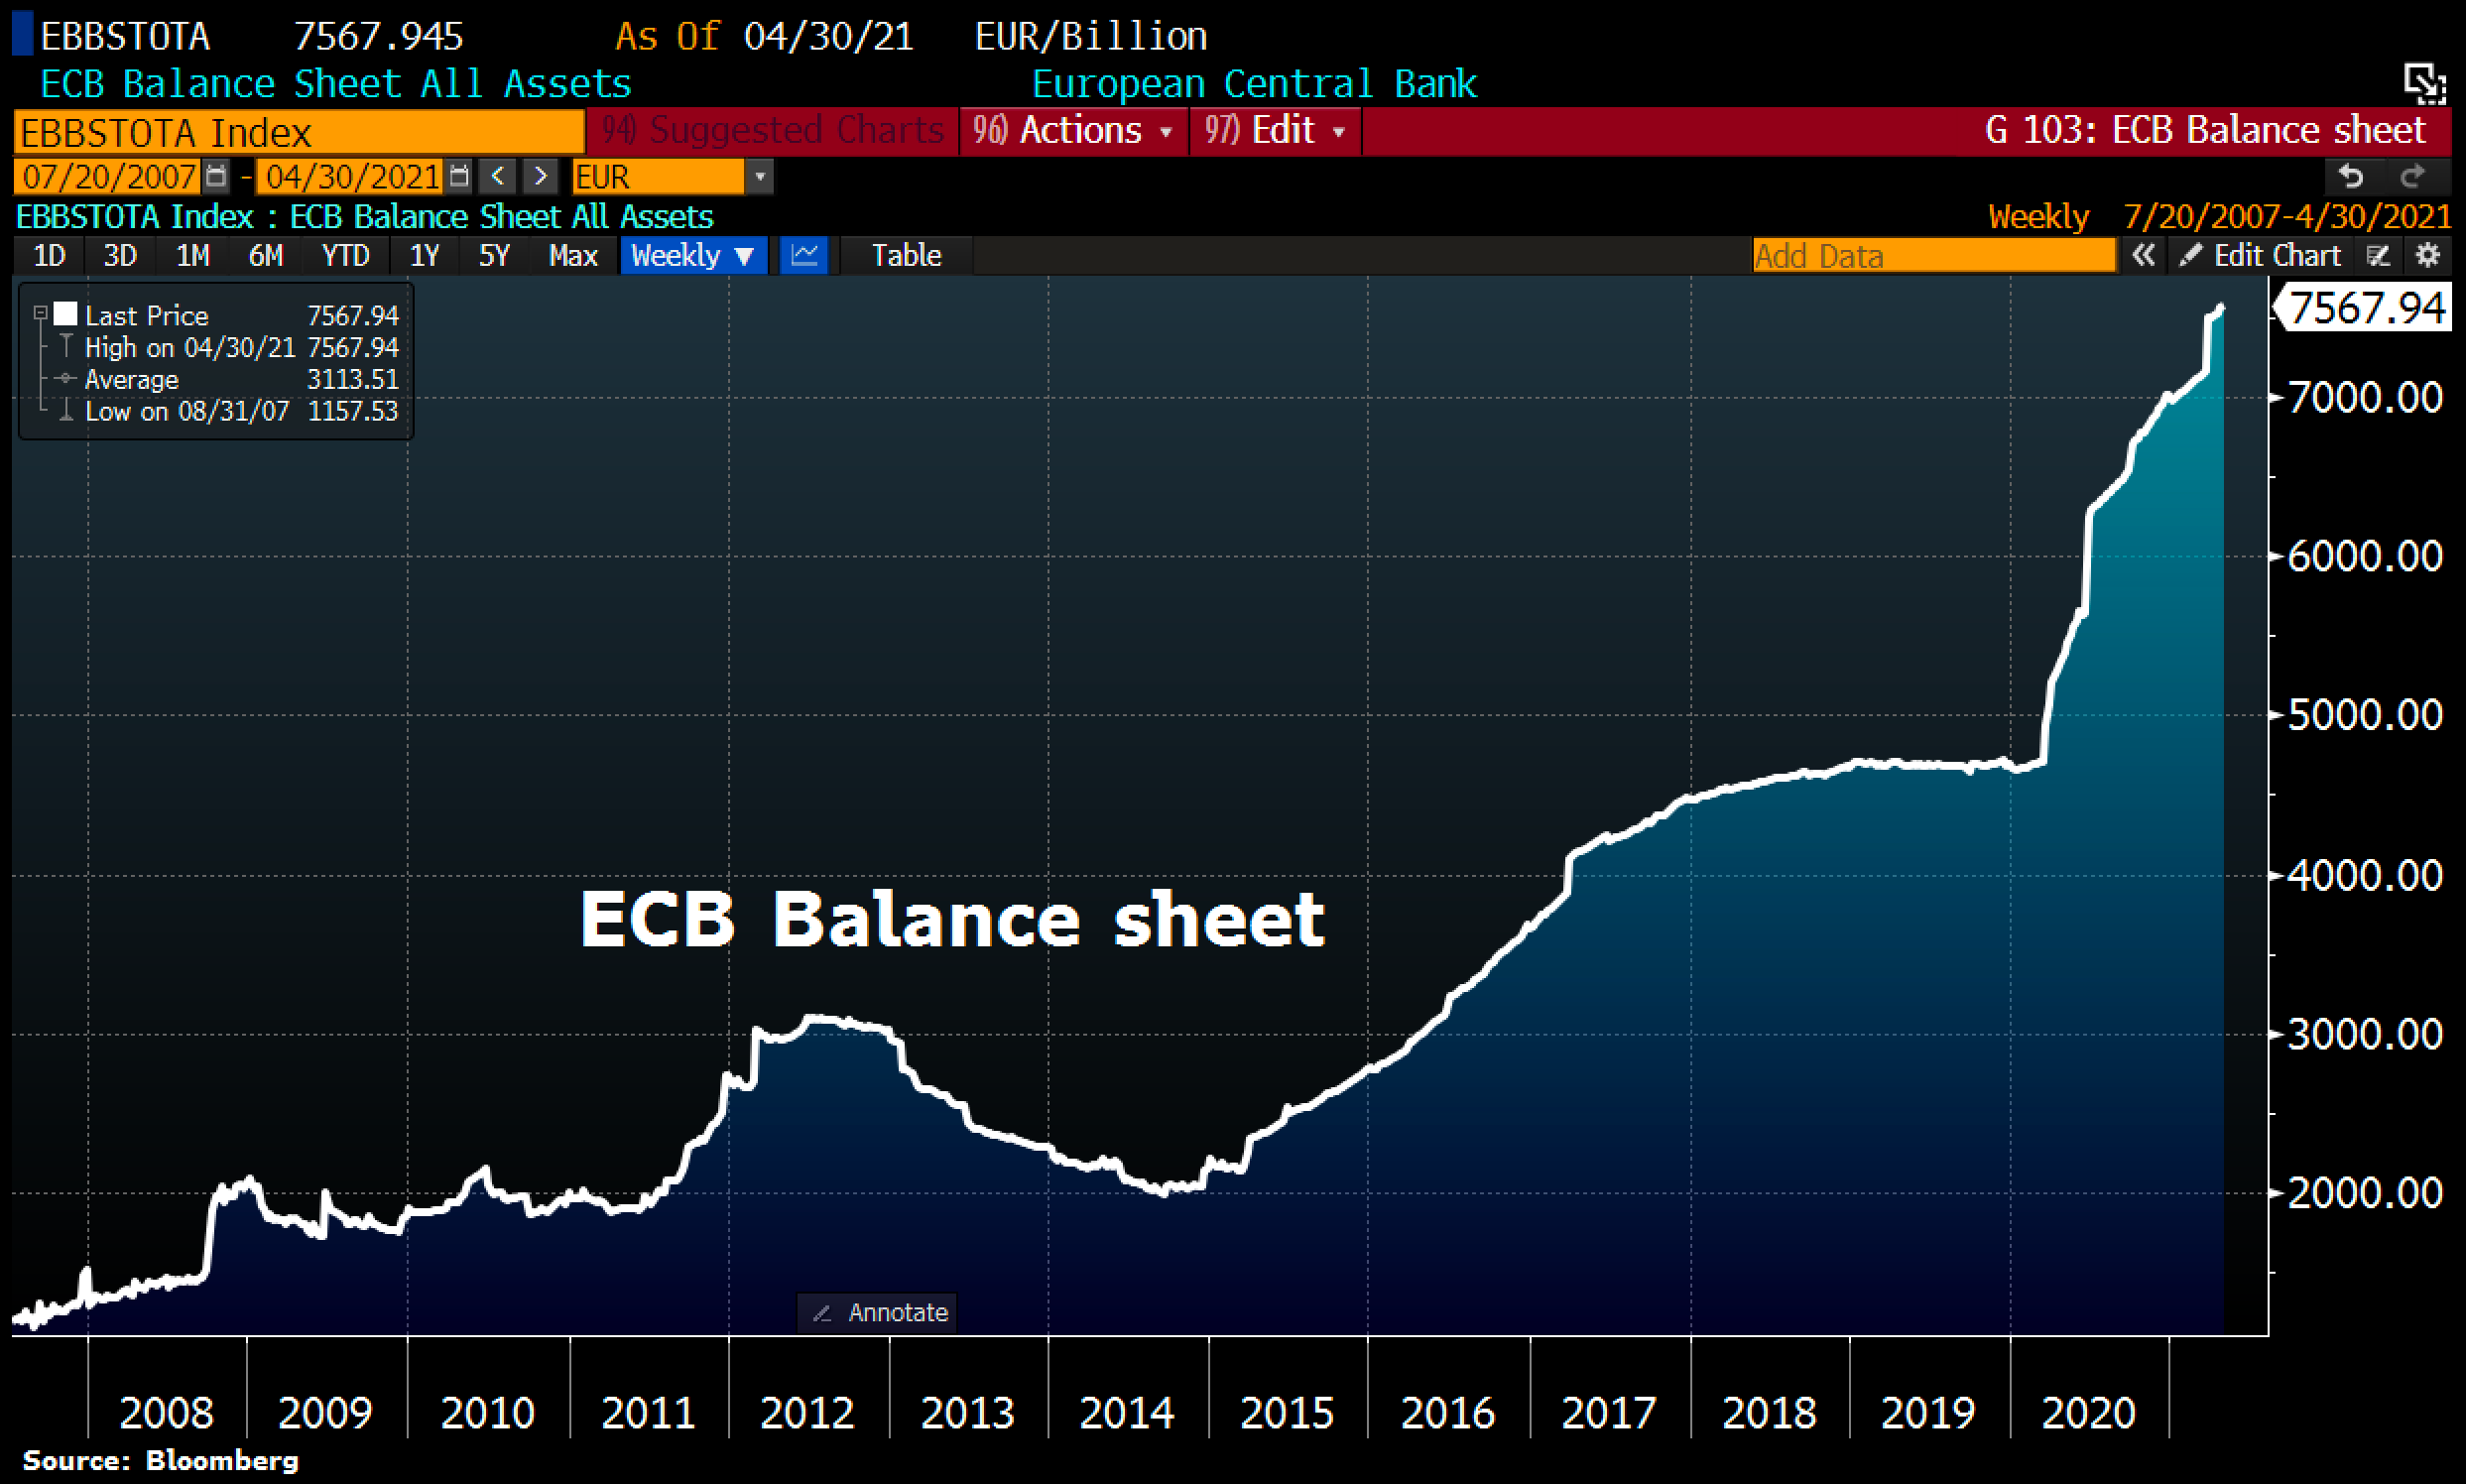
The ECB balance sheet also reached a new all-time high of EUR7,568 billion. Driven by ultra-lax monetary policy (quantitative easing), total assets rose by a further EUR9.7 billion. The ECB balance sheet is now equivalent to 76.2% of euro area GDP.
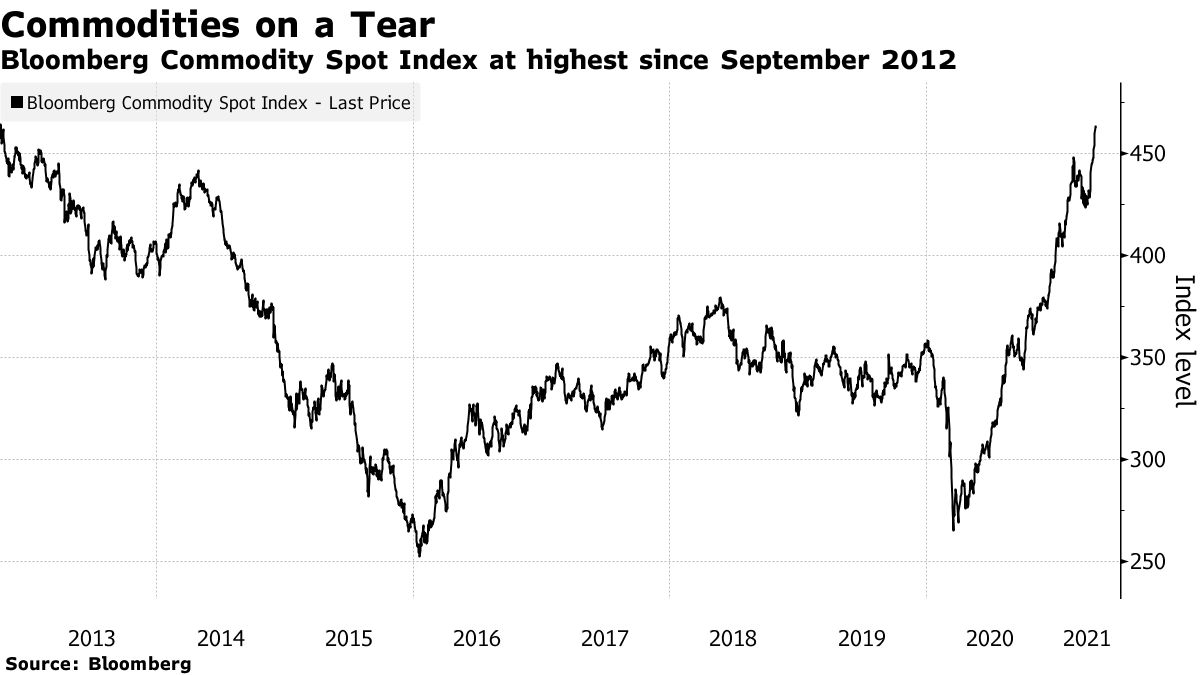
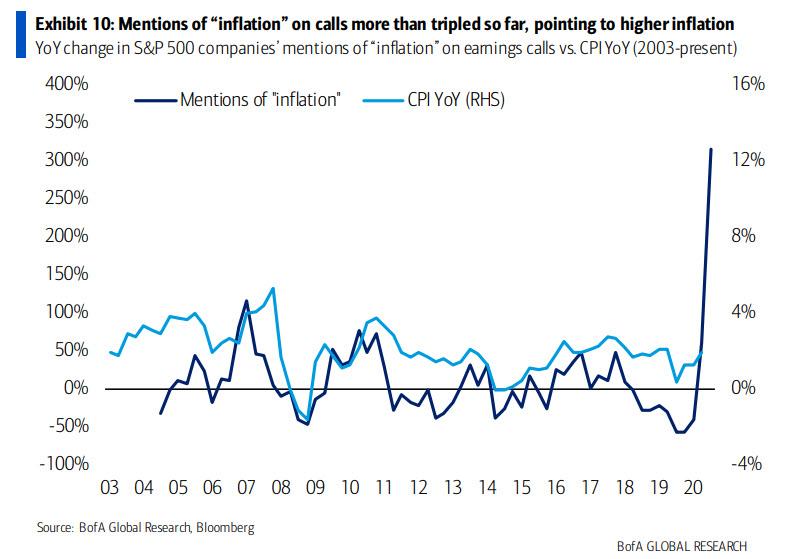
Due to these massive monetary expansions, the consequences of this irresponsible central bank policy are now slowly but surely becoming more and more apparent. For example, the Bloomberg Commodity Index has more than doubled since March 2020 and most recently rose to its highest level since 2011. Numerous commodities are reaching new highs, fueling inflation fears. The loss of confidence in fiat currencies typical of the crack-up boom is taking hold. This mass psychological phenomenon is gradually building up and may already be unstoppable. The accelerating crack-up boom is the ideal environment for precious metals, commodities and cryptocurrencies.
Bank of America recently acknowledged in a commentary that “inflation is here.” In doing so, they referenced the exploded number of mentions of “inflation.”
One of the main beneficiaries of the increasing flight out of the fiat systems in recent months has been cryptocurrencies. First and foremost, it was Bitcoin which led the way up for the entire sector.
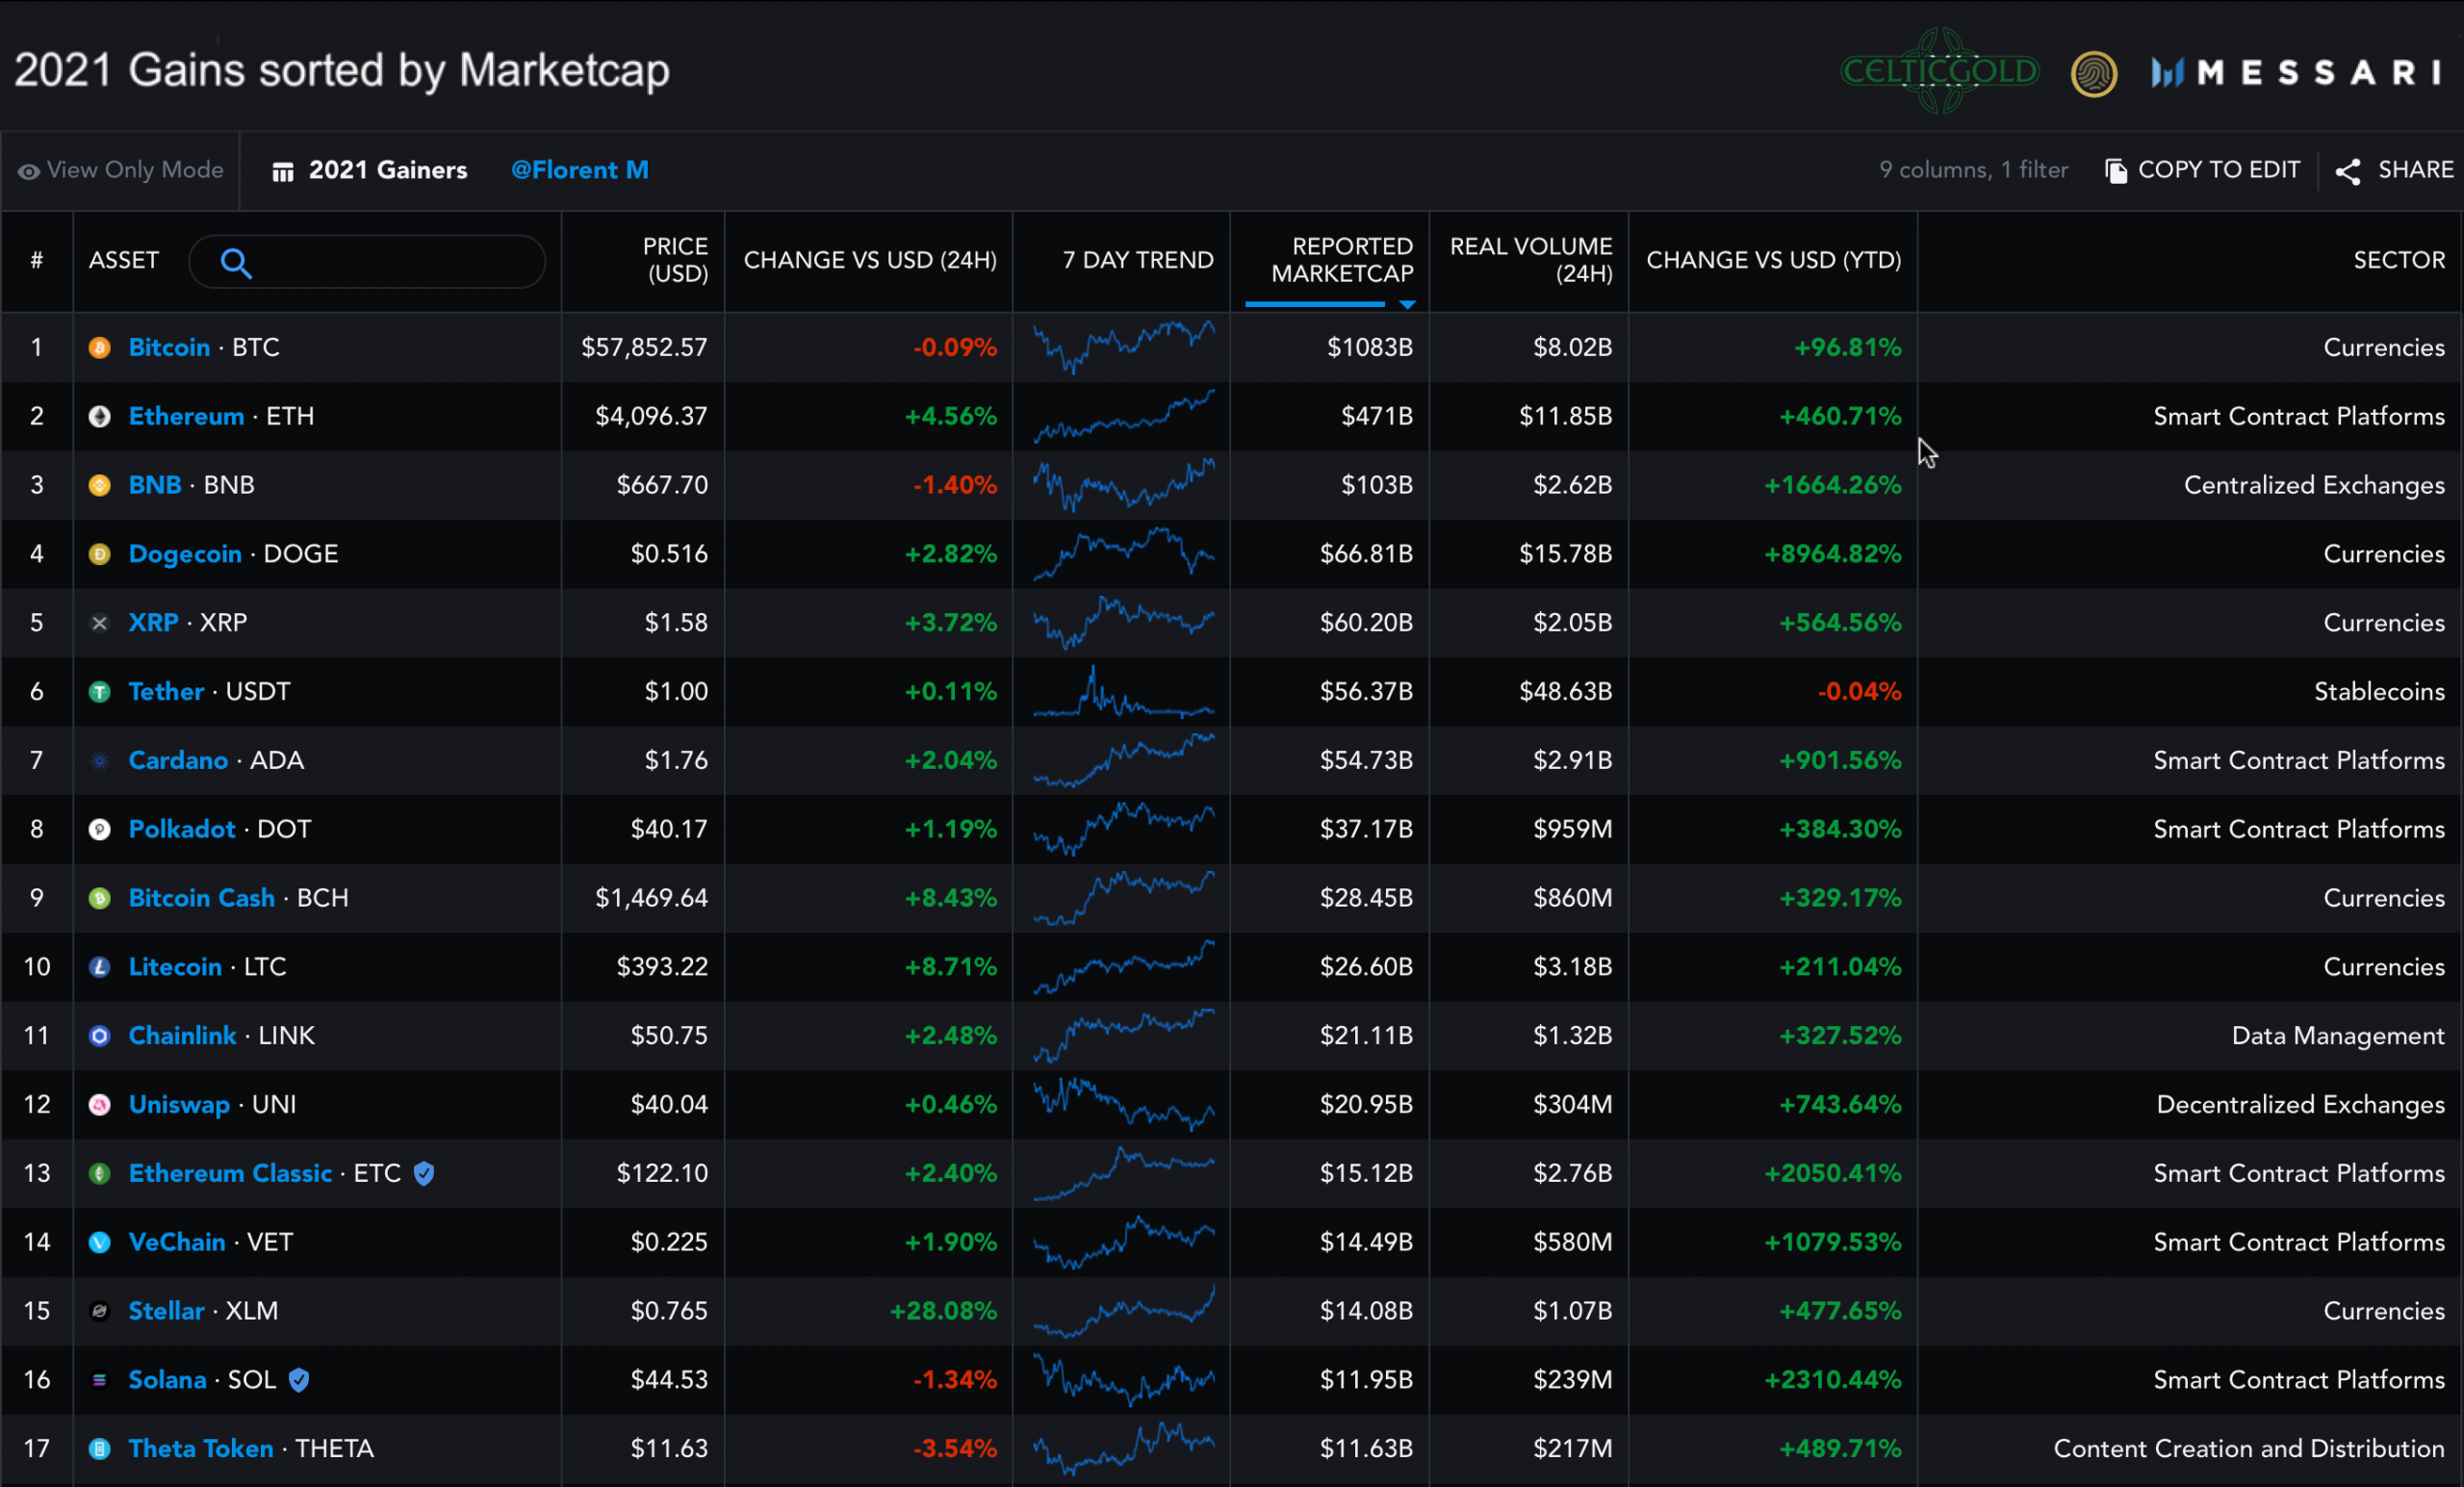
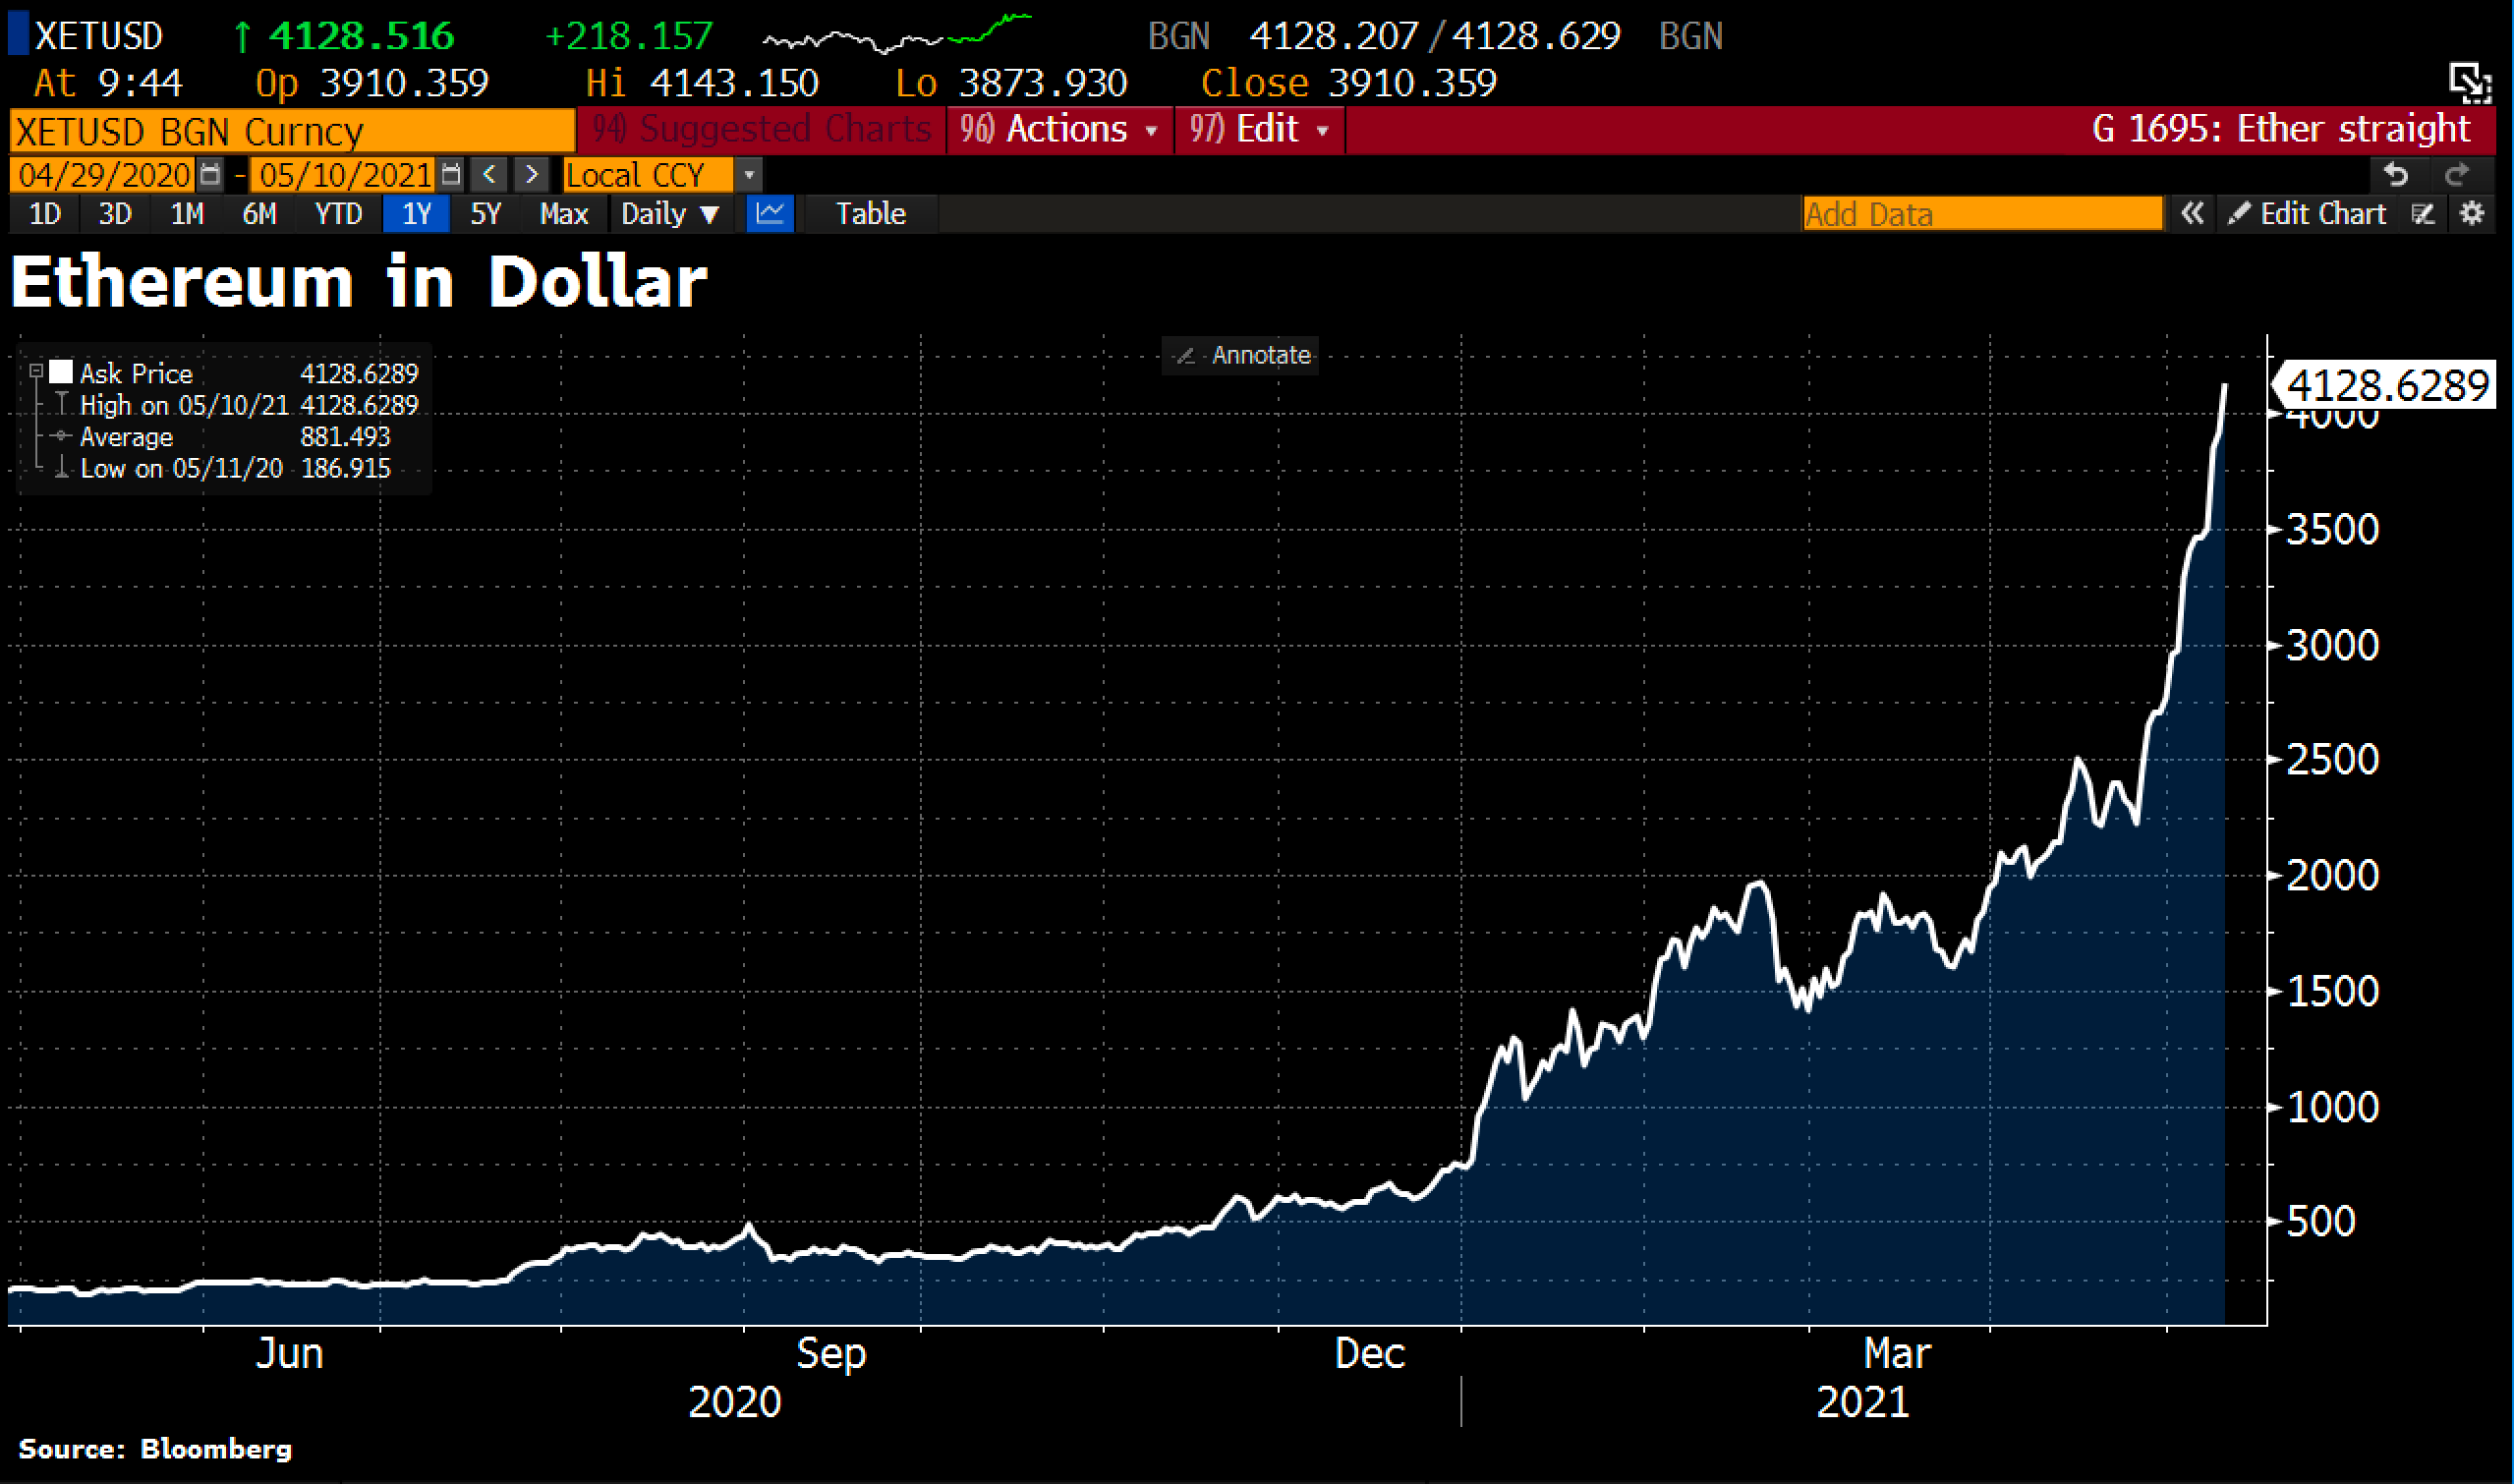
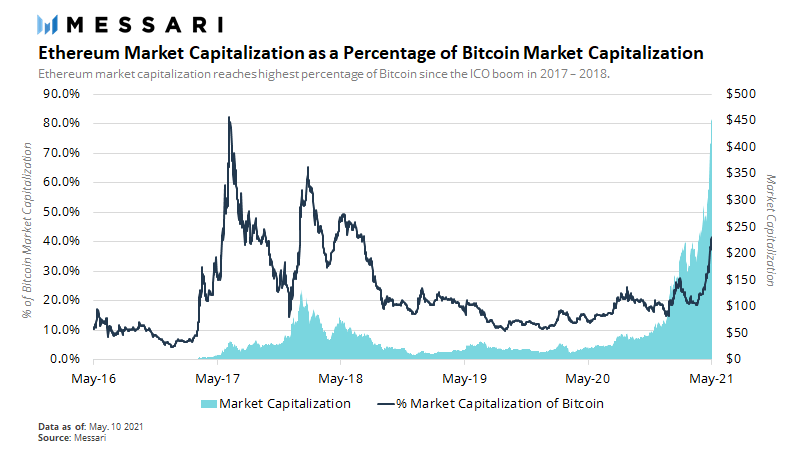
Now, the second largest cryptocurrency by market capitalization, Ethereum, has risen to a new all-time high well above $4,300. Ethereum dominance reached a new record of 19%. Since the beginning of the year, Ethereum has thus gained nearly 500%.
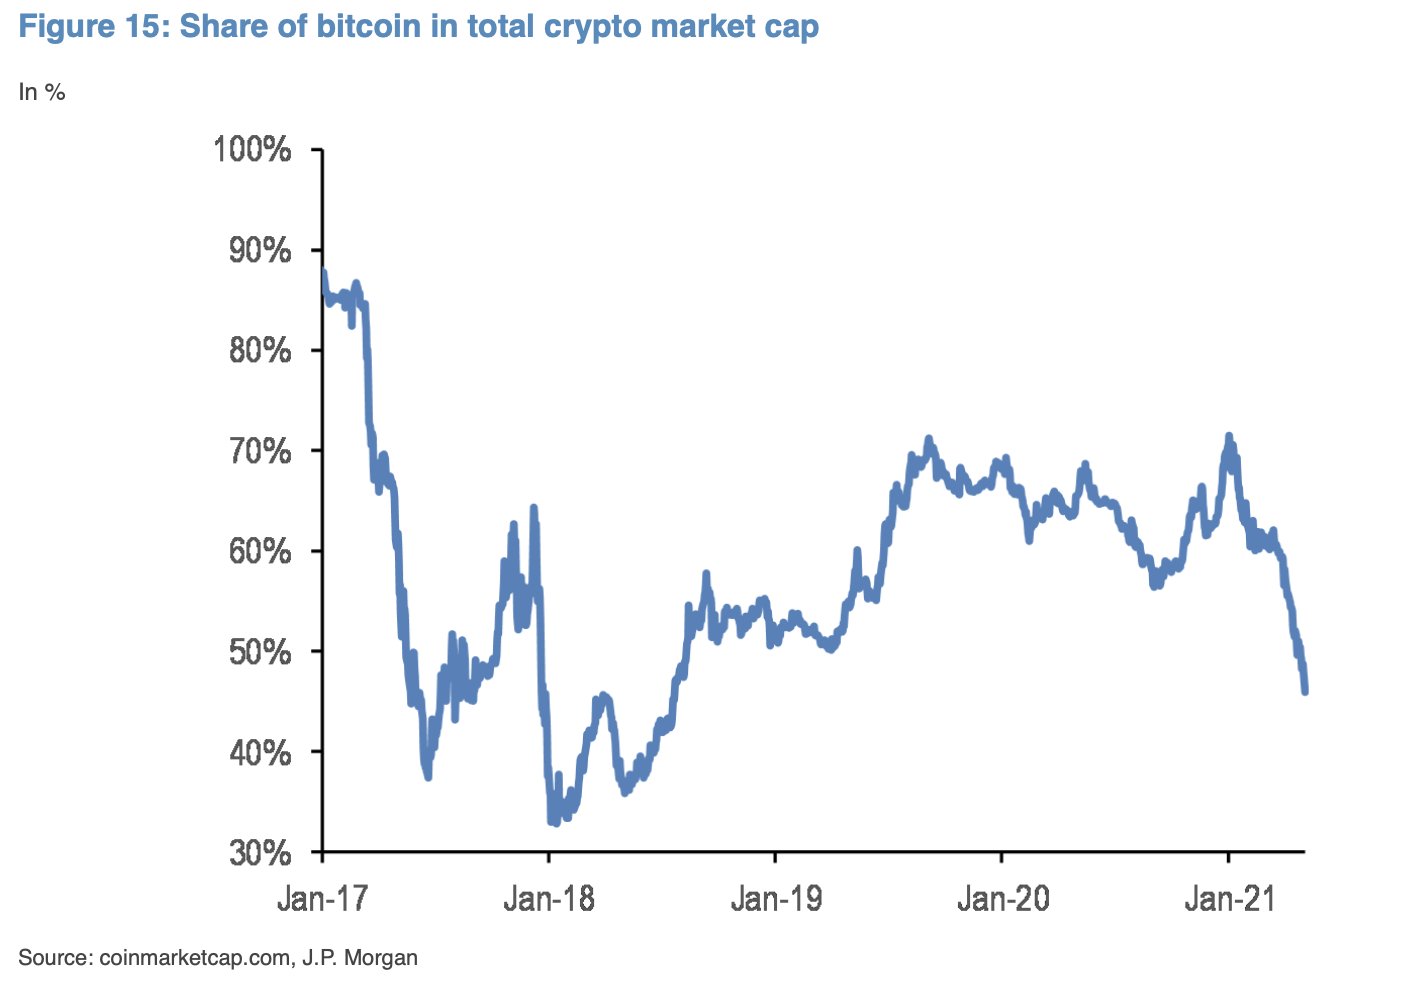
The market capitalization of the entire crypto sector did reach more than US$2.5 trillion. Mainly due to the price explosion in Ethereum and Altcoins during recent weeks, Bitcoin dominance had been fading down to below 44%.
With a Bitcoin dominance of below 40%, however, the air has always been very thin for altcoins in the past, and sharp pullbacks followed in 2017 and 2018.
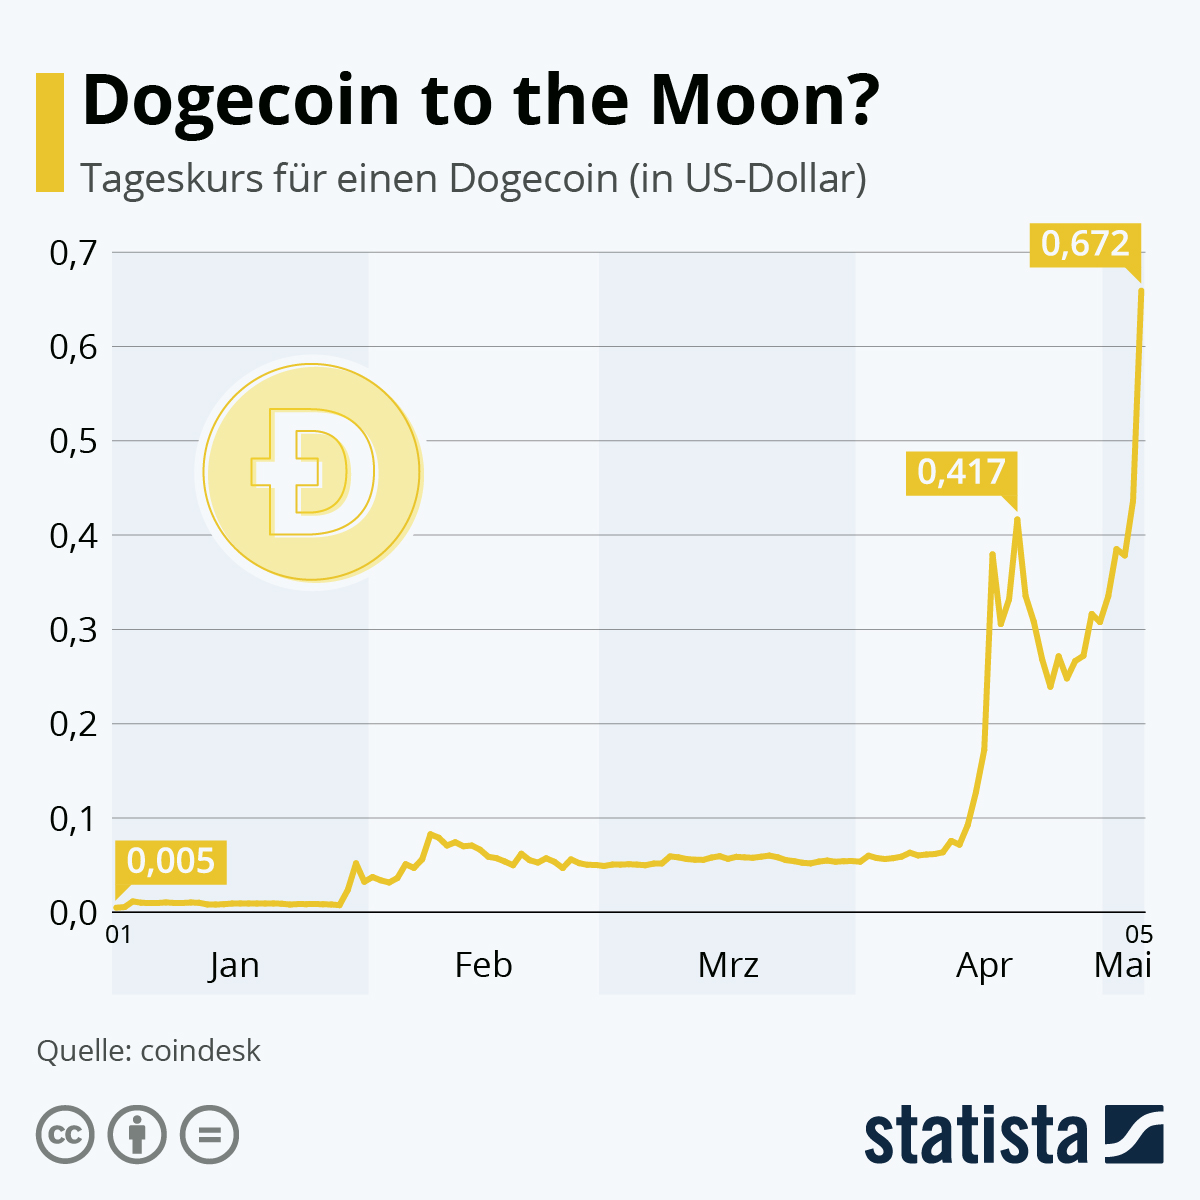

The speculative madness became particularly dramatic in the case of the fun and meme coin Dogecoin. This essentially worthless coin has been rising from US$0.005 to US$0.672 in just a few months, making it worth almost as much as the Daimler (OTC:DDAIF). Once again, the markets are thus providing an example of the extent to which the vast quantities of fiat currencies created out of thin air are distorting everything and fueling wild speculation.
Be careful, be patient!
Overall, it is imperative to advise caution in the current environment. While a long-term top in bitcoin is not yet in sight, a significant correction or sharp pullback should not come as a surprise and would be good for the overheated sector. The “worst case” envisages a pullback in the direction of around US$44,000. In this area, Bitcoin would already be a buying opportunity again. In this scenario, the altcoins would temporarily but very likely take a severe beating. Subsequently, Bitcoin could take the lead again and march on towards US$100,000 once this pullback is done. Alternatively, the tenacious sideways consolidation continues until Bitcoin prices above US$61,000 confirm the continuation of the rally to new all-time highs.

