A number of tight cross-asset correlations seen in the second half of 2011 have continued to unravel throughout 2012. Perhaps the most obvious is the breakdown in the positive EUR/USD: S&P 500 relationship (see chart below). A glaring example of this can be seen in price action just this past Friday – EUR/USD ended the day about +0.64% higher while U.S. equities ended mostly flat.
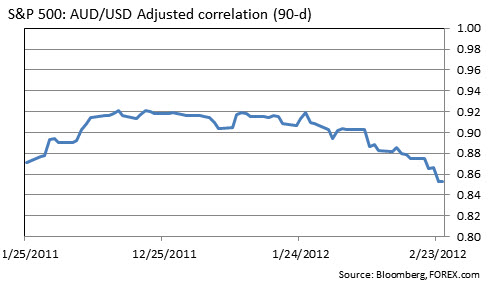
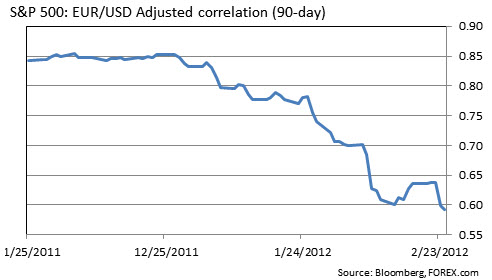 EUR/USD: S&P 500 relationship" title="Chart - 1" width="492" height="280" />Commodity currencies, however, have maintained better relations with U.S. stocks although they’ve shown some signs of stress. While still firm, the positive correlation between AUD/USD & the S&P 500 is well off levels seen late-2011 and earlier this year.
 AUD/USD & the S&P 500" title="AUD/USD & the S&P 500" width="492" height="280" />
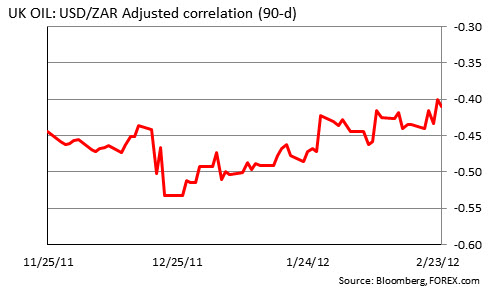
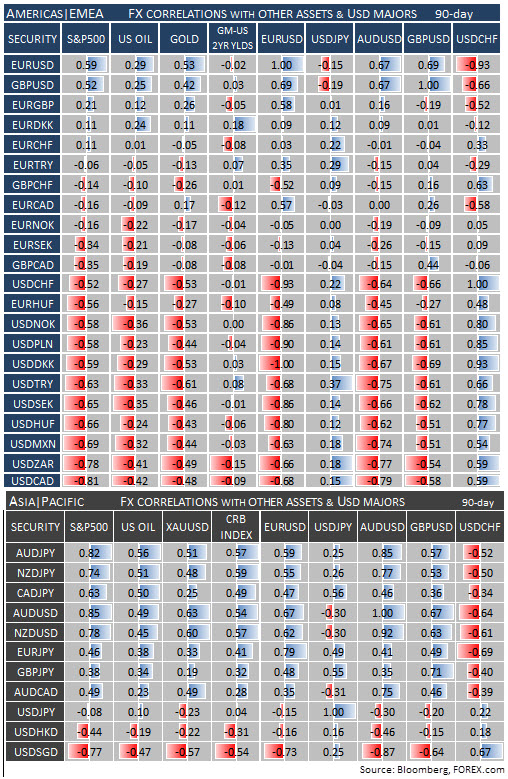
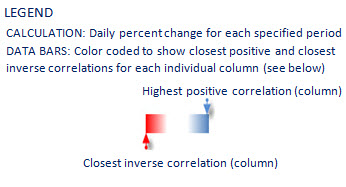
Oil prices remain best correlated in FX with USD/CAD (see matrix below) but were also decently correlated with the South African Rand in the latter part of 2011. This relationship has also weakened recently as evidenced in the current 90-d coefficient of -0.40 compared to -0.50 in January (see chart below).
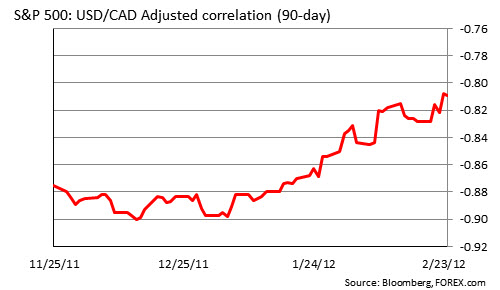
 USD/ZAR" title="Oil & USD/ZAR" width="492" height="280" />Weakening US equity market: FX relationships can also be seen in the softer inverse S&P 500: USD/CAD relationship, also well off levels seen earlier this year.
 USD/CAD relationship" title="S&P 500: USD/CAD relationship" width="492" height="280" />Overall, global markets remain extremely sensitive to Eurozone news-flow with the next main events being the G-20 meeting this weekend and the ECB’s second LTRO on February 29th. Street whispers suggest an allotment closer to the €600bln mark, much higher than the €489bln in December which could be setting the stage for disappointment. While cross asset correlations have fallen off cyclical highs, we think the heavy amount of data/event risks in the week ahead may see relationships tighten somewhat considering significant market shocks in the past have had such an effect.
 EUR/USD: S&P 500 relationship" title="Chart - 1" width="492" height="280" />Commodity currencies, however, have maintained better relations with U.S. stocks although they’ve shown some signs of stress. While still firm, the positive correlation between AUD/USD & the S&P 500 is well off levels seen late-2011 and earlier this year.
  AUD/USD & the S&P 500" title="AUD/USD & the S&P 500" width="492" height="280" />
Oil prices remain best correlated in FX with USD/CAD (see matrix below) but were also decently correlated with the South African Rand in the latter part of 2011. This relationship has also weakened recently as evidenced in the current 90-d coefficient of -0.40 compared to -0.50 in January (see chart below).
 USD/ZAR" title="Oil & USD/ZAR" width="492" height="280" />Weakening US equity market: FX relationships can also be seen in the softer inverse S&P 500: USD/CAD relationship, also well off levels seen earlier this year.
  USD/CAD relationship" title="S&P 500: USD/CAD relationship" width="492" height="280" />Overall, global markets remain extremely sensitive to Eurozone news-flow with the next main events being the G-20 meeting this weekend and the ECB’s second LTRO on February 29th. Street whispers suggest an allotment closer to the €600bln mark, much higher than the €489bln in December which could be setting the stage for disappointment. While cross asset correlations have fallen off cyclical highs, we think the heavy amount of data/event risks in the week ahead may see relationships tighten somewhat considering significant market shocks in the past have had such an effect.

