As the Chinese markets remain closed for the Lunar New Year holiday, which was recently extended until February 2, the impact of the coronavirus on China can be seen through the USD/CNH. With the spread of the virus throughout China, southeast Asia and even across the world, many have questioned what the impact will be on the Chinese and world economy. For example, Germany’s Lufthansa (DE:LHAG) says it will suspend flights to and from China until February 9, Starbucks (NASDAQ:SBUX) is closing half its stores and said the coronavirus will have an impact on Q1 earnings and Morgan Stanley (NYSE:MS) says it is assuming the coronavirus will peak in Feb/March and could cut China’s GDP by 0.5-1% in the first quarter.
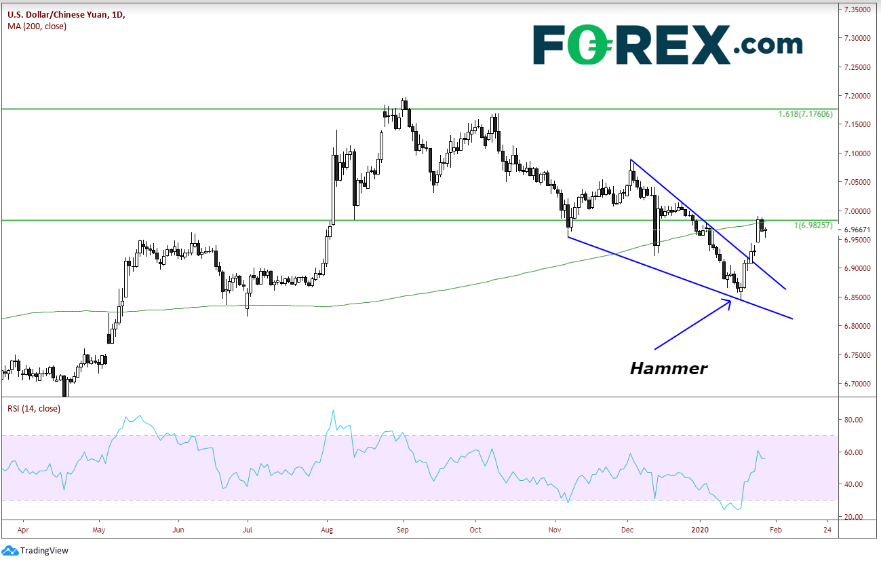
If markets are assuming the coronavirus will have an economic hit on China, then the USD/CNH should be trading higher, which it is. On January 20, USD/CNH put in a hammer candlestick formation, which is a one-candle formation when price trades to new lows early in the day and bounce later in the day to close near unchanged, forming a hammer. Since then, USD/CNH has been moving higher and has traded out of falling wedge. The target for a breakout of a falling wedge is a 100% retracement of the wedge, which is near 7.0865. However on the move higher, the pair has stalled near the psychological level of 7.0000, which is also near the 200-day moving average.

Source: Tradingview, FOREX.com
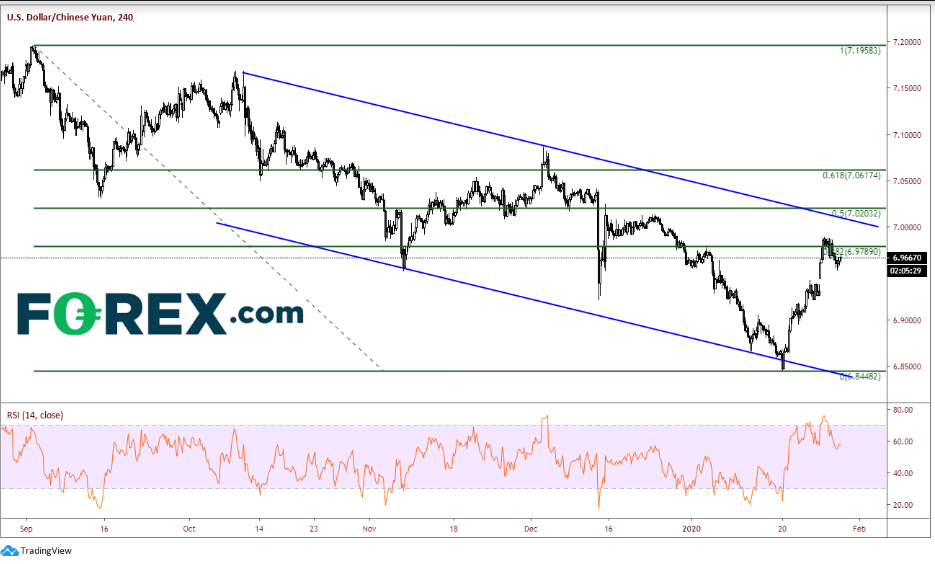
On a 240-minute timeframe, USD/CNH has actually been in a channel downtrend since September 3, 2019. After a false breakdown on January 20 to the hammer lows (on the daily), price moved higher and gapped higher on this past Sunday’s reopen from 6.9265 to 6.9452. The gap has yet to be filled. In addition to the psychological resistance and the 200-day moving average, the stall in price is also near the 38.2% Fibonacci retracement level from the previously mentioned timeframe and the top, downward sloping trendline from the channel.

Source: Tradingview, FOREX.com
7.0000 is first resistance level. If price breaks above, 7.02 is the 50% retracement level of the same timeframe and horizontal resistance. The 61.8% retracement level is near 7.06, however there are small resistance levels to stop the pair from moving back up toward 7.19. First support is the gap-fill from last weekend at 6.9308. Below that is some minor horizontal support near 6.87, but the large support of recent lows and bottom trendline of the channel near 6.8448.
As the coronavirus continues to spread, watch for 2 things in particular that may give an indication that the virus may be slowing: 1) the rate at which it is spreading and 2) the number of companies that are closing operations for a period until the virus is contained. These will give us a better idea of how well the virus is being contained. And if the coronavirus is contained, we may see the 7.0000 level hold in USD/CNH.
