The fundamental “something” that is coming started to show up in DXY and EURUSD today but in reverse form than what the intraday and daily charts were suggesting with DXY nearing the bottom of its multi-week sideways trend and EURUSD breaching the top of its range.
EURUSD’s breakout above its last high should be taken as a serious sign that it may try to stage a significant move higher even though DXY’s chart still suggests that it is trying to move higher and so until the two charts align fully, it remains my inclination to believe that DXY will break above 80 soon and EURUSD below 1.300.
That being said, today’s trading in DXY and EURUSD would suggest otherwise and so let’s bring in some of the equity charts that are showing a fundamental “something” to come as well and one that will be significant enough so as to break the congested sideways trading of recent days/weeks and the very hallmark of a shift-to-come in the fundamentals whether to the positive or the negative. Put otherwise, whatever the fundamental something is that investors have been waiting for clarification around for about a month as told by DXY and EURUSD and for about two weeks as told by some of the equity charts will produce a very clear breakout to the upside or to the downside.
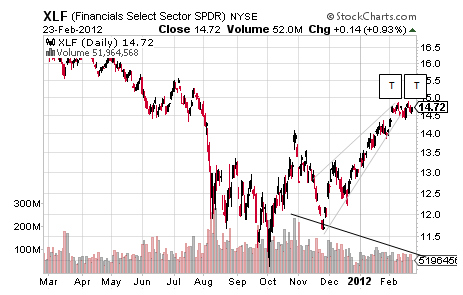
Interestingly, this sideways trading is showing only in select equity-related charts including the Russell 2000 and most of the sector ETFs with the XLF showing something that almost looks like a Double Top in the apex area of a decent Rising Wedge and one built of declining volume that accompanies the slowing buying momentum of that pattern.
In turn, the XLF’s chart set-up looks bearish on the Double Top that confirms at $14.39 for a target of $13.92 and the Rising Wedge that confirms below $14.39 for a target of $11.73, but maybe that Double Top pattern turns out to be congestion that takes the XLF higher and this means confirmation at $14.86 for a target of $15.33. Overall, though, XLF’s chart presents in a more bearish light than not and risk-to-reward profile that is skewed toward risk.
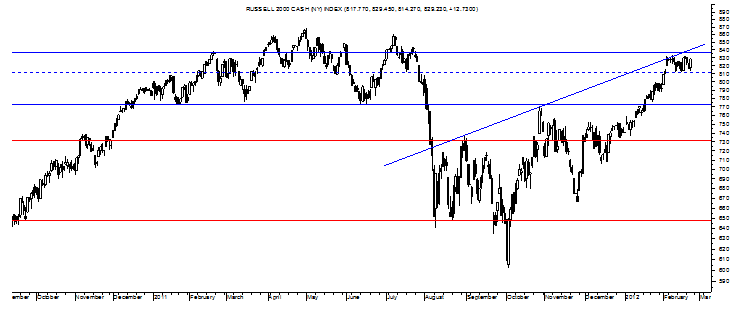
Taking a look at the Russell 2000, this sideways congestion shows very well in a relatively well-established Sideways Trend Channel within the bigger Sideways Trend Channel.
Clearly, resistance around the top of the Sideways Trend Channel is proving formidable as the Russell 2000 trades in what looks like a small Double Top, too, and one that confirms at 812 for a target of 791. But even though the Russell 2000 has been balking below the official neckline of its Inverse Head and Shoulders pattern, maybe this seemingly bearish congestion turns out to be bullish by breaking above 833 to confirm that congestion for an upside target of 854.
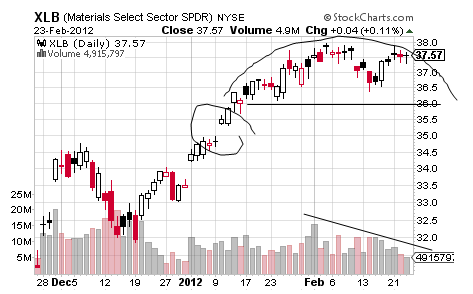
Returning to the sector ETFs, the XLB continues to look vulnerable to the downside on congested trading that matches that of DXY and EURUSD in duration.
The Rounding Top pattern in the XLB confirms at $36.10 for a target of $34.20 and one that is supported by the unclosed gap at $35 along with a gap at about $34.
Worth noting is the fact that the second half of this Rounding Top is built on declining volume and maybe this supports this pattern breaking to the downside as it “should” rather than to an upside target of $39.90 on confirmation at $38.
Speaking of “shoulds”, though, there are a lot of bearish aspects failing and/or being stretched in the bullish direction before a possible bearish snap and so confirmation is required relative to having any confidence in any of these aspects having a shot of succeeding let alone succeeding.
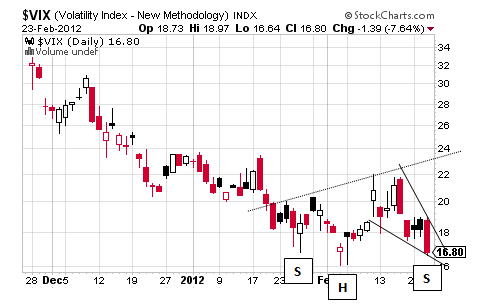
Interestingly, it is the chart of the VIX that suggests these bearish topping patterns comprised of sideways congestion will break correctly to the downside for declines of 5-7% at least.
It continues to trade in an unconfirmed Inverse Head and Shoulders pattern with the Bull Pennant marked in providing one good reason to think the VIX may spike higher soon. Specifically, the Bull Pennant confirms around 18 for a target of about 22 while the IHS confirms around 23 for a target of 30.
Maybe this pattern set-up fails and something that will probably come on the EURUSD moving higher and the dollar index lower as equities continue to climb into the stratosphere, but there are a greater number of technicals supporting that the fundamental “something” to come will push risk down and probably as the dollar index rises.
Until either such scenario plays out, though, the congestion trades on.
- English (UK)
- English (India)
- English (Canada)
- English (Australia)
- English (South Africa)
- English (Philippines)
- English (Nigeria)
- Deutsch
- Español (España)
- Español (México)
- Français
- Italiano
- Nederlands
- Português (Portugal)
- Polski
- Português (Brasil)
- Русский
- Türkçe
- العربية
- Ελληνικά
- Svenska
- Suomi
- עברית
- 日本語
- 한국어
- 简体中文
- 繁體中文
- Bahasa Indonesia
- Bahasa Melayu
- ไทย
- Tiếng Việt
- हिंदी
The Congestion Trades On
Latest comments
Loading next article…
Install Our App
Risk Disclosure: Trading in financial instruments and/or cryptocurrencies involves high risks including the risk of losing some, or all, of your investment amount, and may not be suitable for all investors. Prices of cryptocurrencies are extremely volatile and may be affected by external factors such as financial, regulatory or political events. Trading on margin increases the financial risks.
Before deciding to trade in financial instrument or cryptocurrencies you should be fully informed of the risks and costs associated with trading the financial markets, carefully consider your investment objectives, level of experience, and risk appetite, and seek professional advice where needed.
Fusion Media would like to remind you that the data contained in this website is not necessarily real-time nor accurate. The data and prices on the website are not necessarily provided by any market or exchange, but may be provided by market makers, and so prices may not be accurate and may differ from the actual price at any given market, meaning prices are indicative and not appropriate for trading purposes. Fusion Media and any provider of the data contained in this website will not accept liability for any loss or damage as a result of your trading, or your reliance on the information contained within this website.
It is prohibited to use, store, reproduce, display, modify, transmit or distribute the data contained in this website without the explicit prior written permission of Fusion Media and/or the data provider. All intellectual property rights are reserved by the providers and/or the exchange providing the data contained in this website.
Fusion Media may be compensated by the advertisers that appear on the website, based on your interaction with the advertisements or advertisers.
© 2007-2025 - Fusion Media Limited. All Rights Reserved.
