Note from dshort: I've updated this commentary to include the latest labor force data in today's employment report.
Every week I post an update on new unemployment claims shortly after the BLS report is made available. My focus is the four-week moving average of this rather volatile indicator. The financial press generally takes a fairly simplistic view of the latest number, and the market often reacts, for a few minutes or a few hours, to the initial estimate, which is always revised the following week.
One of my featured charts in the update shows the four-week moving average from the inception of this series in January 1967.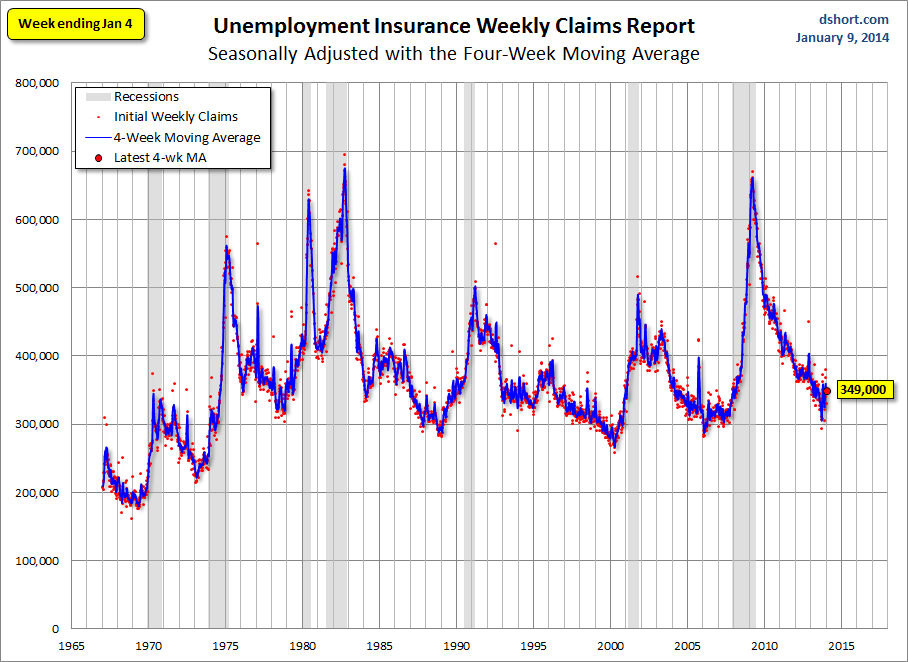
The chart, above, however, gives a rather distorted view of Initial Claims. Why? Because it's based on a raw, albeit seasonally adjusted, number that doesn't take into account the 102% growth in the Civilian Labor Force since January 1967, as illustrated here: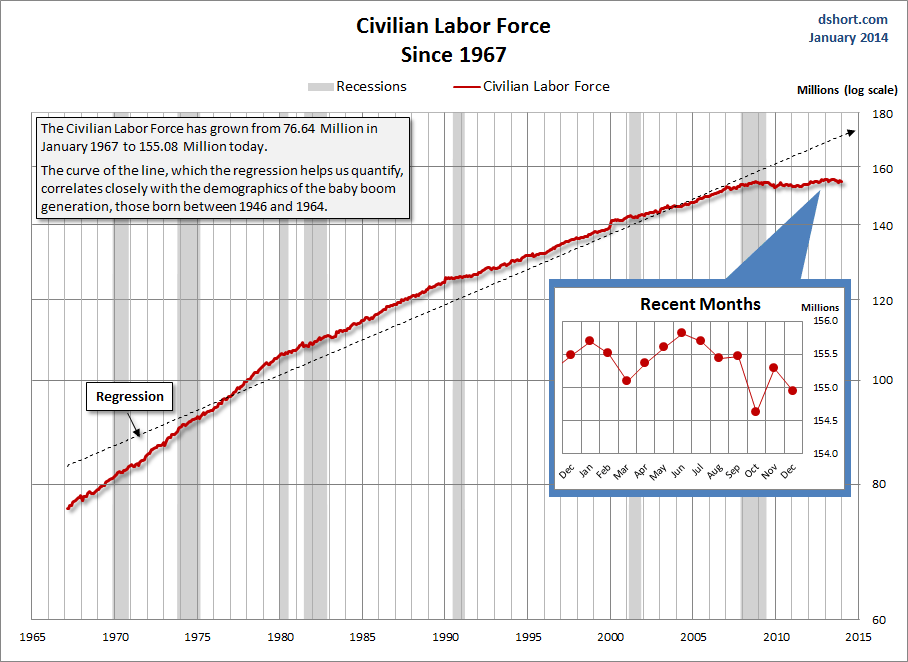
The Civilian Labor Force in the chart above has more than doubled from 76.52 Million in January 1967 to 154.94 Million today. The curve of the line, which the regression helps us visually quantify, largely reflects the employment demographics of the baby boom generation, those born between 1946 and 1964. In 1967 they were starting to turn 21. The oldest are now eligible for full retirement benefits. Another factor is the curve is the rising participation of women in the labor force (see this illustration).
For a better understanding of the weekly Initial Claims data, let's view the numbers as a percent ratio of the Civilian Labor Force.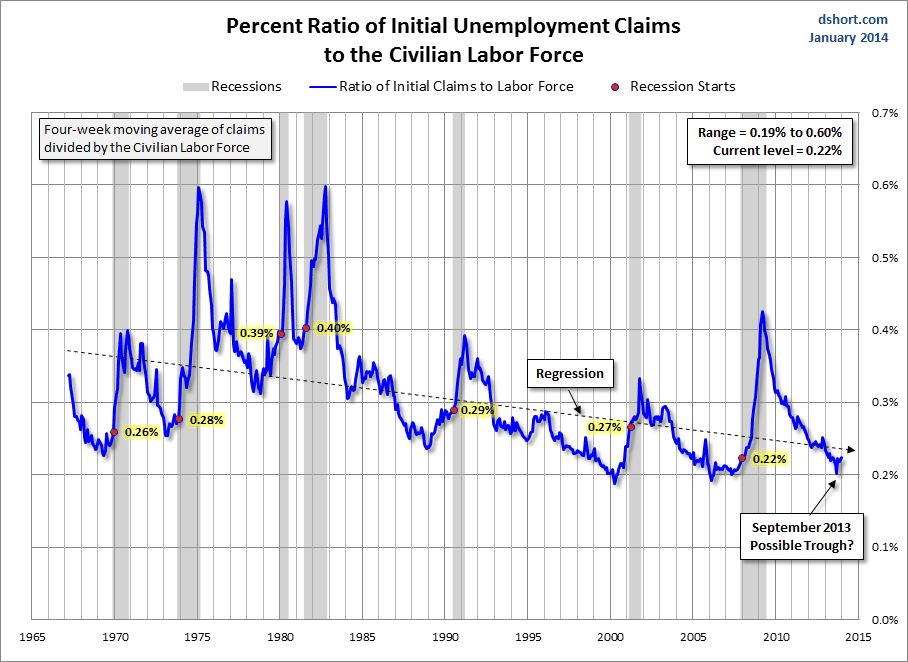
The latest percent ratio of 0.22% means that out of 10,000 workers, twenty two made an initial application for unemployment insurance payments in the latest data, up from an interim low of 0.20% in September. The number during the past year has been hovering just above the low end of the 0.19% to 0.60% range over the last four-plus decades. Initial Claims are substantially below the levels during the business cycles of the stagflation years of the 1970s and early 1980s. However, as I suggest in the chart callout, we may look back on September 2013 as the business cycle trough for this indicator.
What about Continued Claims? Here is their percent ratio to the Civilian Labor Force.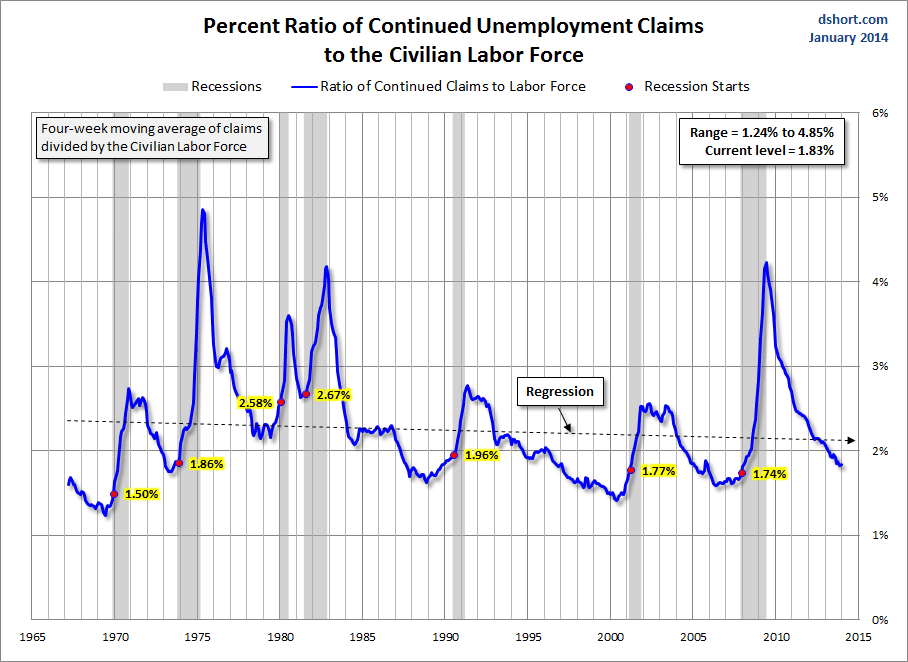
Likewise with this indicator, we're at the low end of the historic range (1.24% to 4.85%). The latest reading, 1.83%, (up from 1.82% last month), means that approximately eighteen persons per 1,000 are receiving continuing unemployment insurance benefits.
Unemployment Claims as a Recession Indicator
A particularly interesting feature of this Unemployment Claims ratio series is its effectiveness as a leading indicator for recession starts and a virtually dead-on coincident indicator for recession ends. In both of the percent ratio charts above, I've highlighted the value at the month a recession starts. In every instance the trough in claims preceded the recession start by a few to many months, but the claims peaks were nearly identical with recession ends. Here is a table showing the actual numbers.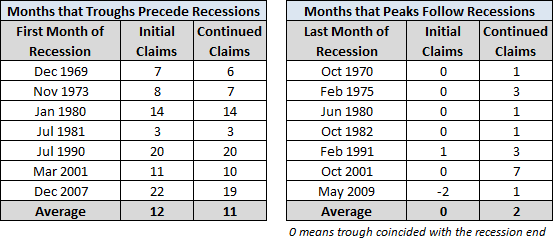
The least lead time from a claims trough to a recession start was three months. That was for the second half of the double-dip that began in July 1981. As I've discussed elsewhere, this was basically a Fed engineered recession to break the back of inflation. The Effective Fed Funds Rate hit its historic monthly average high of 19.1% in June of 1981 and its all-time daily high of 22.4% on July 22, the month the NBER subsequently identified as the recession start.
Current Recession Risk
What does the percent ratio of unemployment claims tell us about our current recession risk? At present, the ratio for Continued Claims has been trending down. However, the ratio for Initial Claim, as I mentioned earlier, may have seen a trough in September. Excluding the 1981 recession, the Initial Claims trough lead time for a recession has ranged from 7 to 22 months with an average of 12 months if we include the 1981 recession and 14 months if we exclude it. Admittedly, the last recession is an extreme example, but the Initial Claims trough preceded its December 2007 onset by a whopping 22 months.
If history is a guide, the current percent ratios of weekly claims to the labor force contradict the minority view that the US is currently in recession (e.g., ECRI and a few bearish bloggers). Instead, the ratios suggests that even a near-term recession would be several months in the future.
For another interesting perspective on employment and recessions see Georg Vrba latest commentary on the topic: The Unemployment Rate Is Not Signaling a Recession: Update.
- English (UK)
- English (India)
- English (Canada)
- English (Australia)
- English (South Africa)
- English (Philippines)
- English (Nigeria)
- Deutsch
- Español (España)
- Español (México)
- Français
- Italiano
- Nederlands
- Português (Portugal)
- Polski
- Português (Brasil)
- Русский
- Türkçe
- العربية
- Ελληνικά
- Svenska
- Suomi
- עברית
- 日本語
- 한국어
- 简体中文
- 繁體中文
- Bahasa Indonesia
- Bahasa Melayu
- ไทย
- Tiếng Việt
- हिंदी
The Civilian Labor Force, Unemployment Claims And Recession Risk
Published 01/10/2014, 02:38 PM
Updated 07/09/2023, 06:31 AM
The Civilian Labor Force, Unemployment Claims And Recession Risk
Latest comments
Loading next article…
Install Our App
Risk Disclosure: Trading in financial instruments and/or cryptocurrencies involves high risks including the risk of losing some, or all, of your investment amount, and may not be suitable for all investors. Prices of cryptocurrencies are extremely volatile and may be affected by external factors such as financial, regulatory or political events. Trading on margin increases the financial risks.
Before deciding to trade in financial instrument or cryptocurrencies you should be fully informed of the risks and costs associated with trading the financial markets, carefully consider your investment objectives, level of experience, and risk appetite, and seek professional advice where needed.
Fusion Media would like to remind you that the data contained in this website is not necessarily real-time nor accurate. The data and prices on the website are not necessarily provided by any market or exchange, but may be provided by market makers, and so prices may not be accurate and may differ from the actual price at any given market, meaning prices are indicative and not appropriate for trading purposes. Fusion Media and any provider of the data contained in this website will not accept liability for any loss or damage as a result of your trading, or your reliance on the information contained within this website.
It is prohibited to use, store, reproduce, display, modify, transmit or distribute the data contained in this website without the explicit prior written permission of Fusion Media and/or the data provider. All intellectual property rights are reserved by the providers and/or the exchange providing the data contained in this website.
Fusion Media may be compensated by the advertisers that appear on the website, based on your interaction with the advertisements or advertisers.
© 2007-2025 - Fusion Media Limited. All Rights Reserved.
