Most investors fail even to make market average returns because it’s so difficult to pick stocks.
The world’s best investors have made billions from investing in stocks. But these investors specialize in equity analysis. For example, Warren Buffett — the world’s best investor and one of the top five wealthiest people in the world — reportedly read 100 years worth of Coca-Cola Company’s (NYSE:KO) annual reports before investing in the company.
This was a colossal undertaking that most average investors just can’t repeat.
Unfortunately, this means that almost all non-professional investors shouldn’t be picking stocks.
The fact of the matter is, you’re more likely to end up losing money than anything else.The odds are stacked against you.
In 2016, JP Morgan’s chairman of Market and Investment Strategy, Michel Cembalest published a research report on stock returns.
What the bank’s researchers found is that between 1980 and 2014 roughly 40% of all the top 3000 stocks in the US (98% of the investable market) suffered permanent 70% declines from their peak values.
However, in total, these equities returned around 10% a year during the period.
How could this group produce double-digit returns when so many companies struggled? Well, as it turns out, a few big winners were responsible for almost all of the gains.
Specifically, nearly 40% of stocks produced a negative return over this period, 20% of stocks went to zero, and 64% of shares underperformed the wider market. Only 10% of the index’s constituents produced returns of 500% or more during the period, meaning less than 10% actually beat the market on an annualized basis.
Research by Arizona State University finance professor Hendrik Bessembinder adds more colour to these findings.
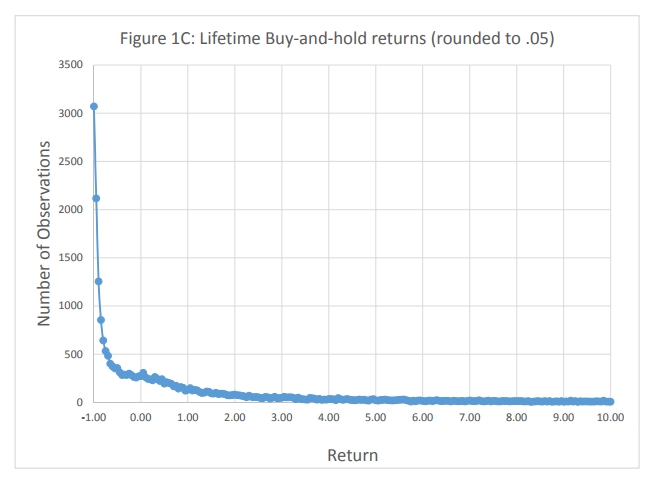
Bessembinder studied the returns of 26,000 stocks over the period of 1926 to 2015. Over this nine-decade time frame, equities created $31.8 trillion of wealth. All of this wealth was generated by just 4% of equities; 96% of stocks achieved nothing.
To put it another way, the average investor has a one in 24 chance of picking a stock that will generate positive returns over the long term.
The evidence against diversification does not stop there. From 1926 through 2009, stocks (as measured by the CRSP total market index) returned 9.6% per year. If you excluded the top 10% of performers, the return would have been only 6.2%. If you eliminate the top 25%, the performance becomes slightly negative at -0.6%.
Considering these findings, it’s no surprise JPMorgan (NYSE:JPM) calculates the chance of actually finding an extreme winning stock is just 7%. Since the 1980s, 40% of all companies experienced a severe loss and never recovered.
Frequency Distributions of Buy-and-hold returns. Image source: Do Stocks Outperform Treasury Bills?

