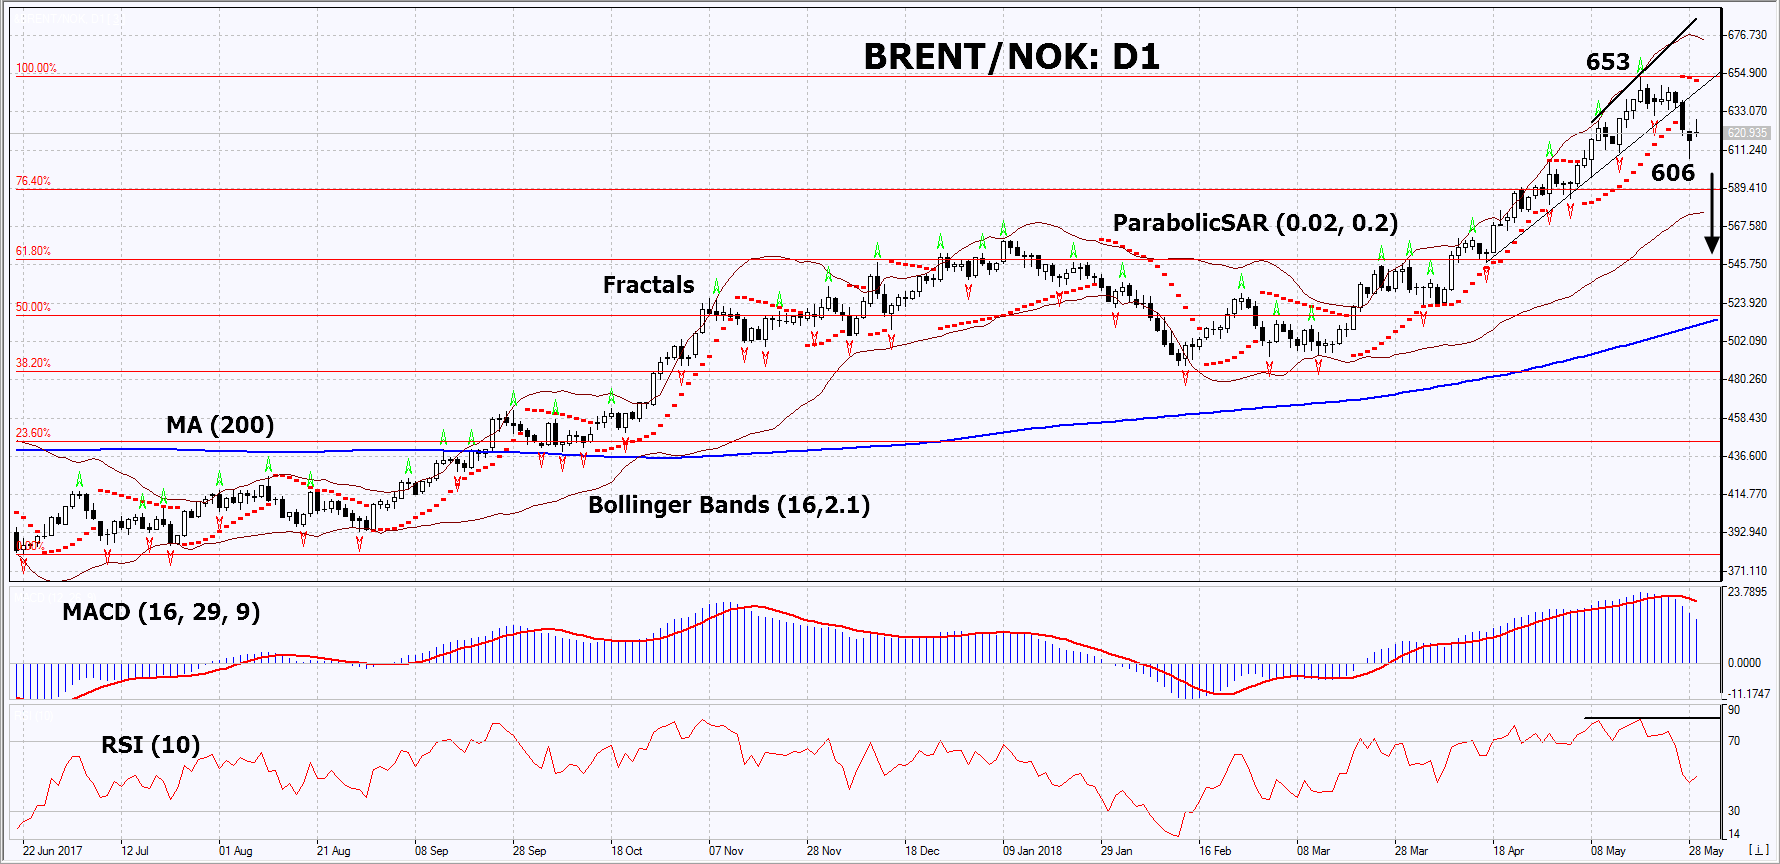
In this review, we suggest considering the personal composite instrument (PCI) “BRENT against the Norwegian krone”. It reflects the dynamics of the price change per barrel of Brent relative to the Norwegian currency. Will BRENT/NOK prices fall?
This movement would mean that oil prices fall, while the Norwegian krone strengthens. The current decline in oil prices is due to the expectations of market participants that the world major producers - Saudi Arabia and Russia will increase their production amid its possible reduction in Iran and Venezuela because of the US sanctions. Let us recall that the US is going to impose economic sanctions on Iran because of its nuclear program and on Venezuela, as the US does not recognize the results of the presidential elections, which again won Nicholas Maduro. At the next OPEC meeting on June 22, the production of the cartel and independent manufacturers, including Russia, could be increased by 1 million barrels per day. From its recent high (since November 2014), Brent prices have already fallen by 7%. The US oil production has grown by more than a quarter in the last 2 years and reached 10.7 million barrels per day. The US Oil reserves unexpectedly increased by 5.8 million barrels last week, which was an additional negative factor for oil. In turn, the statement of the head of Norway’s central bank Oeystein Olsen that the economic indicators of Norway correspond to the forecasts contributes to the possible strengthening of the Norwegian krone. The GDP in the 1st quarter of 2018 increased by 0.6% after a decrease by 0.3% in the 4th quarter of 2017. The Norwegian Central Bank may start to tighten monetary policy and raise rates this autumn. It should be noted that it is now 0.5% with a noticeably higher inflation at 2.5% in April in annual terms. Inflation data for May will come out on June 11 and may affect the rate of the Norwegian krone. The balance of the current account of Norway for the 1st quarter of this year will be published on June 6.

On the daily timeframe, BRENT/NOK: D1 breached down the support line of the accelerated uptrend. The medium-term uptrend endures, but the PCI is correcting down from the high since August 2014. Positive economic news from Norway and an increase in world oil production may contribute the decrease of prices.
- The Parabolic indicator gives a bearish signal.
- The Bollinger bands® have widened, which indicates high volatility. The upper band is titled downward.
- The RSI indicator is near 50. It has formed a weak, negative divergence.
- The MACD indicator gives a bearish signal.
The bearish momentum may develop in case BRENT/NOK falls below its last low and the two last fractal lows at 606. This level may serve as an entry point. The initial stop loss may be placed above the last fractal high, the 4.5-year high, the last fractal high and the Parabolic signal at 653. After opening the pending order, we shall move the stop to the next fractal high following the Bollinger and Parabolic signals. Thus, we are changing the potential profit/loss to the breakeven point. More risk-averse traders may switch to the 4-hour chart after the trade and place there a stop loss moving it in the direction of the trade. If the price meets the stop level at 606 without reaching the order at 653, we recommend to close the position: the market sustains internal changes that were not taken into account.
Summary of technical analysis
Position Sell
Sell stop Below 606
Stop loss Above 653
