In January 2016, global foreign reserves (FX) continued their decline after an absolute peak in June 2014, declining significantly in distressed emerging countries and some notable oil-producing economies (see Figure 1).
Figure 1.
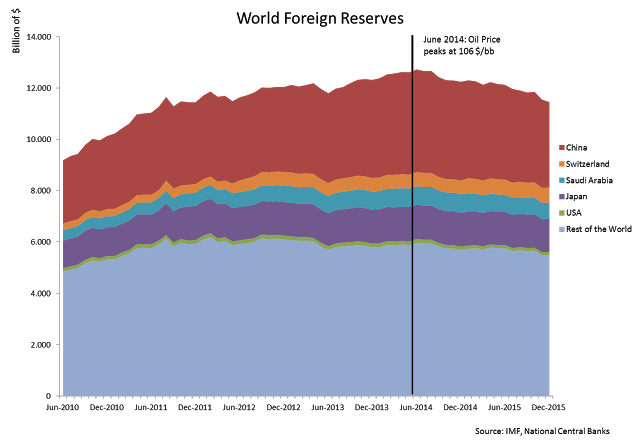
China and Saudi Arabia, the leading owners of foreign reserves outside the OECD circle, both experienced an outflow greater than 5% of their outstanding reserves in less than 6 months (see Figure 2). A common factor explains these drawdowns: both the countries are struggling to defend their currency peg to the dollar. The pressures on the exchange rates can be traced back to three intertwined drivers: the (still to come) interest rate hike cycle in the US, the low oil price and the China slow growth. While the “US rate hike tantrum” can be considered as a symmetrical shock for all the worlds currency different from the dollar, the other factors have hit the distressed countries in differentiated ways.
From the Chinese side, the worsening growth’s prospects and strong capital outflows are forcing the People bank of China (PBOC) to employ its FX reserves with the aim to manage a controlled, but unavoidable, devaluation. Meanwhile, the persistent slump oil price (that depends a lot from China’s slowdown) have decimated the revenues of the Saudis. Since these money flows count for over 80% of the State budget, the government is now tapping the debt market at the astronomical pace of 16% of GDP at year to compensate for the loss. This dramatic reversal in the health of public finances obviously put pressure on the fixed peg with the dollar.
Figure 2.
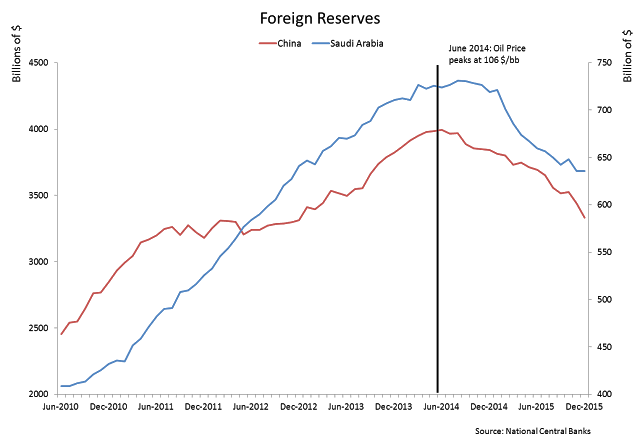
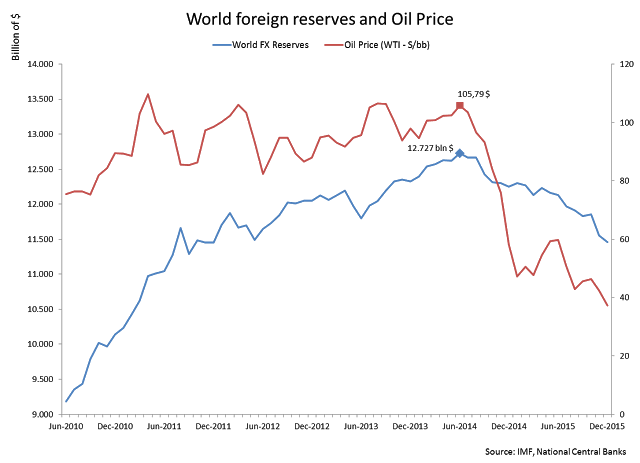
Indeed, as it emerges from the comparative analysis of Figures 1,2, both the declines for China and Saudi Arabia took off and reinforced during the prolonged crash of the oil price. The same phenomenon can be appreciated on a global scale (Figure 3): world FX reserves peaked and declined in sync with the oil price. Net of “value effects” that depend from the changing composition of the reserves, falling oil revenues and GDP slowdown in major exporting countries remain significant explaining factors.
Figure 3.
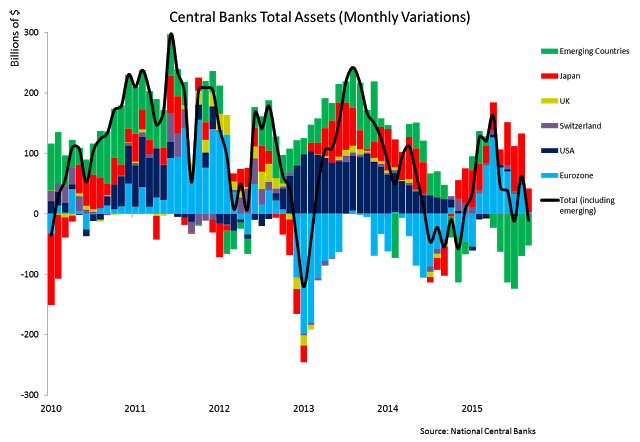
A central bank’s monetary policy stance is often captured better by changes in their overall balance sheet that comprehend both FX reserve movements than other conventional monetary policy actions, e.g. reserve rates cuts or repo operations. Broad-based indicators such as monthly variation in central bank total assets are more informative of the aggregate global value of central bank liquidity.
Figure 4 illustrates the historical movements of central bank assets in the past 6 six years: Fed QE 2 and 3 are clearly identified by the navy bars, and Shinzo Abe’s QQE (Qualitative and Quantitative Easing) is captured by the red bars. The first expansion in ECB balance sheet of 2011-2012 (light blue bars) is attributable to the two big LTROs, and the subsequent contraction is due to LTROs repayment by European banks. In 2015 the Draghi QE (the Public Sector Purchase Programme or PSPP) has taken off and has pushed the ECB net liquidity flows in positive territory. It’s interesting also to notice the expansionary pulses of the Swiss National Bank (SNB) monetary policy, aimed at maintaining the peg of the Swiss franc with the Euro in 2012-2014. The last frantic efforts ended suddenly in January 2015, when the ballooning the of SNB balance sheet and the accelerating expansion of the monetary base forced the SNB to readjust the CHF/EUR exchange rate.
Figure 4.
Declining FX reserves caused concern in global markets following the decision of the PBOC to abandon the Renminbi fixed exchange rate with the dollar. Struggling against mounting pressures on the USD/CNY exchange rate, the People Bank of China flooded the market with US Treasuries, causing a spike in yields and turmoil in global equities. Since selling foreign assets acts as a counterbalance to Quantitative Easing, some market participants applied the phrase Global Quantitative Tightening (QT). In other terms, by liquidating US Treasuries and other OECD government and private bonds, the central banks of emerging countries resupply the market of securities, balancing the purchase made by their OECD counterparts. This QT action by emerging and oil-exporting countries would therefore drain liquidity from the market, neutralizing expansionary policies of Eurozone and Japan. In this perspective the $ 130 billion of fresh money injected monthly via asset purchases by the OECD central banks would be offset by their emerging counterparts.
Our indicator of central banks' global liquidity seems to support this reconstruction. In 2015, EM central bank sales of foreign assets reduced central banks’ liquidity flows (Figure 5). The effect began in July and peaked in September during the Renminbi crisis.
Figure 5.
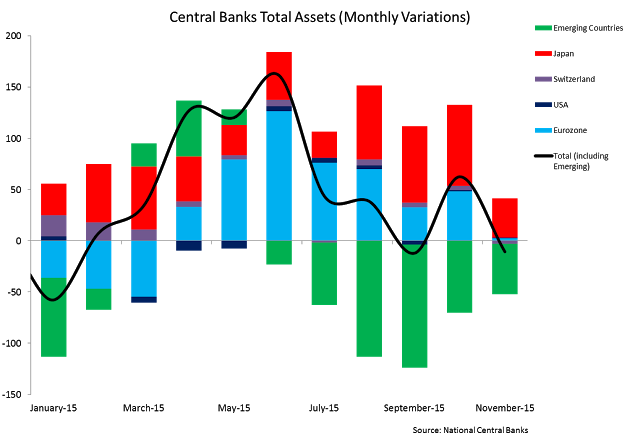
The concept of global QT gained traction in September 2015 as the negative correlation between global equities and foreign reserves increased. The Fed’s decision to maintain interest rates relieved the downward pressures on Renminbi and the interest in QT quickly waned.
There have been reasoned opinions on the economic theory behind global QT. More than one analyst correctly observed that a USD asset sales by foreign central banks will not drain liquidity and counteract Fed monetary policy because these assets simply change hands and do not disappear. Changing ownership does not preclude reinvestment in the US banking system, which limits the sale’s tightening effect. Moreover, as already pointed out, changes in foreign reserves may not reflect a central bank’s attitude towards monetary policy since they do not account that other conventional monetary policy actions on banks’ reserves or interest rates can dominate changes of foreign reserves.
In the last quarter of 2015, the correlation between global stock indices and central banks net liquidity is again up (see Figure 6).
Figure 6.
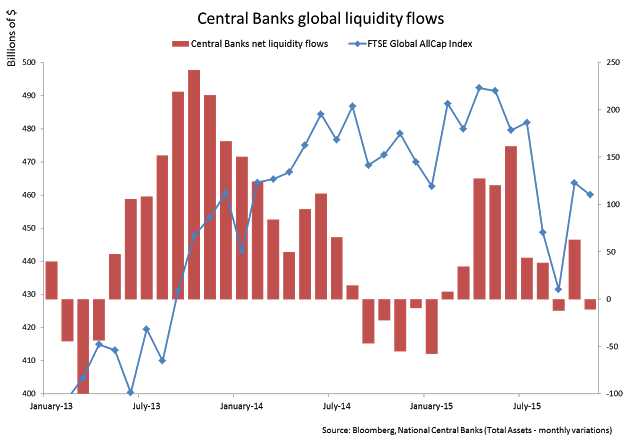
Remarkably, temporary positive net flows of central banks liquidity are associated with the markets rebound of October 2015.
We are obviously aware that correlation does not necessarily mean causation. From a broader perspective, it's more than reasonable that the same three cyclical drivers that explain drawdowns in foreign reserves (China’s slowdown, the US rate hike cycle, and collapsing oil prices) are also affecting equity markets.
We should acknowledge these changes in foreign reserves as a reaction by emerging countries central banks to these three primary factors. Nevertheless, their impact on net liquidity, which may mitigate monetary expansion by the ECB and BoJ should be worthy of further investigation.
