Summary
Key International Data
China/Japan/Australia
China
Japan
Australia
Asia conclusion: the news from China was positive -- the manufacturing sector is now expanding and the composite reading shows an economy that is growing. Japan's data was negatively impacted by a sales tax hike that pulled activity forward while also raising temporary concern among the business sector. Australia continues to grow moderately.
Canada/Mexico
Canada
Mexico
Canada/Mexico conclusion: Canada continues to expand moderately. Unemployment is steady; while building permits were down from last month, the overall trend for the last few years is moderately higher. Mexico, on the other hand, continues to have economic problems. The economy is in a technical recession, which explains why business investment is contracting.
EU/UK
EU
UK
UK/EU conclusion: Brexit continues to hurt the UK economy; the PMI numbers are weak and the BOE noted that the underlying pace of growth is slowing since the Brexit vote (see below). The EU is expanding modestly; the PMI figure is just north of 50.
Key Central Bank Actions
The RBA kept rates at 0.75%.Here is how the bank described the Australian economy (emphasis added):
The outlook for the Australian economy is little changed from three months ago. The central scenario is for the Australian economy to grow by around 2¼ per cent this year and then for growth gradually to pick up to around 3 per cent in 2021. The low level of interest rates, recent tax cuts, ongoing spending on infrastructure, the upswing in housing prices in some markets and a brighter outlook for the resources sector should all support growth. The main domestic uncertainty continues to be the outlook for consumption, with the sustained period of only modest increases in household disposable income continuing to weigh on consumer spending. Other sources of uncertainty include the effects of the drought and the evolution of the housing construction cycle.
Later in the week, the bank released its Statement of Monetary Policy, which contained the following observations about the domestic economy:
The Bank of England maintained rates at 0.75%. Here is how the bank described the current situation (emphasis added):
Looking through Brexit-related volatility, underlying UK GDP growth has slowed materially this year and a small margin of excess supply has opened up. That slowdown reflects weaker global growth, driven by trade protectionism, and the domestic impact of Brexit-related uncertainties.
The accompanying monetary policy report demonstrated the breadth of UK weakness, with soft readings for household consumption, business investment, and exports. The combined impact of this weakness is variable rates of slow-growth readings this year along with weaker growth over the last four years:
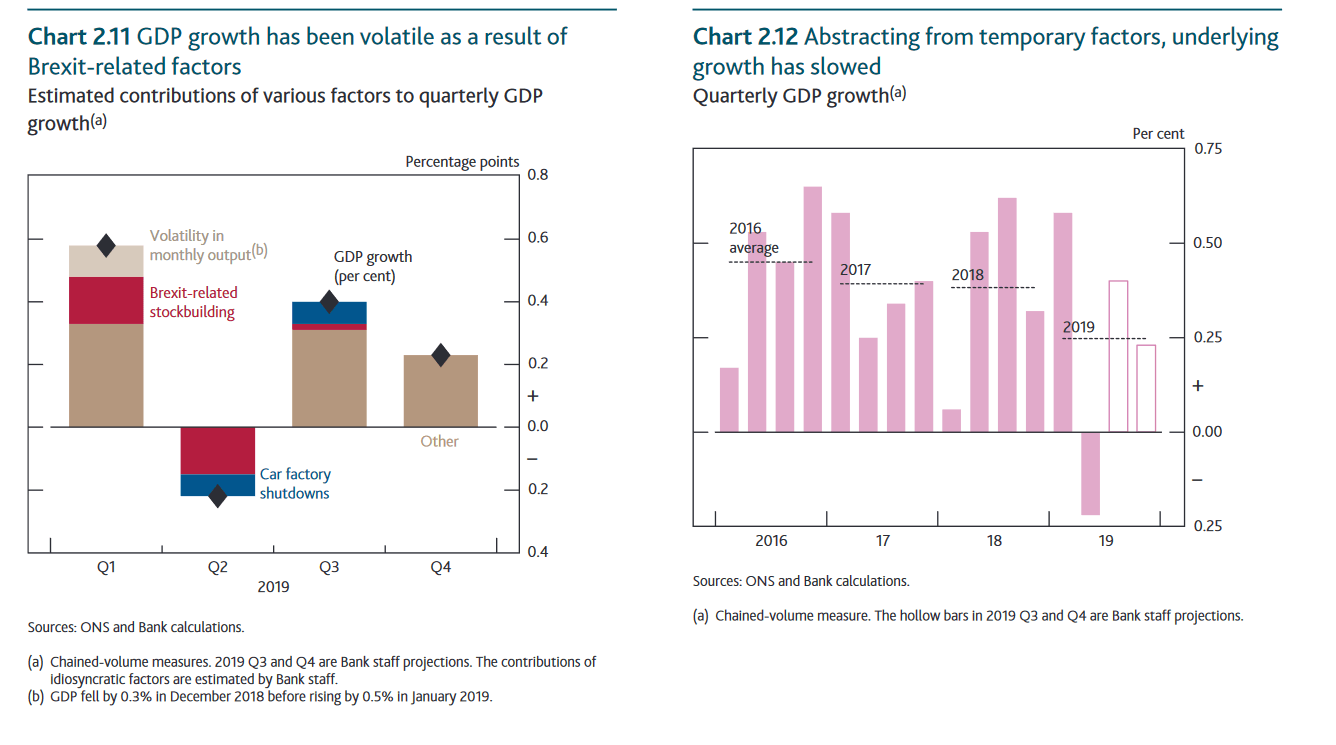
The left chart shows the fluctuating nature of UK growth over the last year. In the first quarter, Brexit's initial date of March 31 pulled orders forward. This is partially responsible for the decline in growth in 2Q19, as is the shutdown of auto production facilities in the UK. Growth rebounded modestly in 3Q19, but not by much. The right chart shows that, once temporary factors are stripped from GDP data, overall growth is not only weak but declining since the Brexit vote in 2016.
Key US Data
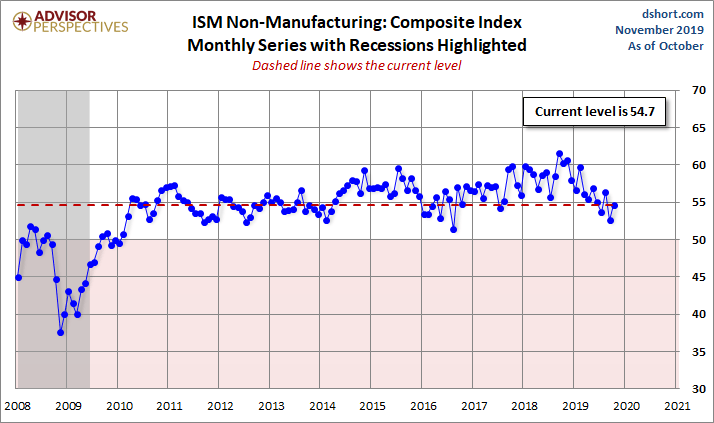
This was a light week for US economic news. The key piece of new data was the ISM non-manufacturing index, which rose 2.1 points to 54.7. All three key sub-indexes (employment, new orders, and production) rose while 13 of 18 surveyed industries reported growth. The anecdotal comments were mostly positive (emphasis added):
The chart of the headline index shows that the services industry is still clearly in an expansion:
In contrast is the manufacturing industry report, which contracted for the third consecutive month (headline number 48.3). New orders, production, and employment were all below 50, indicating contraction. Only five industries reported growth. The anecdotal comments were most cautious or negative (emphasis added):
The potential positive resolution to the trade war news from earlier in the week would be a huge boon to business.
The headline number is in a solid decline:
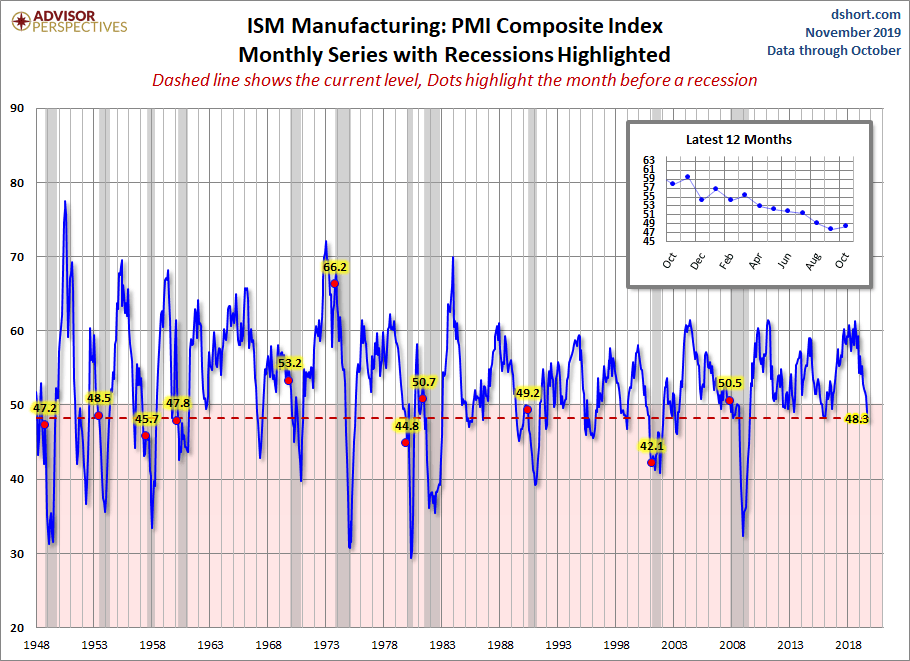
US Conclusion: overall, the US is still in good shape. While manufacturing is contracting, it's a small portion of the economy and the weakness has only existed for three months. Services, on the other hand, are expanding at a decent rate, which should continue to support growth.
US Markets
Let's start with the performance tables:
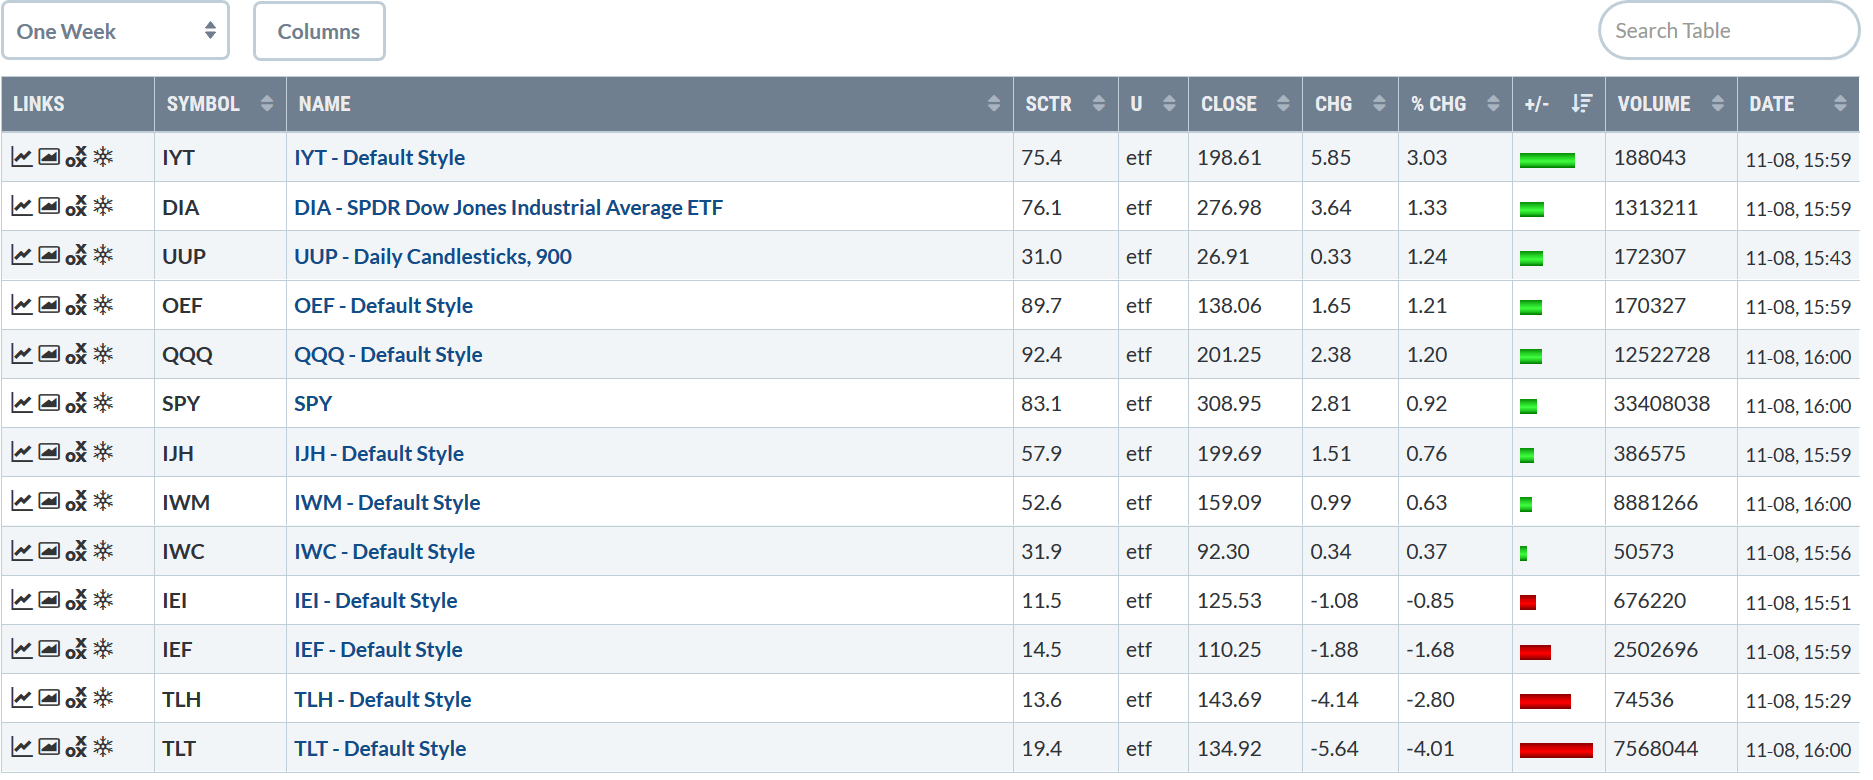
Let's begin at the bottom: Treasuries sold off this week, with the long end dropping 4% and the belly of the curve falling 1.68%. Small-caps were up, although their gains were less than 1%. The large-caps wound up gaining a bit more than 1%.
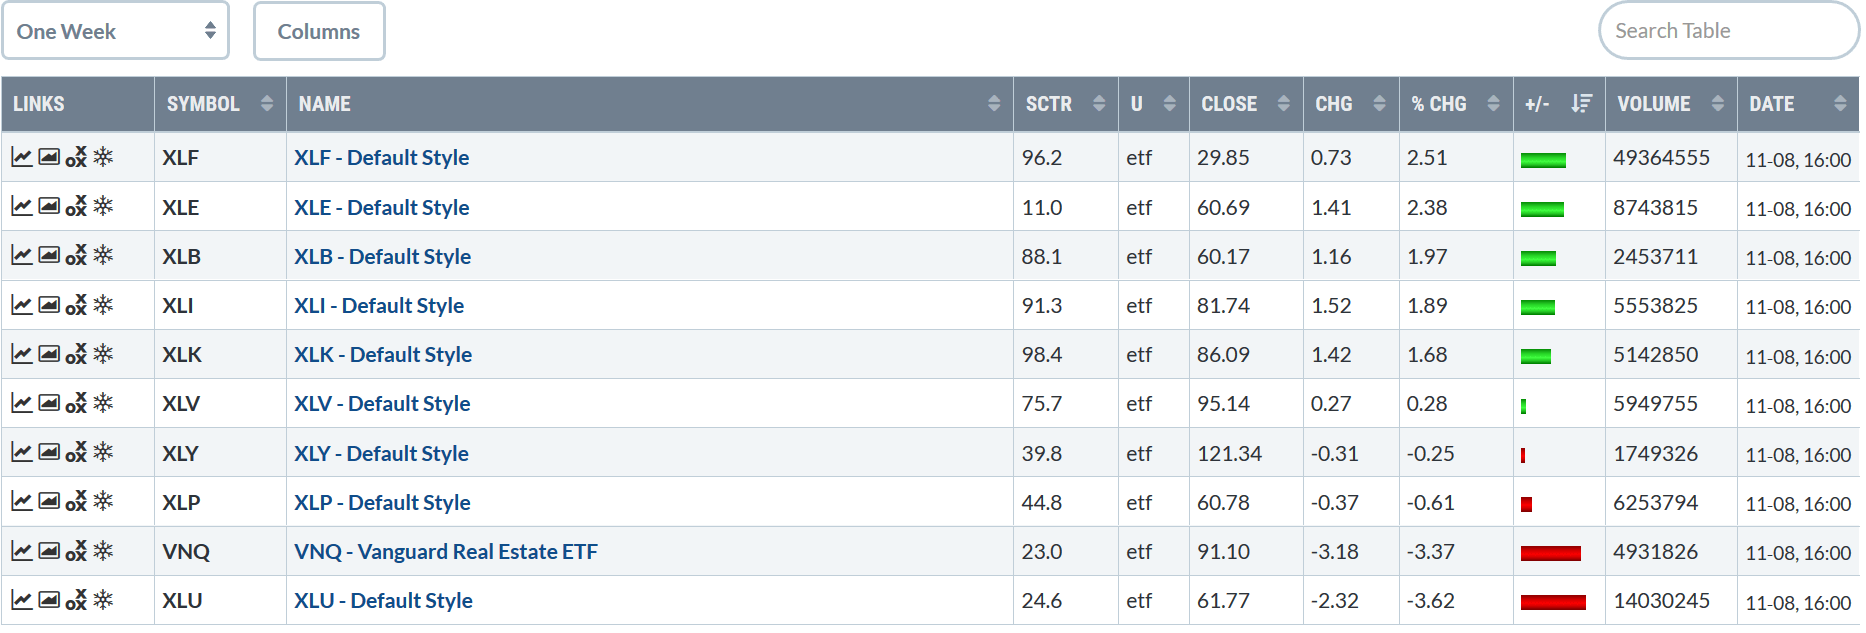
The sector performance table is very bullish. Defensive sectors were off this week: real estate was down 3.37% and utilities dropped 3.62%. Combined with the weak Treasury market performance, this indicates that the bulls are in control. The sectors that did rise are aggressive sectors: financials, energy, basic materials, and industrials. This solidifies the argument that bulls are running the market.
Let's take a look at the charts for the major indexes, starting with the SPYs:
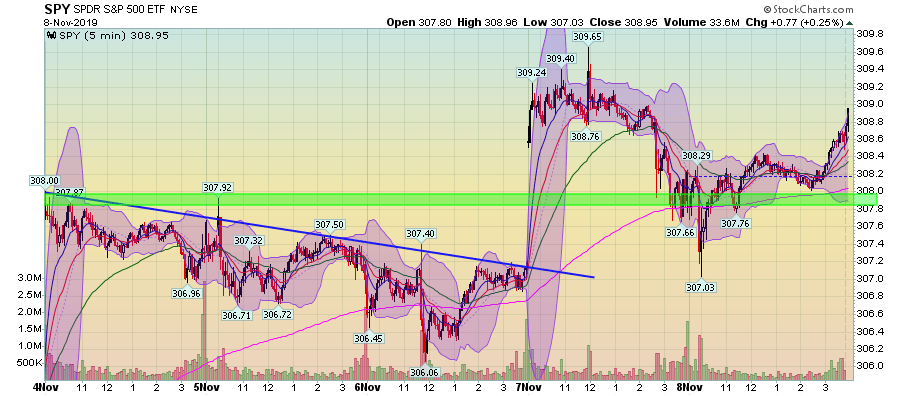
There were two trends this week: a modest but controlled selloff between Monday and Wednesday followed by a modest move higher at the open on Thursday. Prices ended the week on a rally, which means bulls weren't concerned about negative news occurring over the weekend.
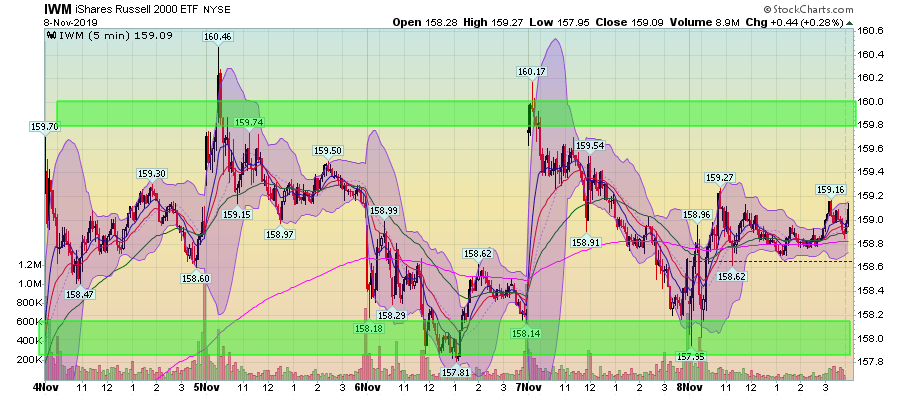
Instead of rallying with the SPYs, the iShares Russell 2000 (NYSE:IWM) moved sideways, trading between 158 and 160.
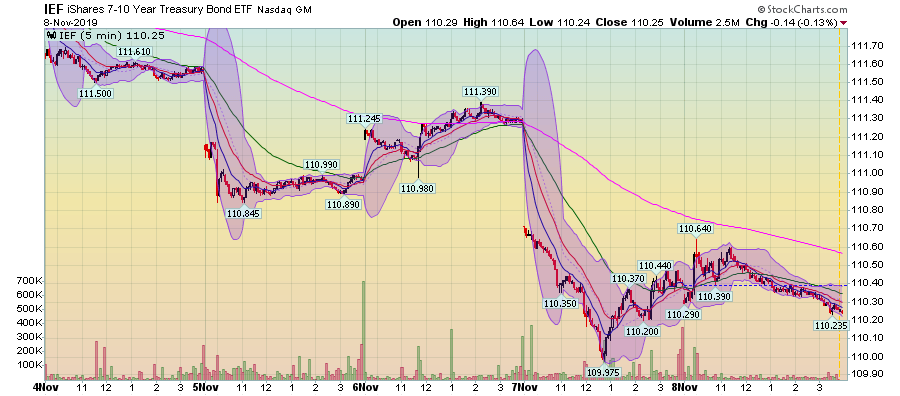
And the iShares 7-10 Year Treasury Bond (NASDAQ:IEF) sold off. The ETF gapped lower on Tuesday and Thursday. While prices tried to rally twice, the rallies failed.
The 30-day charts for the indexes show a strong rally:
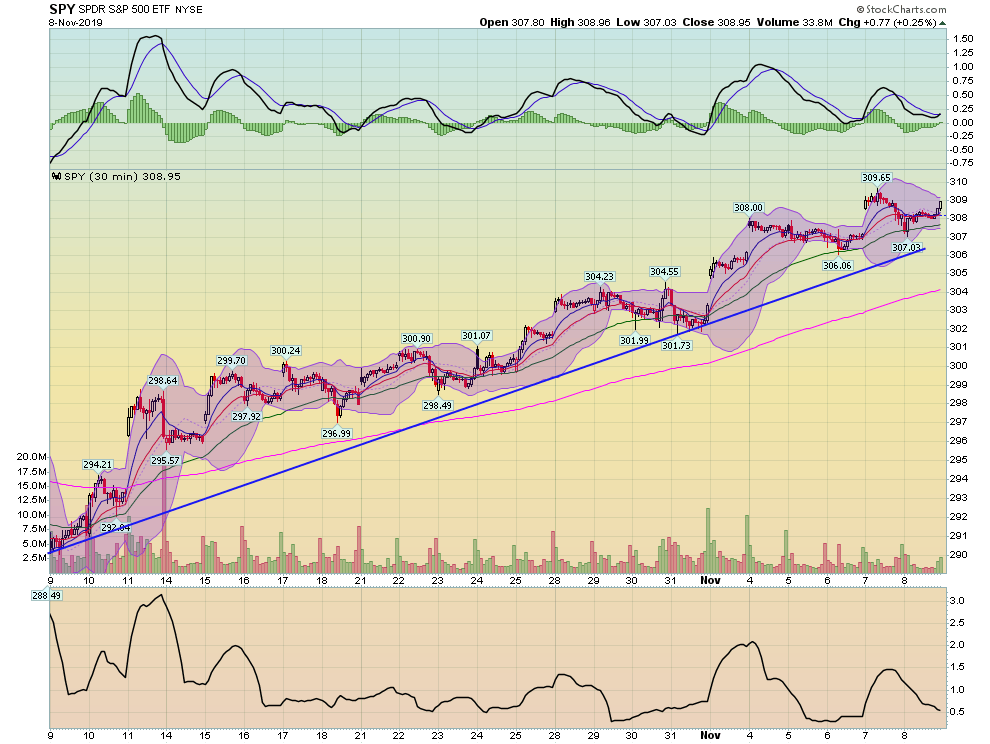
The SPDR S&P 500 (NYSE:SPY) is in the middle of a strong, 30-day rally, as is ...
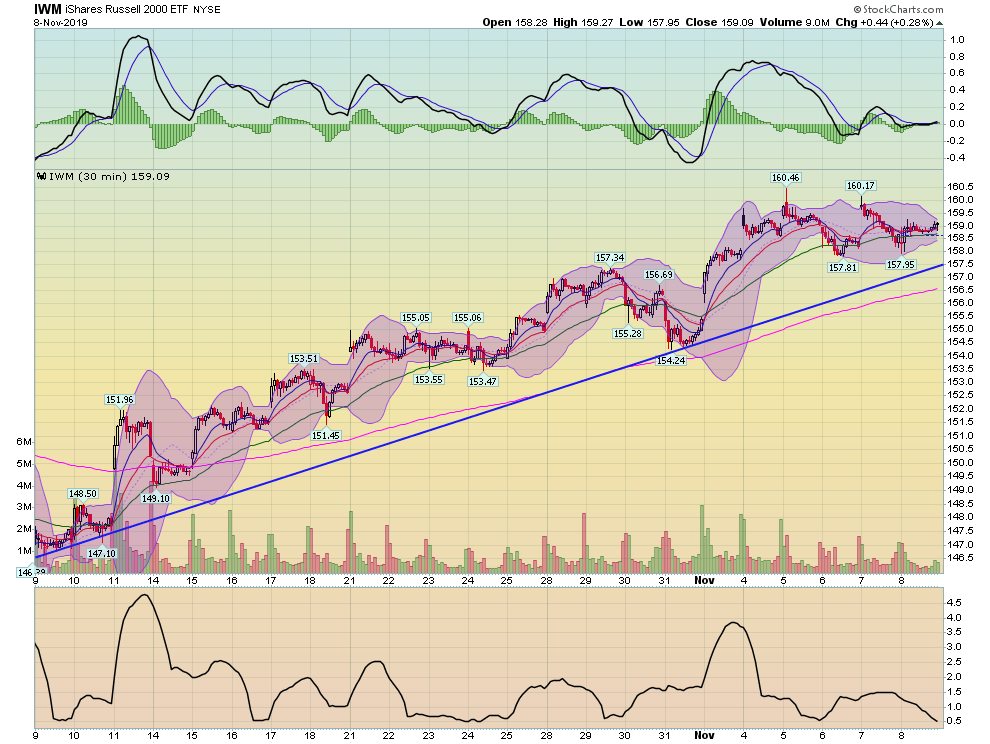
... the IWM. The best part about both these rallies is that prices are engaged in a give and take between advances and selloffs.
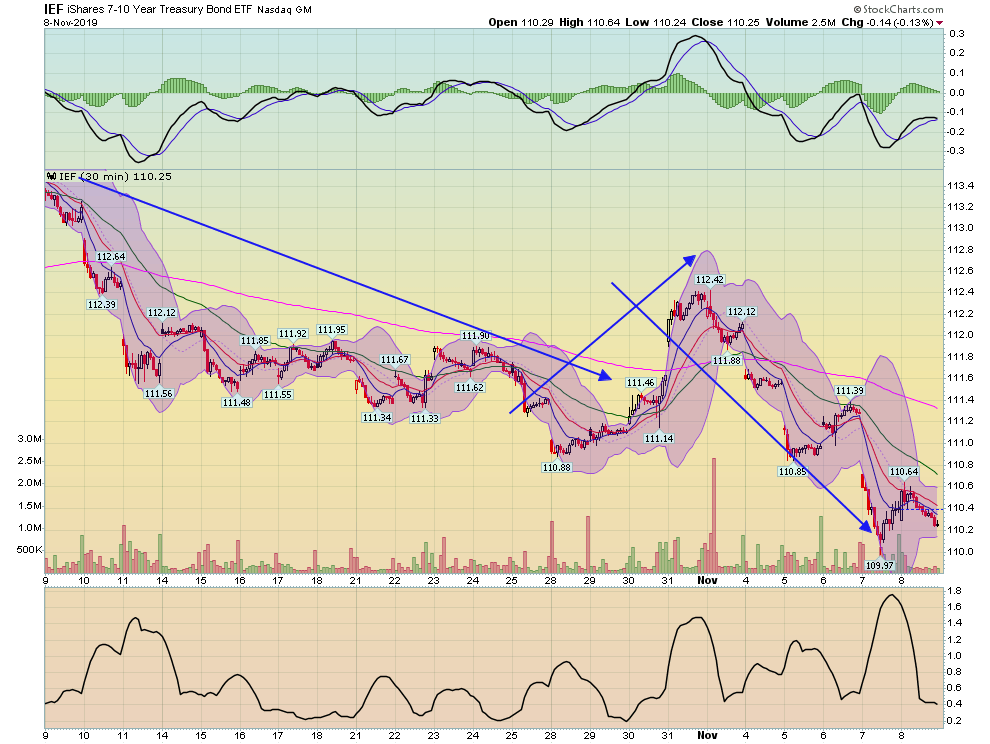
Meanwhile, the IEF has sold off over the last 30 days. Prices moved lower for the first 2/3 of the month. They staged a modest rally at the end of October but have since continued to move lower.
Finally, several industries have very bullish charts, which supports the move higher and probably bodes well for the next week:
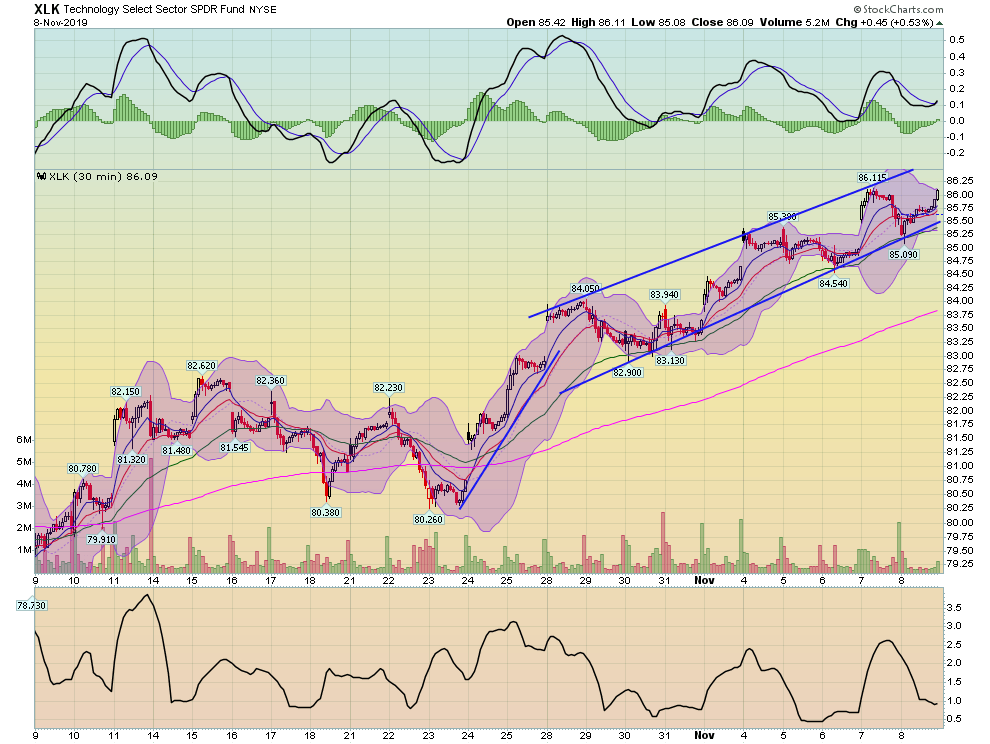
The tech sector started to rise at the end of October and is now in an upward sloping channel. Prices are near a 30-day high.
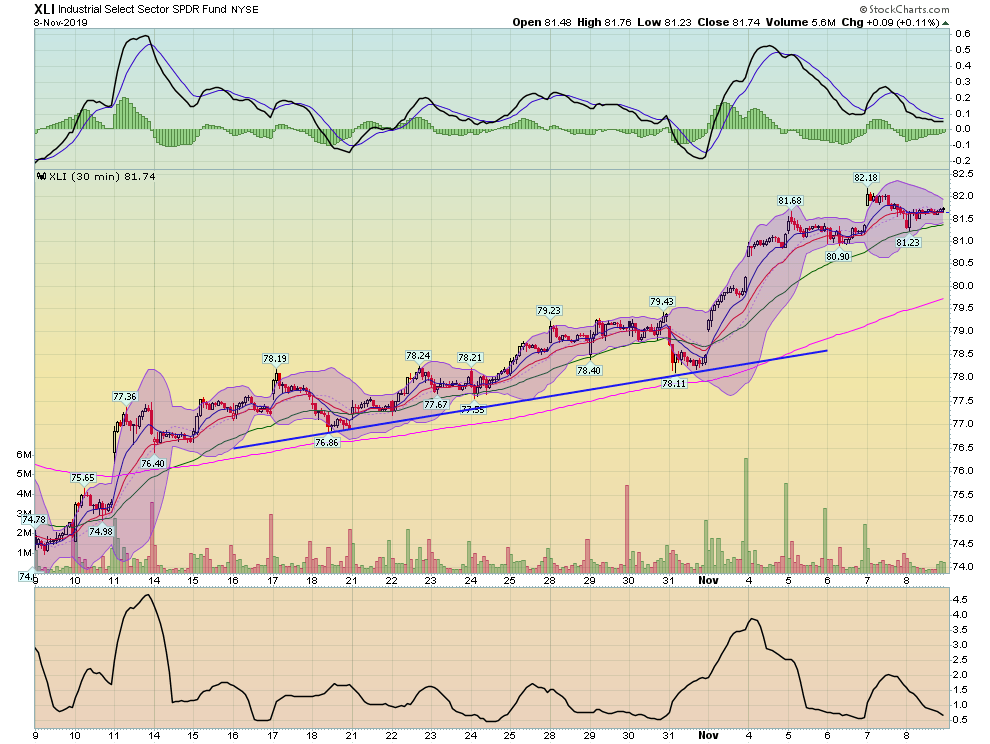
Industrials have been rallying a bit longer, as have ...
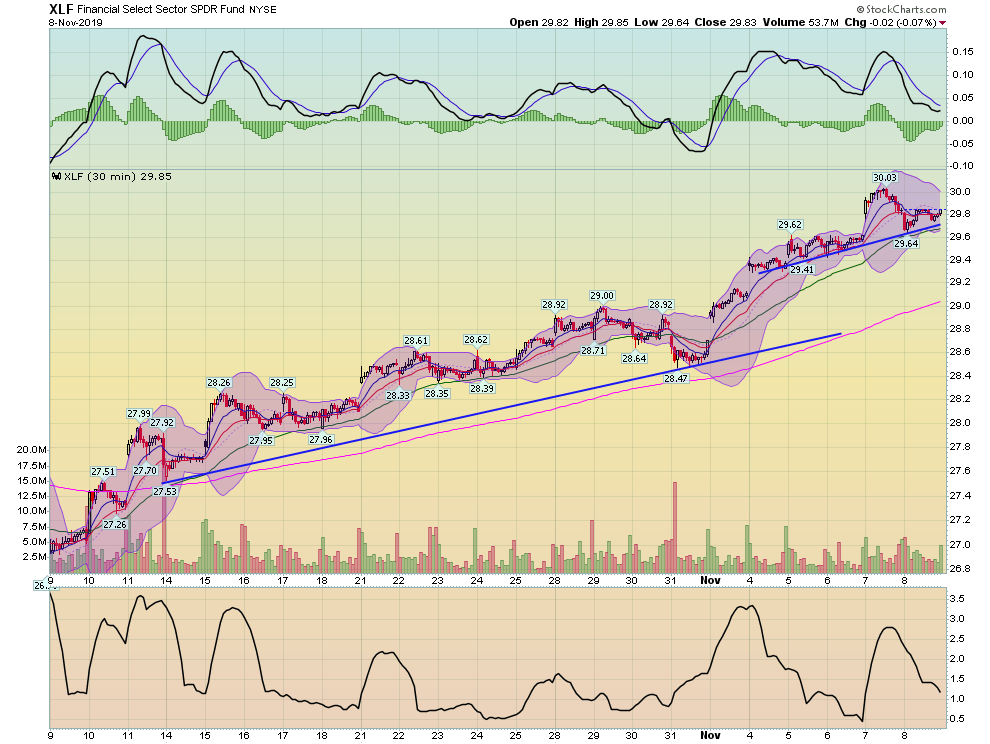
... financials.
And defensive sectors are noticeably lower:
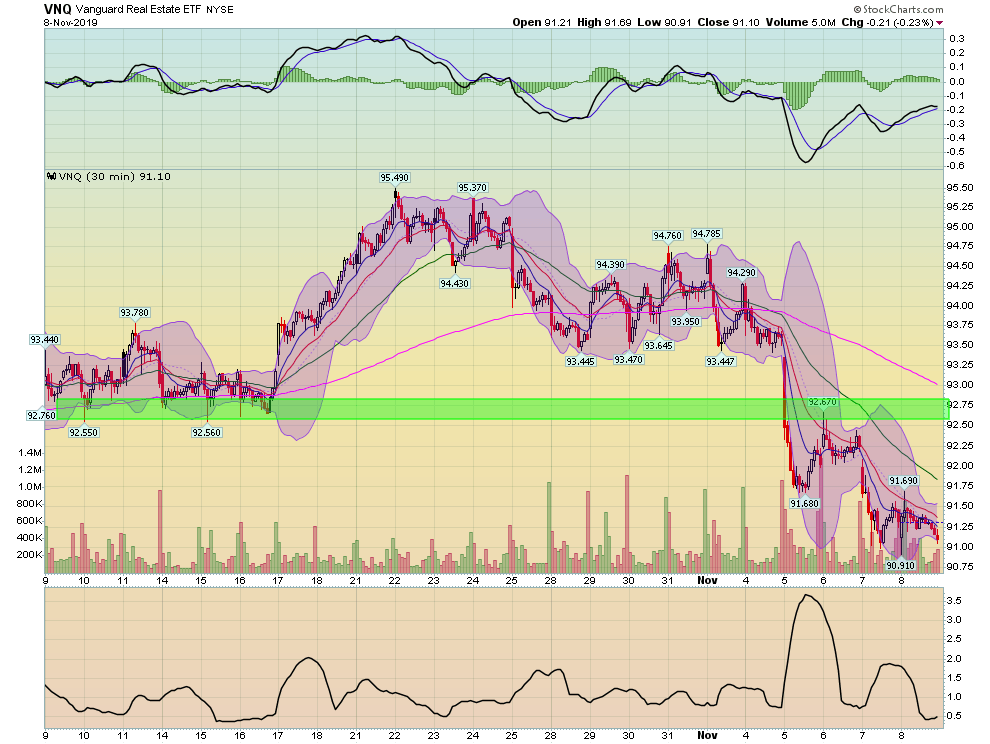
The Vanguard REIT (NYSE:VNQ) dropped below support in the lower 90s and is now trading near a 30-day low.
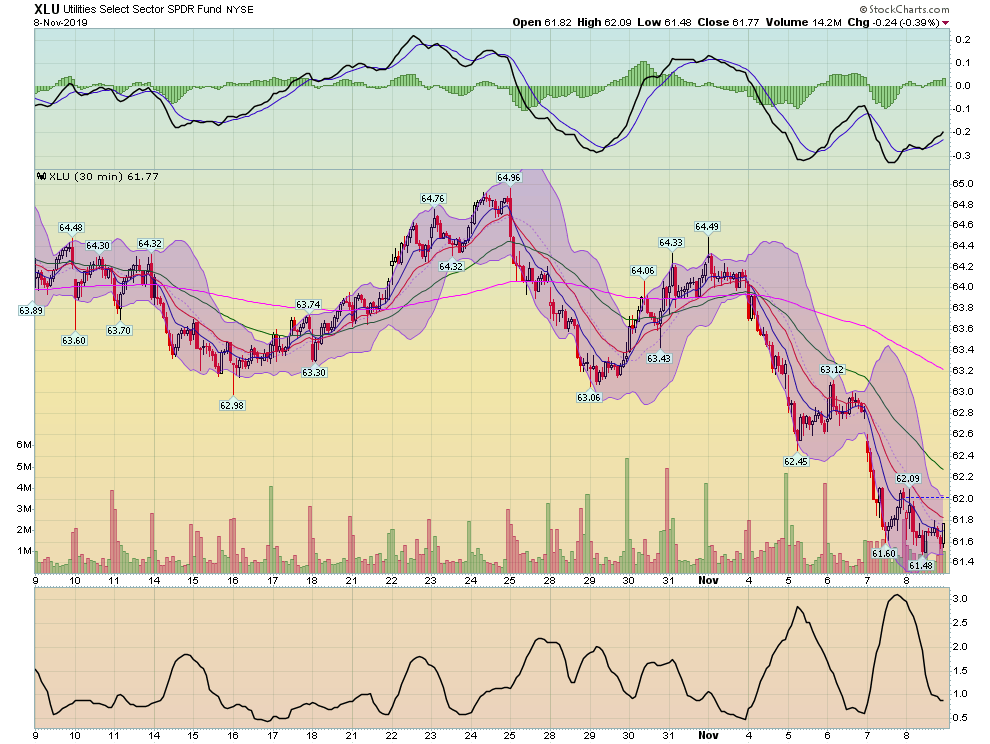
Utilities have been trending lower since mid-October and are also near 30-day lows.
Overall, the pieces are lining up for the bulls. Indexes have broken through resistance, Treasuries are selling off, and bullish industries are moving higher. For the second week in a row, we're ending on a high note.
Have a good weekend.
