Investing.com’s stocks of the week
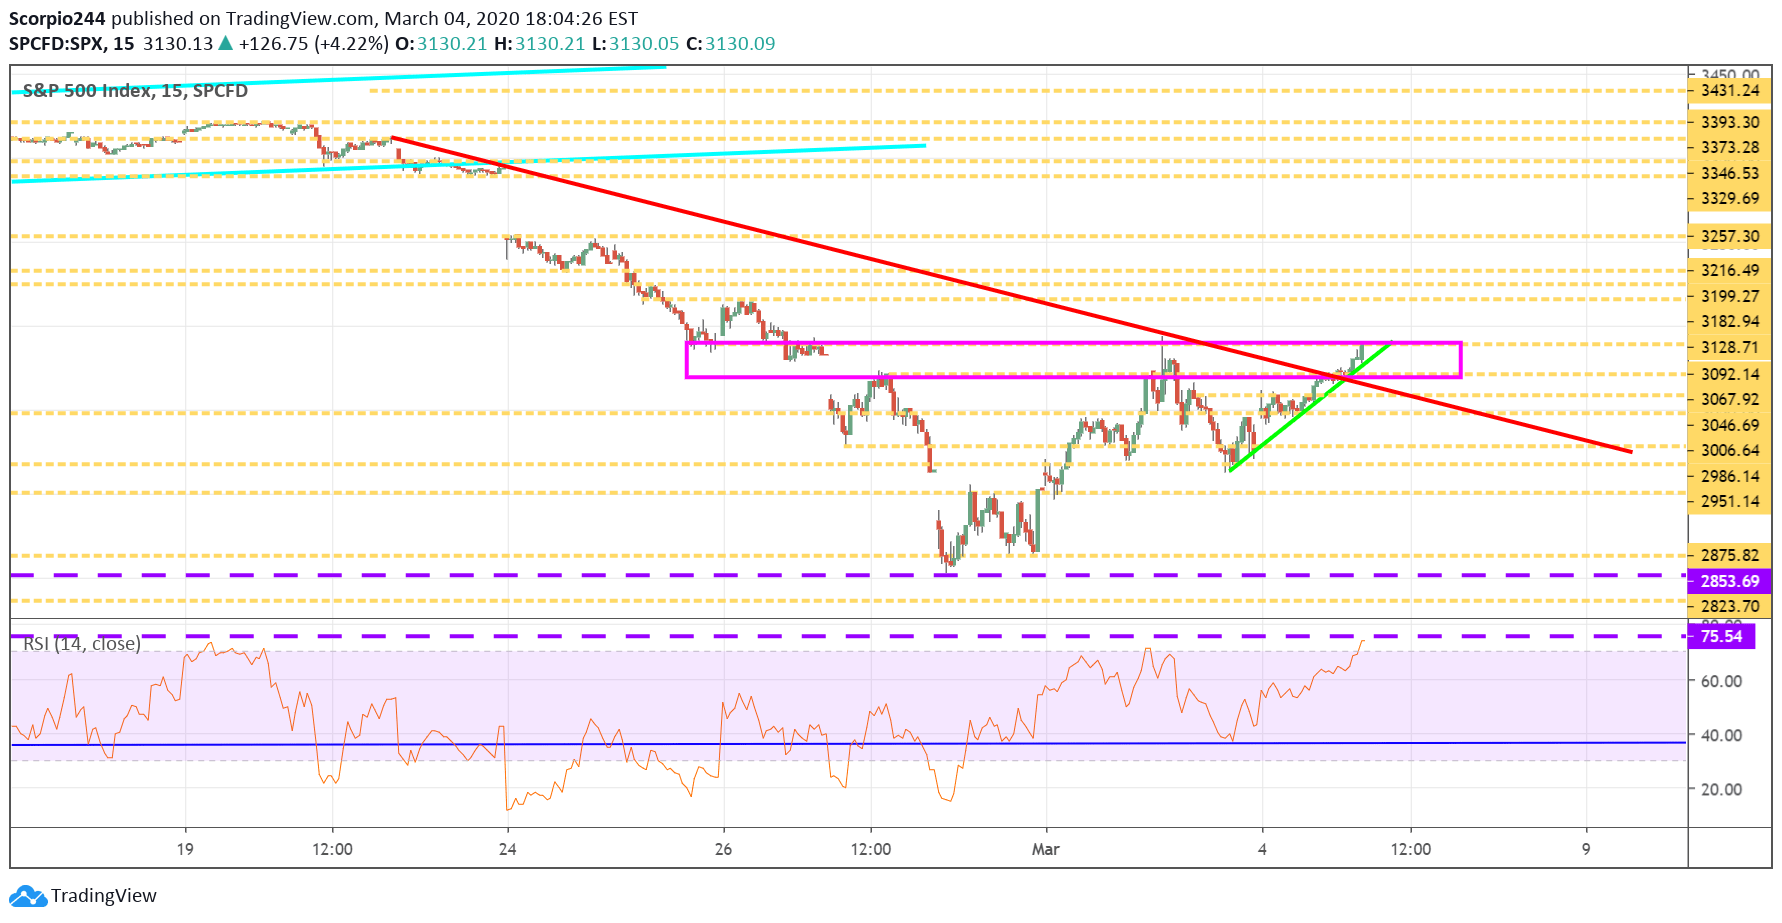
Stocks rose by over 4.2% to finish the day at 3,130. The rally was impressive, with the market shaking off pretty much every coronavirus headline yesterday as if they never even crossed the tape. So, either the virus risks have been priced into the market, or the virus was nearly the narrative used to explain the sell-off.
Overall, the market seemed very strong yesterday, with a new uptrend forming, creating a series of rising triangles throughout the day, taking out resistance level after resistance level. I noted the first level during the midday update, and the rest was history.
S&P 500 (SPY)
Anyway, is the coast clear? It feels like we are getting closer. You can see on the chart; the S&P 500 cleared a downtrend that formed from the start of the sell-off, and how we have now broken it. If somehow we manage to rally beyond 3,185, it would suggest there is a good chance a fill up to 3,330.
I know you think I’m crazy, but did you see all the coronavirus headlines the market blew through yesterday, from LA to NY. It was if they didn’t exist. Clearly, the “panic” the market was in last week, is not the case, most certainly not yesterday.
VIX
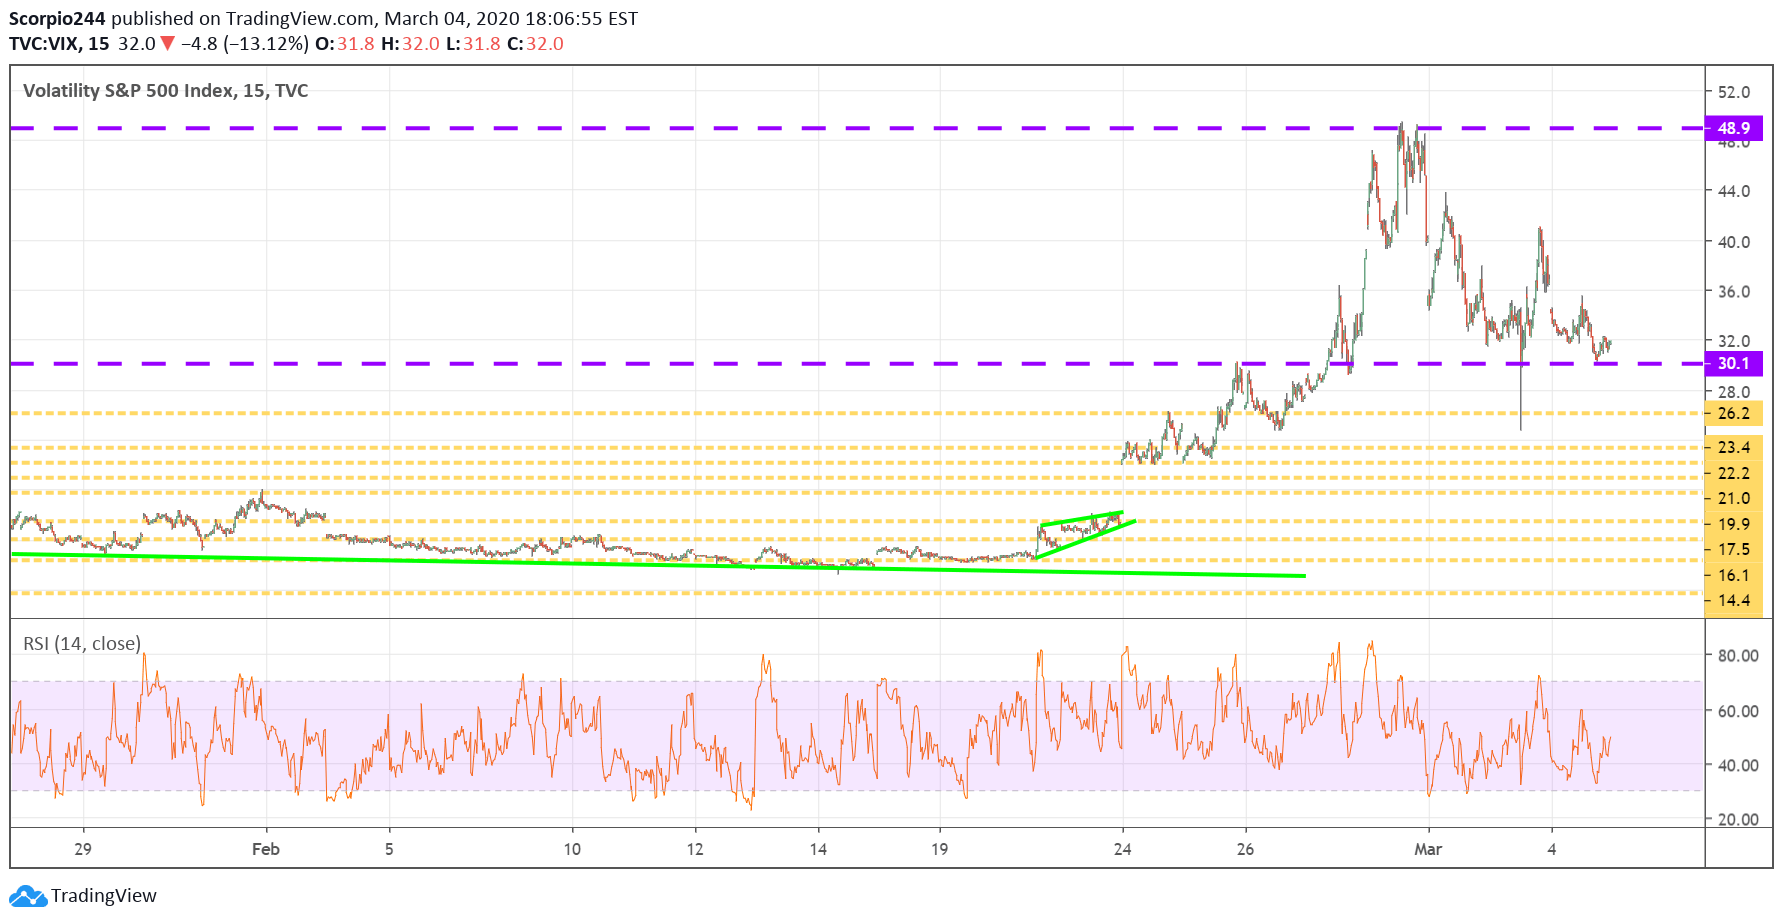
TheVIX is sitting right on support at 30, and a break of support at 30, sends the VIX down to 26, and well, would suggest fear levels are retreating.
Skyworks (SWKS)
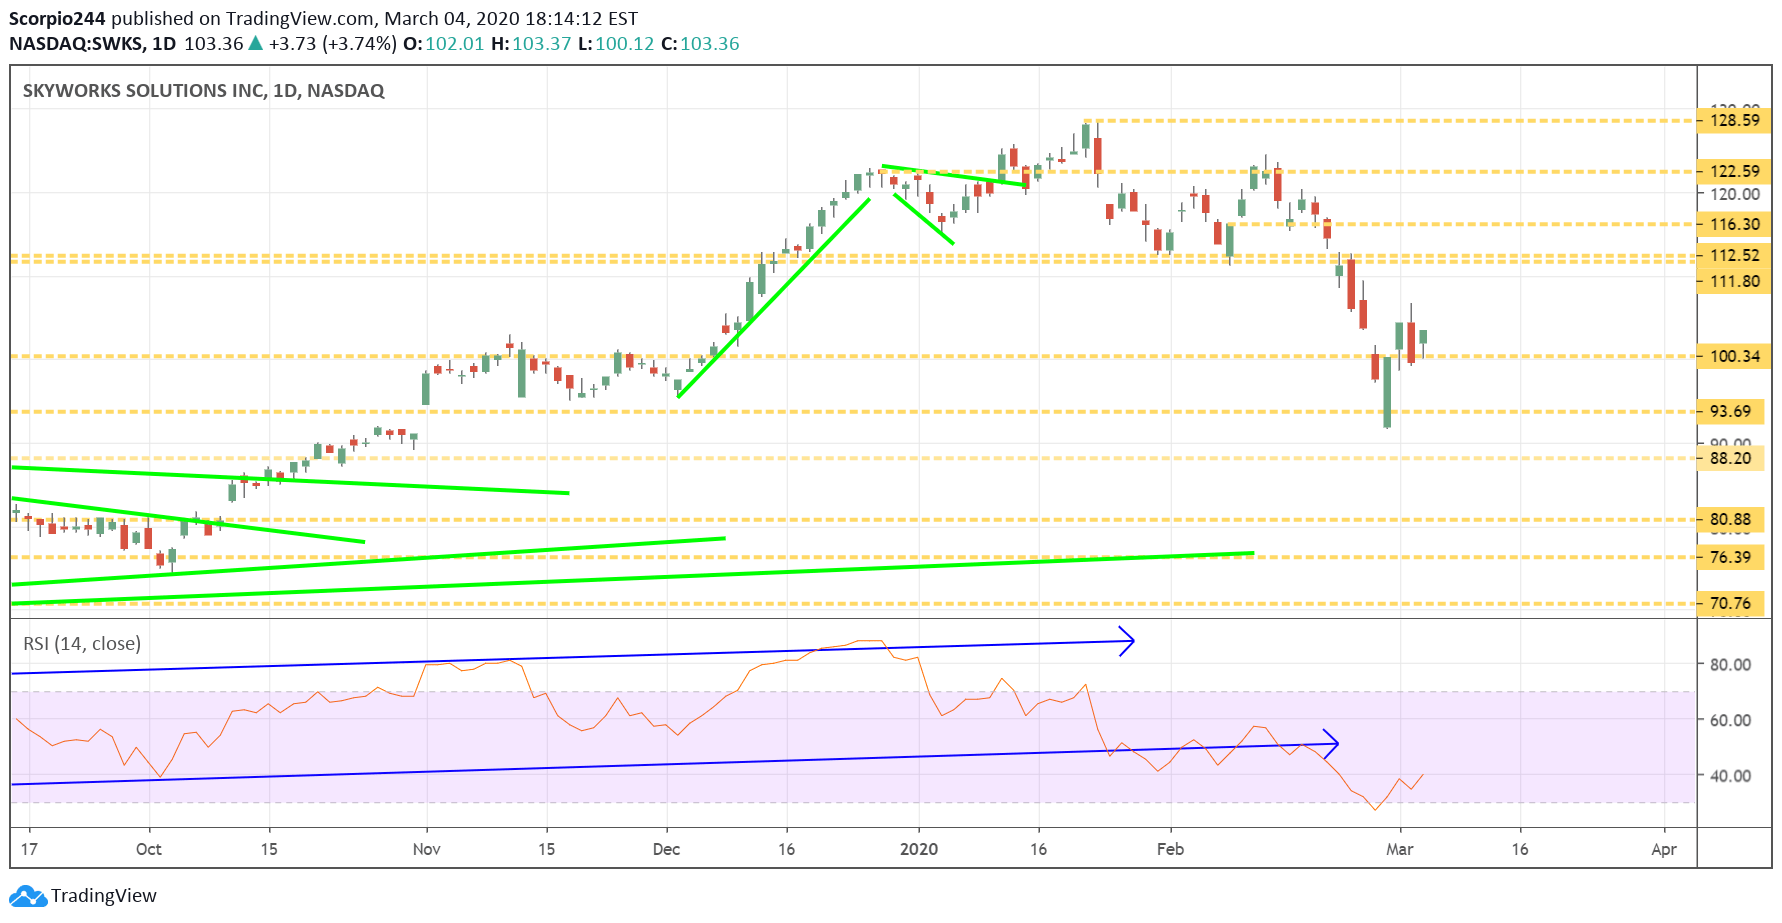
Skyworks (NASDAQ:SWKS) preannounced today, and as I noted on the morning call, it was in pretty much in line with Qorvo, with a roughly 5% reduction in revenue guidance. The company pointed out in the press release; the miss which was due to the demand environment, which due to the interruption in the supply chain, basically because of Apple (NASDAQ:AAPL). How a roughly $40 million shortfall in revenue for one quarter turns into a $3 billion drop in market cap is beyond me. Anyway, the stock appears to have support around $100, and I think it starts working back to around $112.
Apple (AAPL)
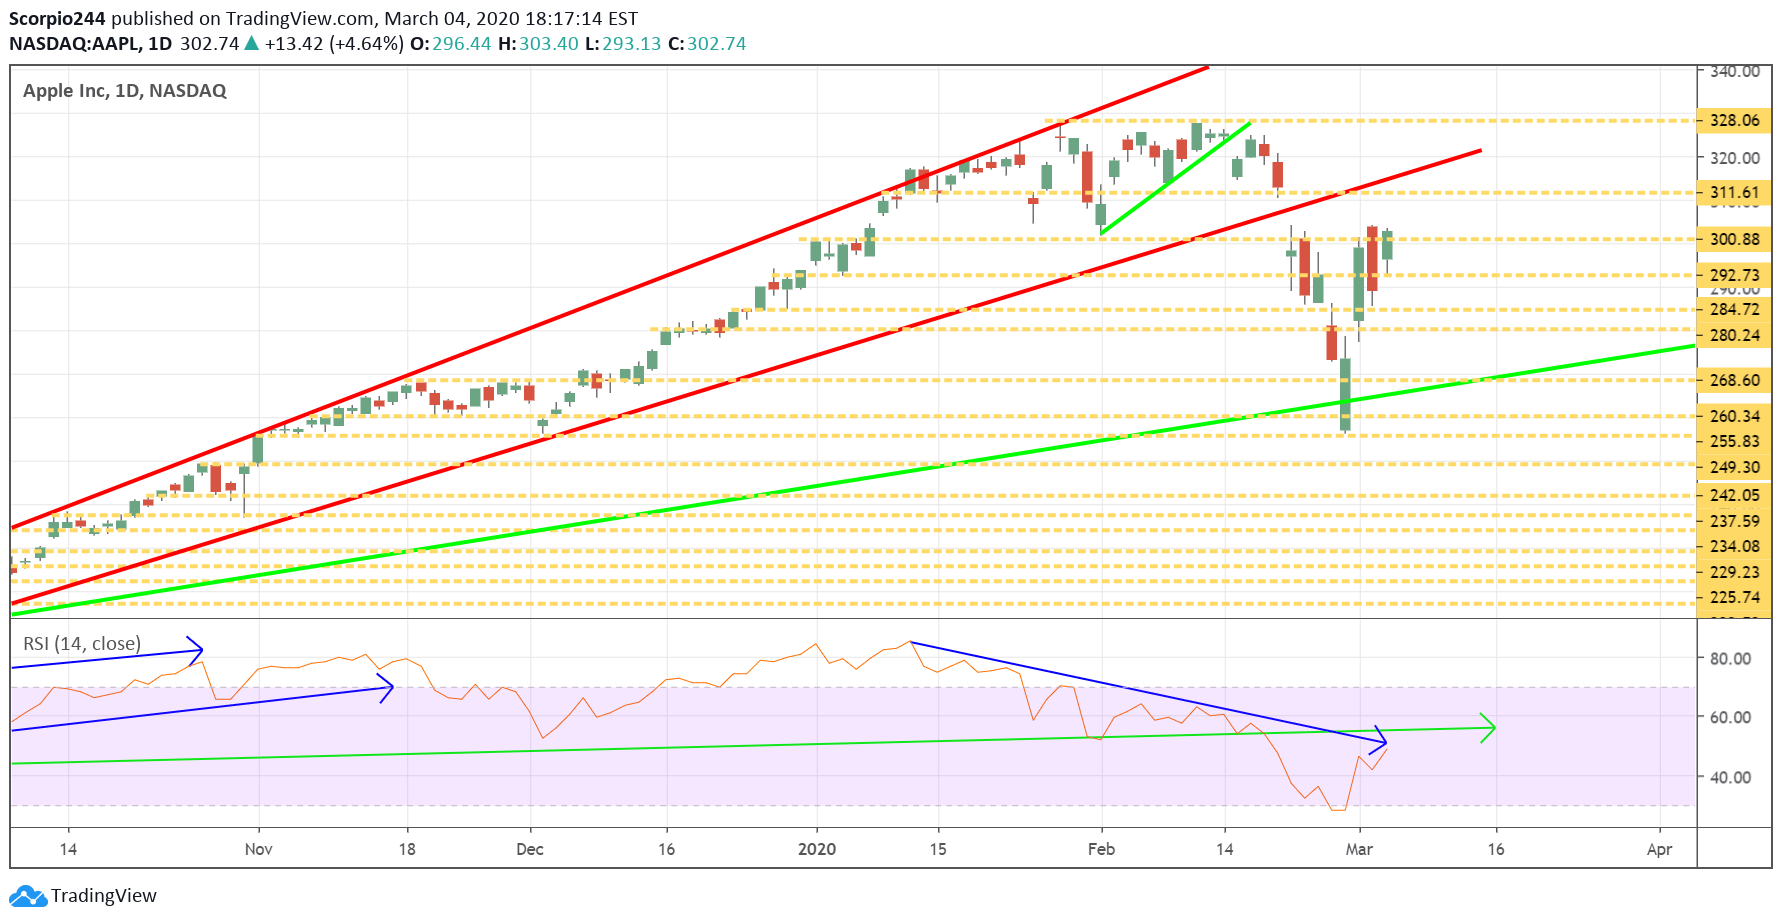
I’m not the only one crazy enough to think the market is heading higher. Someone was making a reasonably sizeable bet that Apple’s stock goes back to its all-time highs.
Visa V)
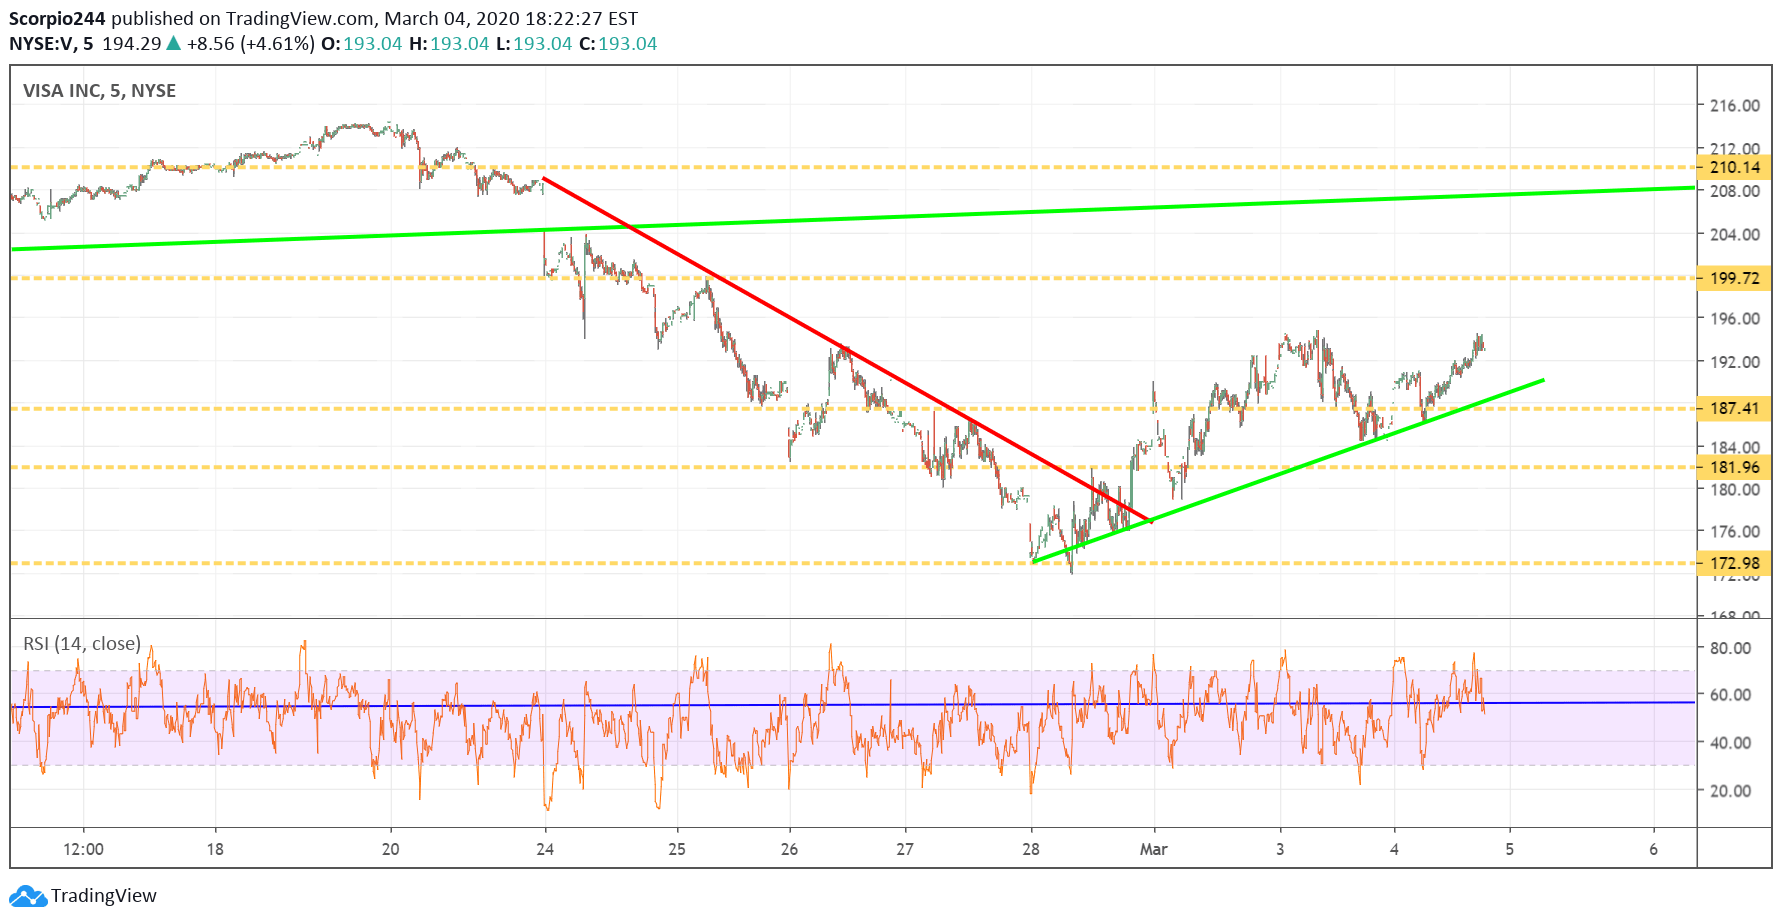
Visa (NYSE:V) appears to be recovering, and someone is betting that shares rise back to $211 by June. The stock has its next level of resistance at around $200.
Acadia (ACAD)
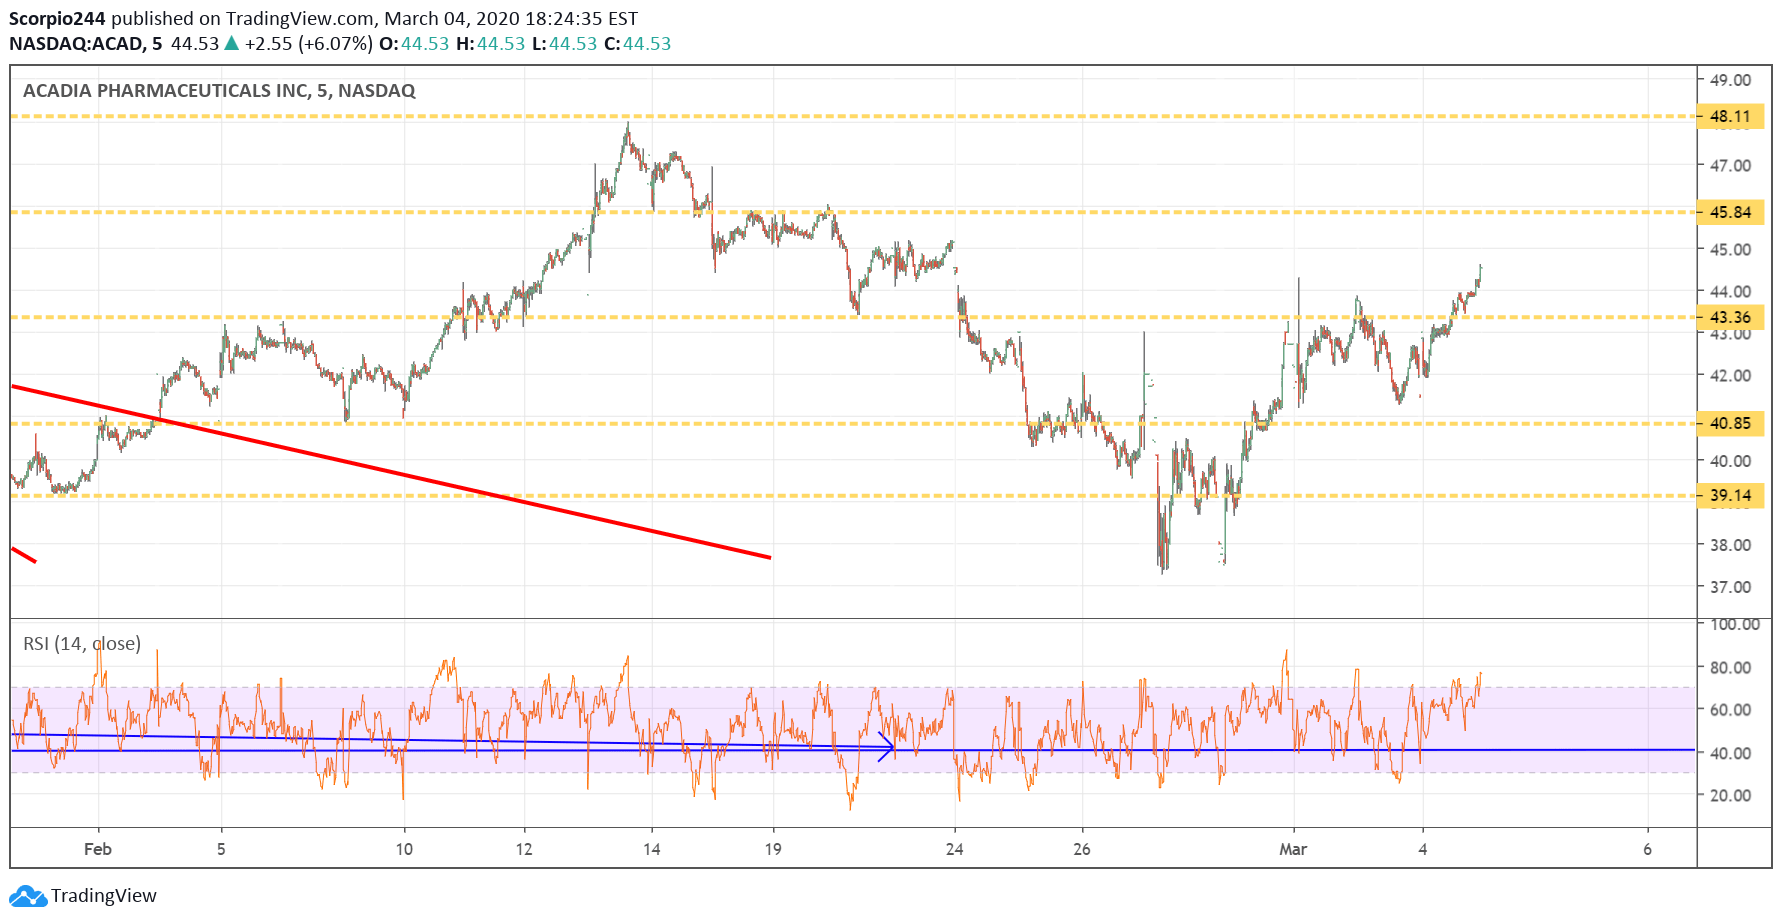
ACADIA (NASDAQ:ACAD) finally made it through resistance around $43.30, and well, the next stop appears it may be around $46.
Splunk (SPLK)
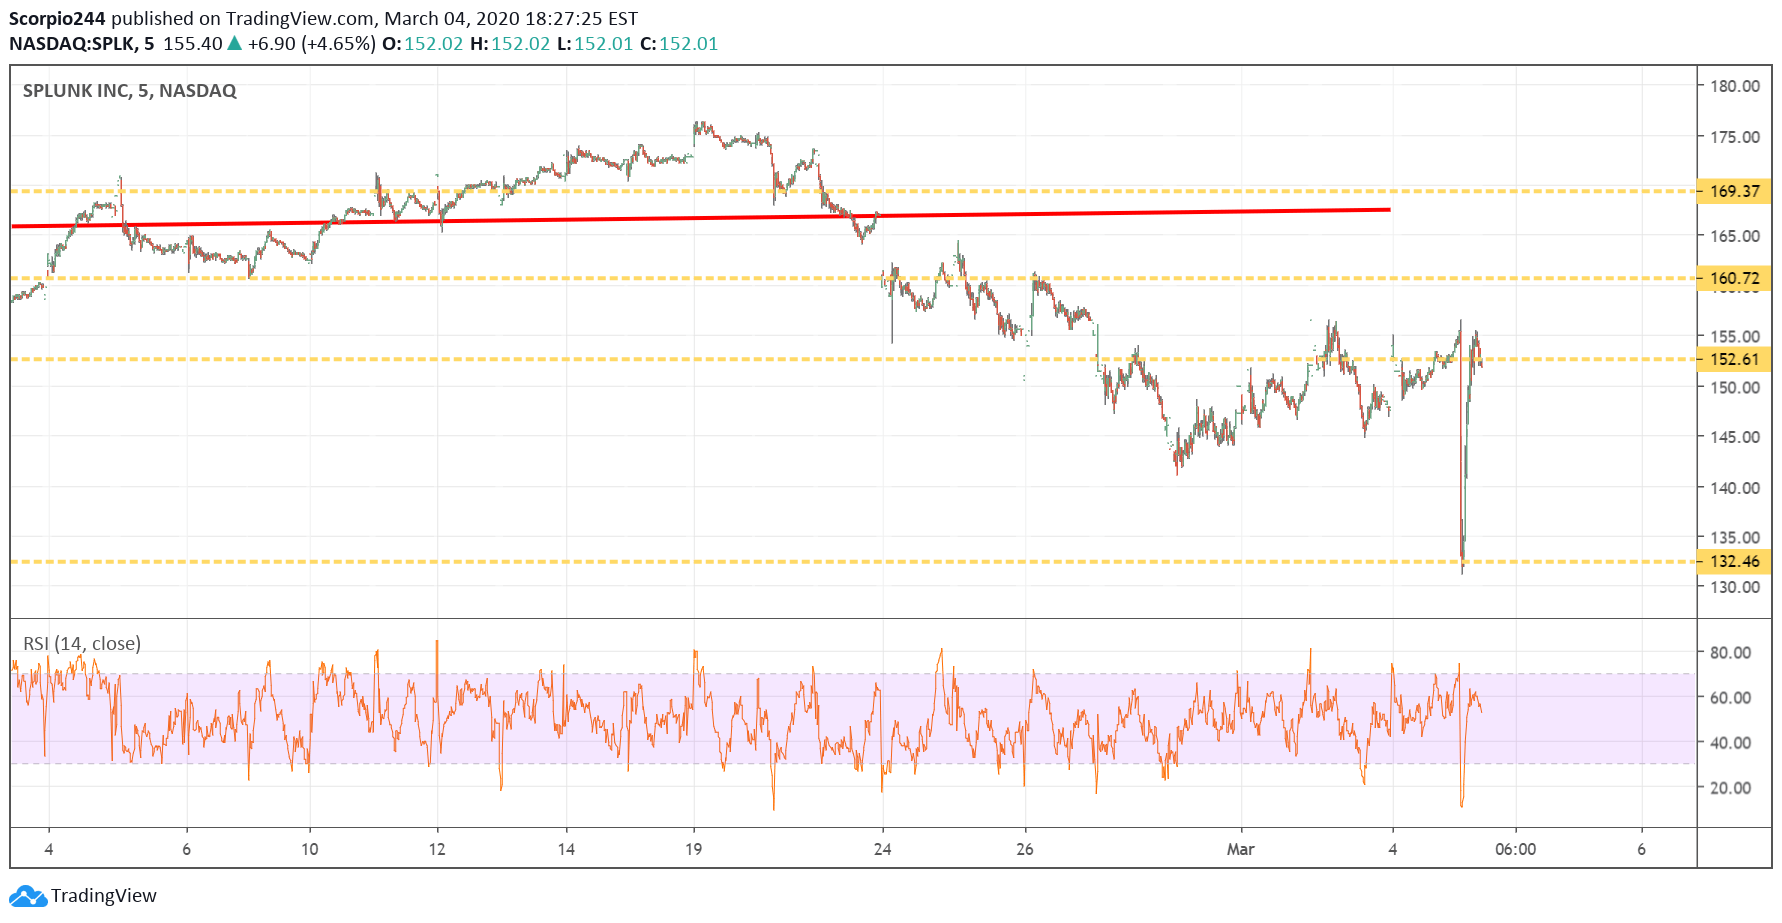
Splunk Inc (NASDAQ:SPLK) reported results after the close, and the stock initially plunged because the company’s revenue guidance for the first quarter and full-year came in well below estimates. But then came the conference call, and the company explain it was due to the transition to the cloud, and the accounting of the revenue. Then they gave their longer-term guidance, and well, the stock did a significant u-turn. I never heard so many happy people on a call, even the analysts sounded thrilled, and I think $161 is likely the next stop.