Technically Speaking For May 27-31Summary
- Asian news remains weaker.
- U.S. economic news is positive.
- The bond market thinks the economy will slow down.
Central Bank Actions
The Bank of Canada maintained rates at 1.75%. Here is how they described the current state of the Canadian economy (emphasis added):
Recent Canadian economic data are in line with the projections in the Bank’s April Monetary Policy Report(MPR), with accumulating evidence that the slowdown in late 2018 and early 2019 is being followed by a pickup starting in the second quarter. The oil sector is beginning to recover as production increases and prices remain above recent lows. Meanwhile, housing market indicators point to a more stable national market, albeit with continued weakness in some regions.
Continued strong job growth suggests that businesses see the weakness in the past two quarters as temporary. Recent data support a pickup in both consumer spending and exports in the second quarter, and it appears that overall growth in business investment has firmed. That said, inventories rose sharply in the first quarter, which may dampen production growth in coming months.
The Canadian economy is in modestly good shape. The annual growth of GDP has fluctuated between 1.6%-1.9% during the last three quarters, while the unemployment rate has printed between 5.6%-5.8% since the first of the year. Retail sales have increased from a 1% Y/Y growth rate to 2.6% over the last three months. Not all is rosy, however. The manufacturing PMI has been trending lower since 2Q18 and was below 50 (which indicates a modest contraction) in the latest report. Industrial production decreased 0.68% M/M in the latest report. My guess is that uncertainty created by heightened trade tensions are the primary cause.
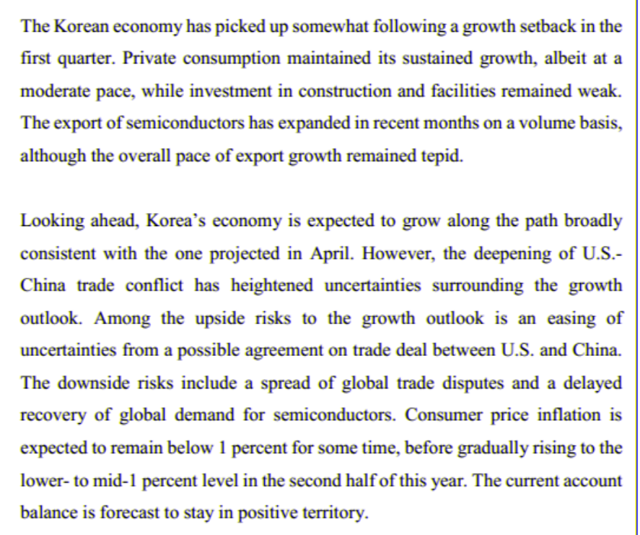
The Bank of South Korean maintained rates at 1.75%. Here is how they described the current economic environment:
The South Korean economy is in fair shape. The GDP annual growth rate has been modestly weaker in two of the last three quarters, but the number was still positive. Unemployment has ticked higher but it's still only 4.1%. Retail sales are still growing fairly well. The main problem is industrial production, which has contracted the last four months. But the manufacturing PMI just went above 50, so we might see industrial growth in the near future. The main issue is the Chinese slowdown, whose effect has spread out through SE Asia, South Korea included.
U.S. Data of Note
On Thursday, the BEA released the second estimate of U.S. 1Q GDP.
Real gross domestic product (GDP) increased at an annual rate of 3.1 percent in the first quarter of 2019 (table 1), according to the "second" estimate released by the Bureau of Economic Analysis. In the fourth quarter, real GDP increased 2.2 percent.
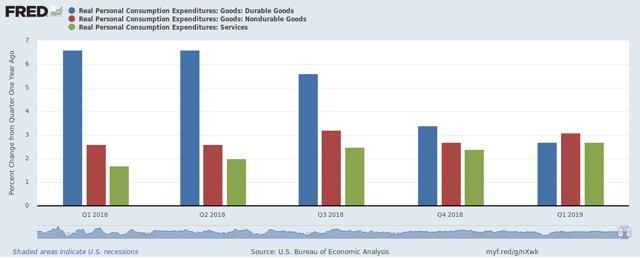
Let's look at the report's details, starting with personal consumption expenditures:
The Y/Y percentage change in the three main PCE categories (durable goods in blue, non-durable goods in red, and services in green) are all between 2%-3%.
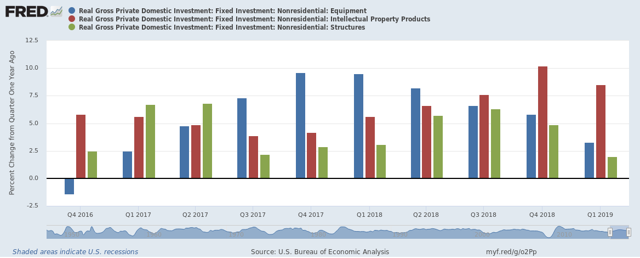
The business investment picture is mixed. Investment in equipment (in blue) has been declining since 1Q18. This is likely due to heightened trade tensions which have clouded future prospects, thereby lowering the attractiveness of increased fixed expenditures. Non-residential investment (in green) is also down. But intellectual property investments (in red) are solidly higher.
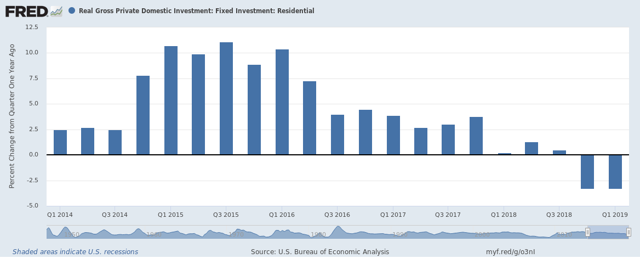
Residential investment has been declining since late 2015 and is now contracting on a Y/Y basis.
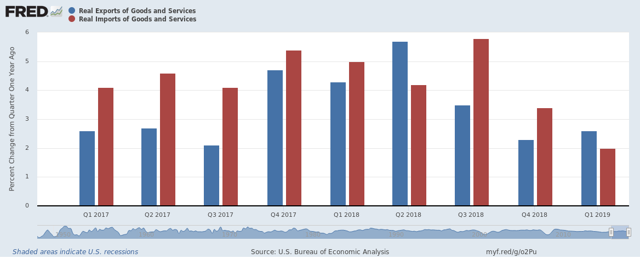
Notice the pick-up in imports and exports during late 2017 and early 2018, which were likely caused by trade sanctions pulling sales forward. The overall pace is now back to the 2%-3% level.
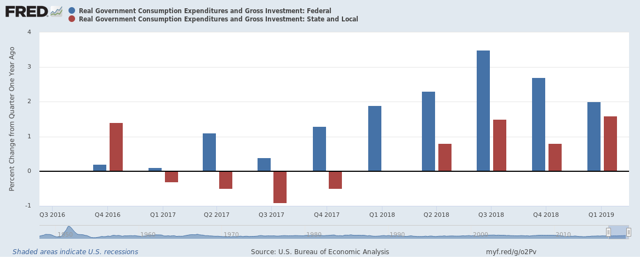
Finally, we see the federal government expenditures (in blue) increased throughout 2018 but are now decreasing. State and local spending (in red) picked up as well. The government shutdown probably caused an increase in state spending in 1Q19.
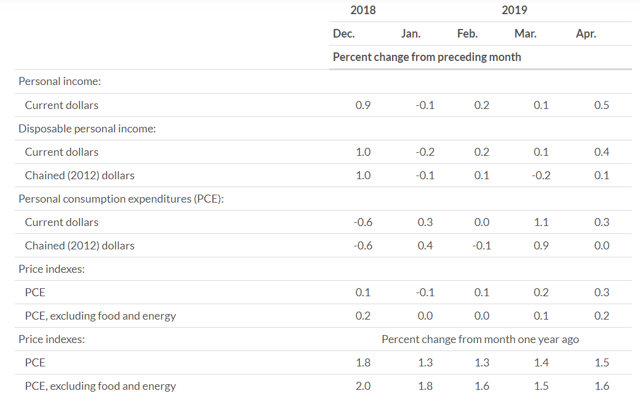
On Friday, the BEA released the latest personal income data. Here's the table from the release:
With the exception of December, the chained (inflation-adjusted) disposable income growth numbers have been very weak. The only "good" news is that in three months, PCE growth was lower.
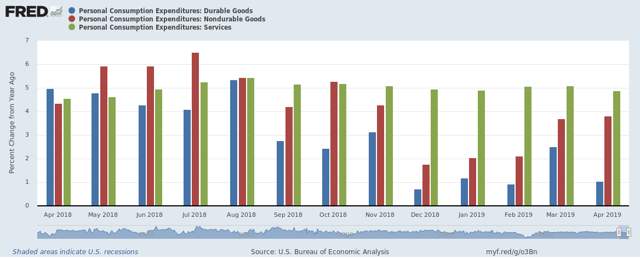
Here's a chart of the last 12-months of PCE growth:
Spending on services (in green) has been very consistent, printing around the 5% Y/Y growth rate. Durable goods spending (in blue), in contrast, has noticeably weakened. Non-durable spending was weaker at the start of the year but has picked up a bit since.
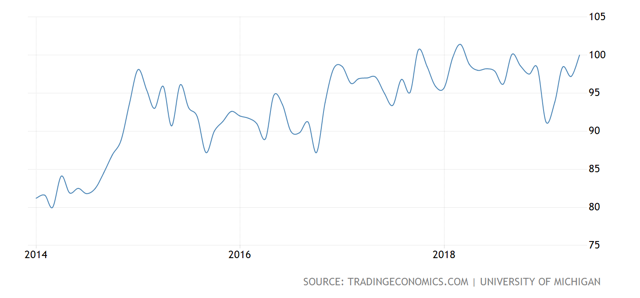
Finally, on Friday the University of Michigan released the latest consumer confidence number, which has returned to near-highs from the last five years:
US Conclusion: the data is very solid. GDP growth in the first quarter was still very strong and consumers continue to spend. Now that things have settled down in Washington, consumer sentiment has returned to high levels.
U.S. Markets
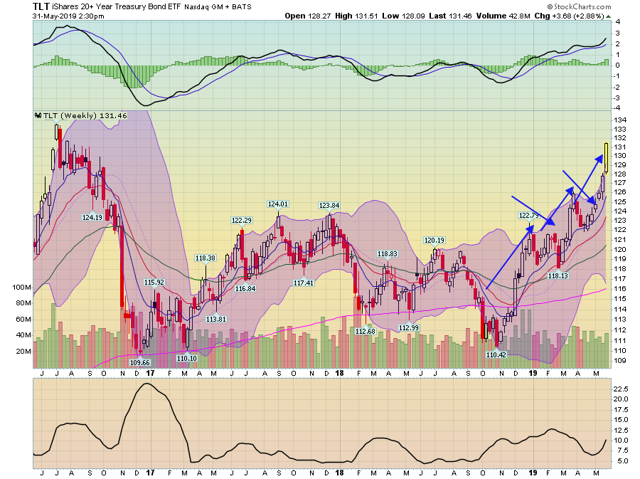
Today, I'll be focusing on the weekly bond market ETF charts for one simple reason: they are in the middle of an incredibly strong rally. Combine that with the increased trade tensions and weaker international environment and you arrive at the following conclusion: the bond markets are yelling that a slowdown is coming.
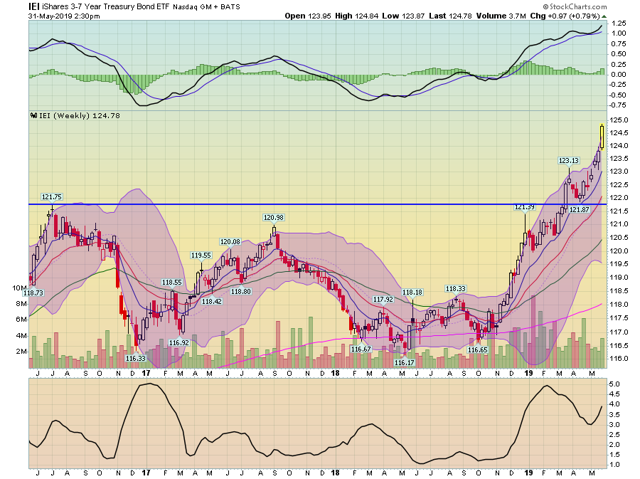
Let's start at the short end, with the IEI:
The IEI started rallying in the 4Q18 and has continued to move higher for the last six months. Prices have moved through key resistance and continue to move higher. The moving averages are bullishly aligned (the shorter are above the longer) and momentum is rising.
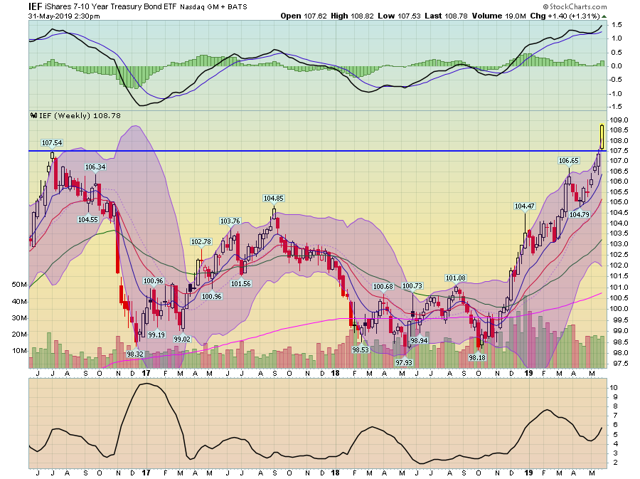
This week, the IEF moved through key resistance by printing a very strong bar. Like the IEI, the IEF is in the middle of a strong, 6-month rally with rising momentum
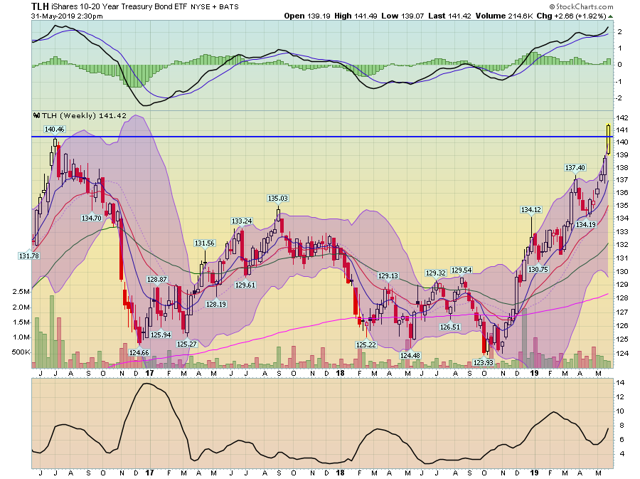
This week, the TLH also moved through key resistance by printing an incredibly strong bar (especially for the bond market). Momentum is rising.
The TLT is the only Treasury market ETF that hasn't broken through previously established resistance levels. Aside from that, it's also in the middle of an incredibly strong rally.
So, what does this mean? Traders are looking for safety which means they see trouble on the horizon. Another way to look at this is that traders think the Fed is more likely to cut than raise rates, which is another way to say they see slower growth ahead. Either way, the rallying bond market is a very concerning sign.
International Economic Releases of Note
China/Japan/Asia/Australia
China
- Industrial profits decrease 3.4%.
Japan
- Leading economic indicator 95.9
- Coincident economic indicator 99.4
- Unemployment is 2.5%
- Core CPI at .6% Y/Y
- Retail sales increase .5% Y/Y
South Korea
- South Korean business sentiment up 1 point
- South Korean all industry production increased .7% M/M
- South Korean retail sales increased by 1.4% Y/Y
Australia
- Housing permits down 1.9% M/M
Asia conclusion: the overall slowdown that was emanating from China continues to slow peripheral economies. We're not seeing contractions, but there is a noticeable drop in industrial and business activity.
EU/UK/Canada
- EU sentiment increases 1.4
- Credit to EU residents increases by 2.4%
Emerging Markets
- Mexican unemployment at 3.4%
- Argentina's retail sales increased by 26% Y/Y
- Brazil GDP increased .5% Q.Q
Disclosure: I/we have no positions in any stocks mentioned, and no plans to initiate any positions within the next 72 hours. I wrote this article myself, and it expresses my own opinions. I am not receiving compensation for it (other than from Seeking Alpha). I have no business relationship with any company whose stock is mentioned in this article.

