I sent this update to paid subscribers on Friday. It’s critical, so I’m sharing it here with ALL Economy & Market readers today…
On December 19, I sent an Economy & Markets email about the similarity between the internet bubble and crash and the bitcoin bubble today.
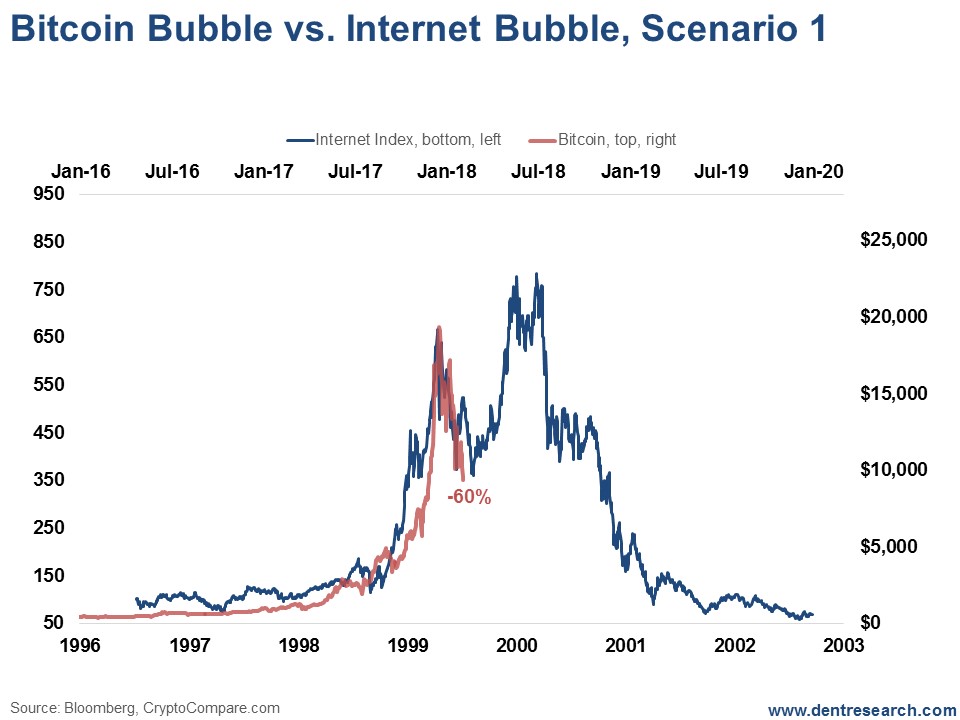
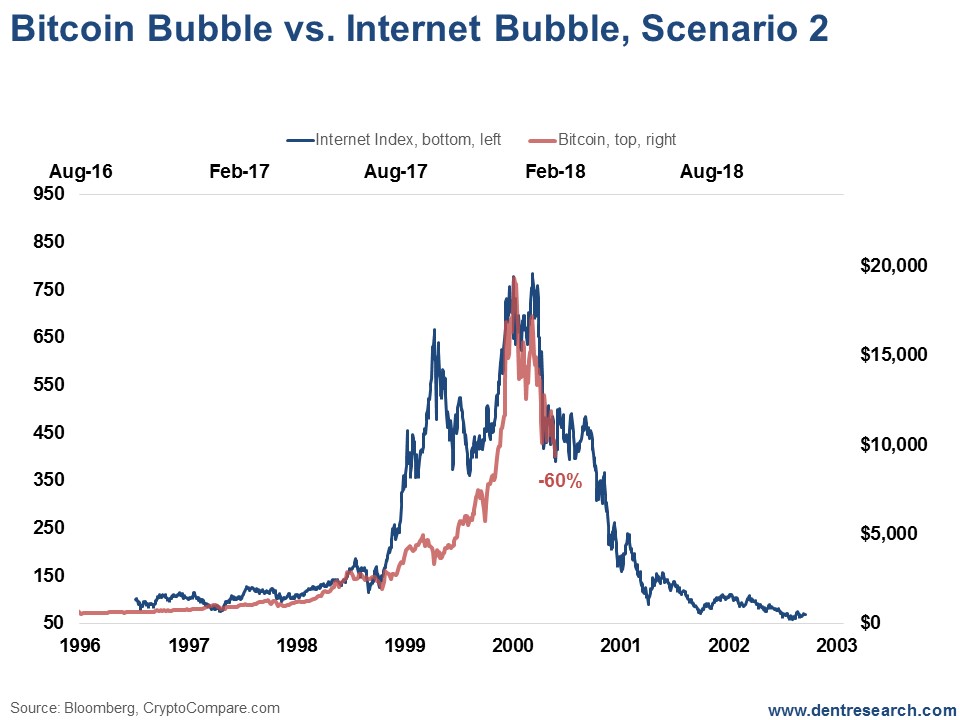
At the time, I saw two possible scenarios. Both are still viable today, but the degree of the 60% crash in Bitcoin tells me that we’re most likely experiencing scenario two, where the cryptocurrency hit its top near $20,000.
That doesn’t take scenario one out of the running. There’s still a remote chance that Bitcoin could surge back and break above $20,000, after which it would be curtains.
Neither scenario is good news for stocks (and next week I’ll reveal the new leading indicator I’ve found that shows an eight-week lag or so between Bitcoin and stock market moves… look out for that in Economy & Markets tomorrow).
For now though, here are some updated charts…

The internet bubble saw a 46% crash in 1999 before rocketing to a new high in early 2000. The Bitcoin bubble has already seen a 60% crash, which makes a new high or scenario one less likely. But it is still possible if we can hold the recent 8,800 lows at 60% down from the top.
That said, this recent crash makes scenario two look more likely, especially if it goes down further.

That scenario would see a crash down to as low as $800 to $1,000 on Bitcoin, which would be down more than 95% from the top.
That would be a signal of bubble worry for the stock market, as I will show tomorrow in Economy & Markets.
The coming weeks are critical.
Any new lows in Bitcoin would strengthen the likelihood of scenario two unfolding – that Bitcoin and cryptocurrencies peaked around $20,000 and the stock market will follow on about an eight- to nine-week lag.
Look out for tomorrow’s email on that new leading indicator.
