Summary
International Economic Data
UK/EU
EU/UK conclusion: there was insufficient data this week to change the generally negative tone of the region's economic trajectory. Manufacturing is weak due to the ramifications of the US-China trade war and the Brexit-induced slowdown.
Australia/Japan
Australia
Japan
Australia/Japan conclusion: please see notes below on the Japanese economy. Australia's growth is grinding lower due to trade issues and heavy consumer indebtedness.
BRICs
Russia
India
China
BRICs conclusion: activity is still positive, but there are some cracks. Activity is lower, leading to weaker growth. Most of this is trade-related.
Central Bank Actions
The Bank of Japan kept rates at -0.1% and decided to continue "yield curve control," the policy where the bank buys 10-year Japanese bonds in enough quantity to keep rates near 0%. Here is how they described the current Japanese economy (emphasis added):
Japan's economy has been on a moderate expanding trend, with a virtuous cycle from income to spending operating, although exports, production, and business sentiment have been affected by the slowdown in overseas economies. Overseas economies have been growing moderately on the whole, although slowdowns have continued to be observed. In this situation, exports have shown some weakness. On the other hand, with corporate profits staying at high levels on the whole, business fixed investment has continued on an increasing trend. Private consumption has been increasing moderately, albeit with fluctuations,against the background of steady improvement in the employment and income situation. Housing investment and public investment have been more or less flat. Although exports have shown some weakness, industrial production also has been more or less flat, reflecting the increase in domestic demand, and labor market conditions have remained tight.
I would argue that the picture is a bit less positive than the BOJ describes. Annual GDP growth declined to 0.1% in the 3Q18. It rose to 1% the last two quarters. Although the unemployment rate is 2.2%, retail sales have been moving lower on a Y/Y basis: they grew 2.7% 12-months ago but contracted 2% in the latest report. The manufacturing PMI has been below 50 in five of the last six months which explains why industrial production has contracted in seven of the last 12 months (Y/Y basis).
The Bank of England decided to keep rates at 0.75%. Here is how they described the current UK economy (emphasis added):
Brexit-related developments are making UK economic data more volatile, with GDP falling by 0.2% in 2019 Q2 and now expected to rise by 0.2% in Q3. The Committee judges that underlying growth has slowed, but remains slightly positive, and that a degree of excess supply appears to have opened up within companies. Brexit uncertainties have continued to weigh on business investment, although consumption growth has remained resilient, supported by continued growth in real household income. The weaker global backdrop is weighing on exports. The Government has announced a significant increase in departmental spending for 2020-21, which could raise GDP by around 0.4% over the MPC’s forecast period, all else equal.
The UK's annual growth rate was 1.2% in the latest report, although Q/Q and rolling 3-month numbers are weaker. Manufacturing is hurting: the sector's PMI has been below 50 the last four months and industrial production has contracted (Y/Y) in nine of the last 12 months. However, low unemployment (3.8%) is supporting healthy retail sales increased (2.7% Y/Y).
US Economic Data
Before looking at this week's Fed decision, let's place this decision into economic context. According to the Fed's dual mandate criteria, the economy is in a good place. The labor market is at its strongest level in nearly 40 years and prices are contained, which means the Fed doesn't have to act one way or the other. This is the position taken by Boston Fed President Rosengren and Cleveland Fed President Mester, who dissented from the decision to cut rates. At the same time, the US-China trade war is slowing the global economy. The financial markets have picked up on this: bond traders have inverted the yield curve and the stock market recently sold off. A preventative rate cut would be prudent in this environment -- which is what the Fed did at this meeting. An argument could also be made that a bigger cut is needed because inflation has underperformed during this expansion. I'm assuming this is the position taken by St. Louis Fed President Bullard, who voted for a 50 basis point cut.
The policy announcement addresses all these concerns. Let's start with the description of the current economy:
Job gains have been solid, on average, in recent months, and the unemployment rate has remained low. Although household spending has been rising at a strong pace, business fixed investment and exports have weakened. On a 12-month basis, overall inflation and inflation for items other than food and energy are running below 2 percent. Market-based measures of inflation compensation remain low; survey-based measures of longer-term inflation expectations are little changed.
In general, the economy is on solid footing. Employment gains -- which support consumer spending -- are "solid." There is some weakness in business investment and exports, but support for consumer spending -- which accounts for about 70% of US economic growth -- is strong. Given this description, there is no need for any action.
... the Committee decided to lower the target range for the federal funds rate to 1-3/4 to 2 percent. This action supports the Committee's view that sustained expansion of economic activity, strong labor market conditions, and inflation near the Committee's symmetric 2 percent objective are the most likely outcomes,but uncertainties about this outlook remain.
The key phrase is "but uncertainties about this outlook remain." The majority of Fed participants believe the uncertainties are large enough to warrant a modest rate cut. That's the key takeaway from the latest Fed meeting: a majority of Fed Presidents are concerned about the economic future.
The Census reported that 1-unit building permits rose a very healthy 4.5%. This is the fourth consecutive month of increases. Better yet are the charts of the data:
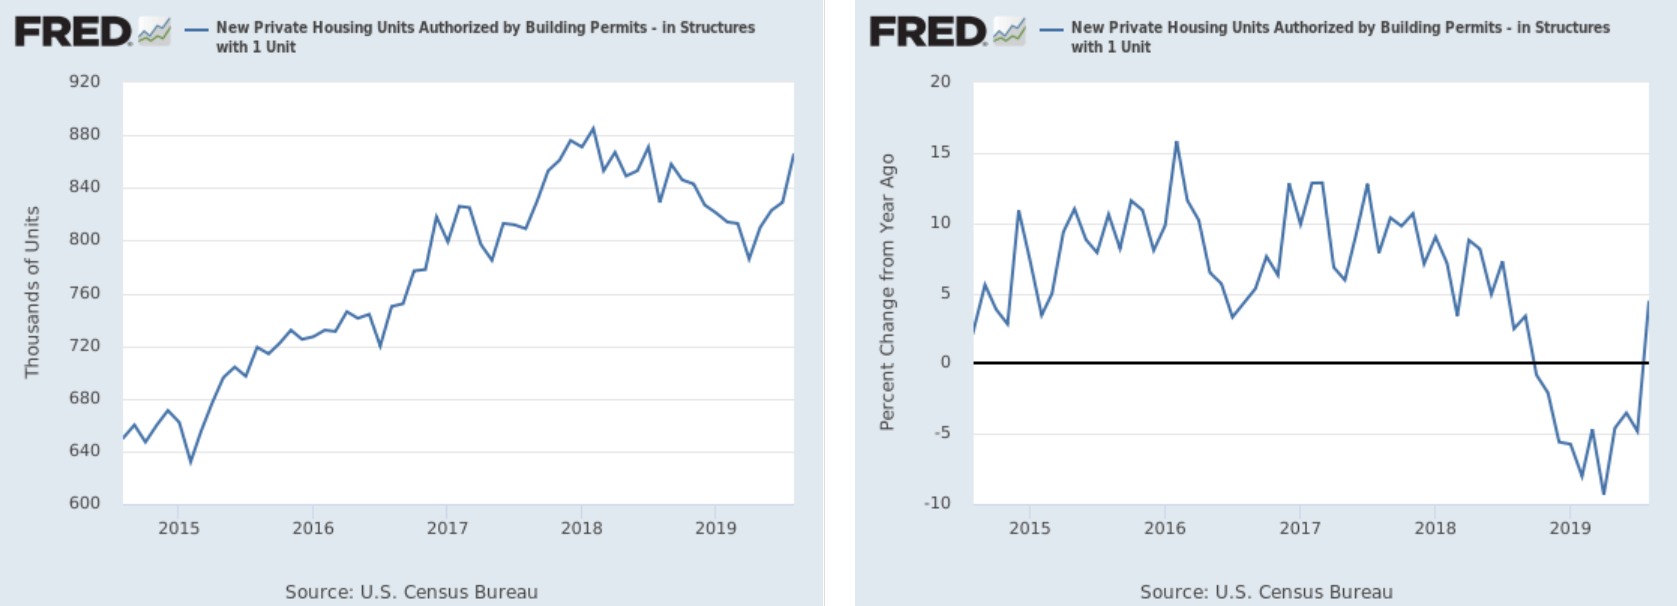
The left chart shows the absolute number. Starting in late 2017, it consistently declined. But the gain over the last four months has reversed that trend. The Y/Y number (right chart) is positive again; in fact, this month it made a very large jump.
The Federal Reserve reported that industrial production rose 0.6%. More importantly, manufacturing was up 0.5% -- which stands in contrast to the recent contraction in the PMI data. Here's a chart of the macro-level data:
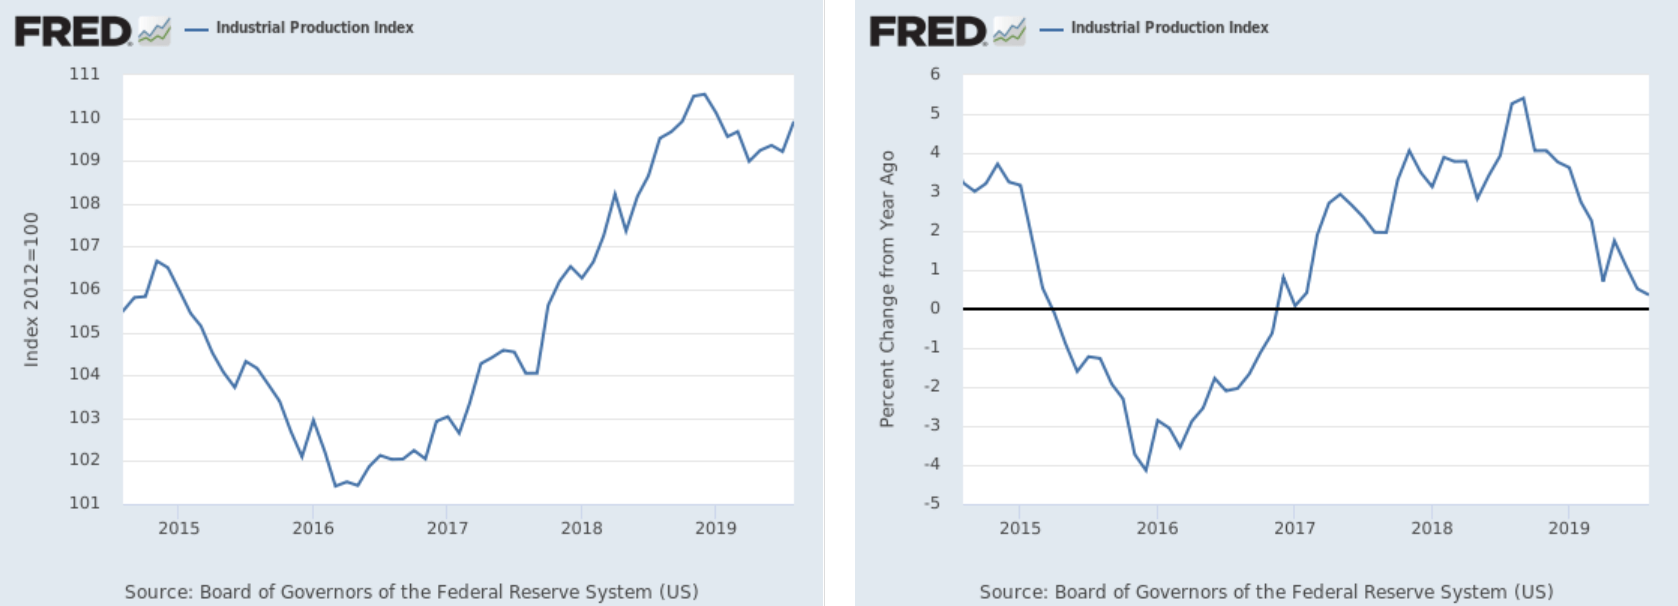
The absolute number (left chart) has started to move higher although the Y/Y percentage change is still heading lower. But another month of positive data should stop the Y/Y decline.
US conclusion: the economic data was very positive: building permits -- a key leading indicator -- have risen for four months and are near a cycle high. Industrial production was up modestly and may have averted a continued decline. The Fed added a bit more economic fuel this week as well.
US Markets
Let's look at this week's performance table:
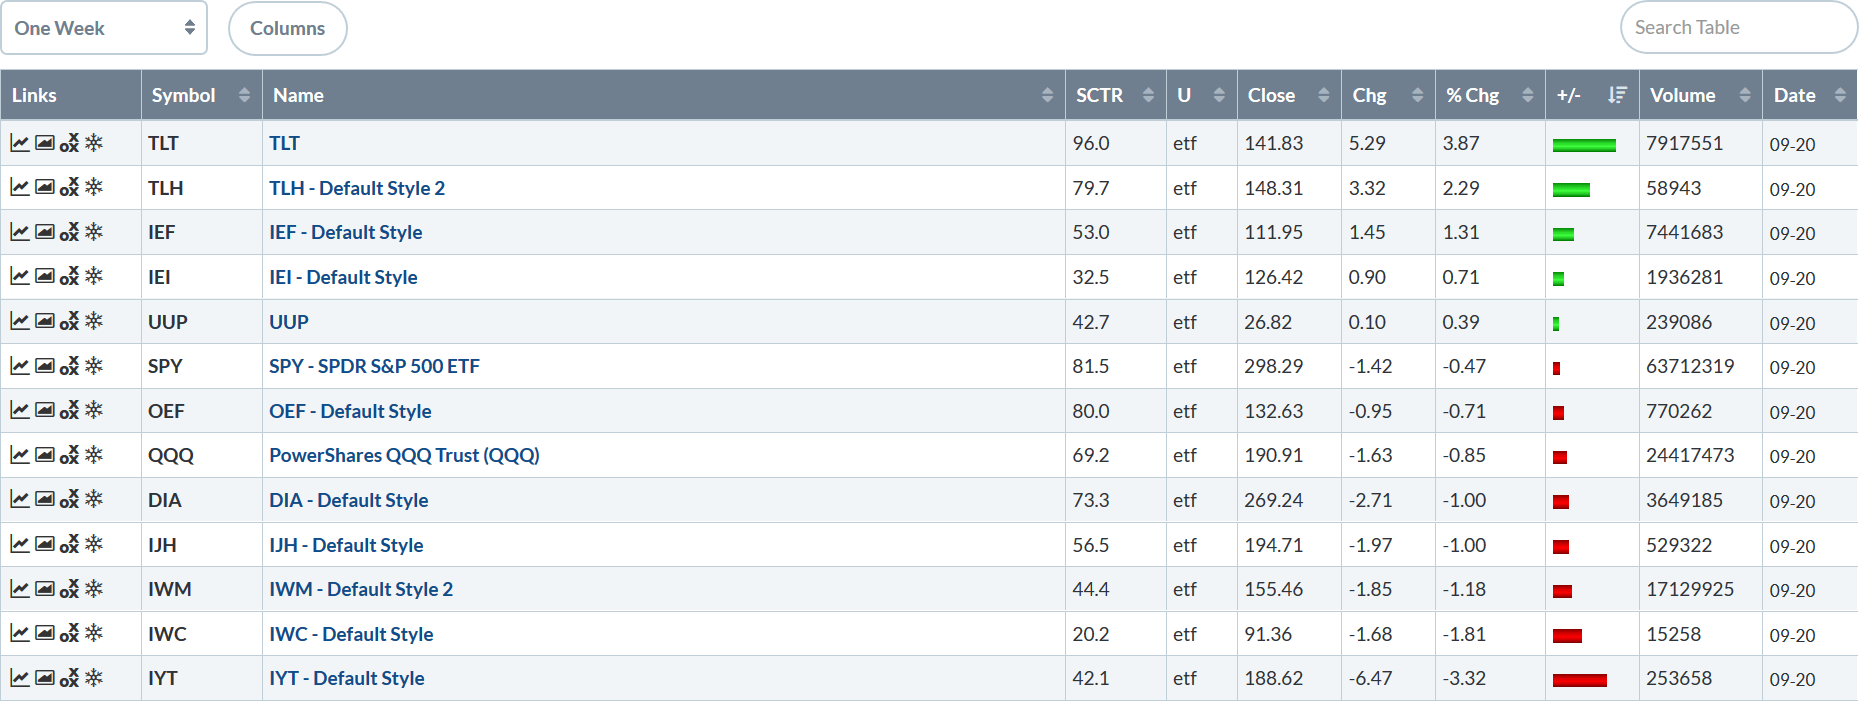
The markets are back to their old habits. Treasuries led the way higher. Larger-caps outperformed smaller-caps. The former gained strongly last week, so this week's selloff shouldn't be that surprising. But the bulls had better hope that this isn't the old trend of the Spring rally reasserting itself.
The reason I titled this week's column "The Big Stall" is that all of the markets have hit key resistance areas and have been unable to get above them.
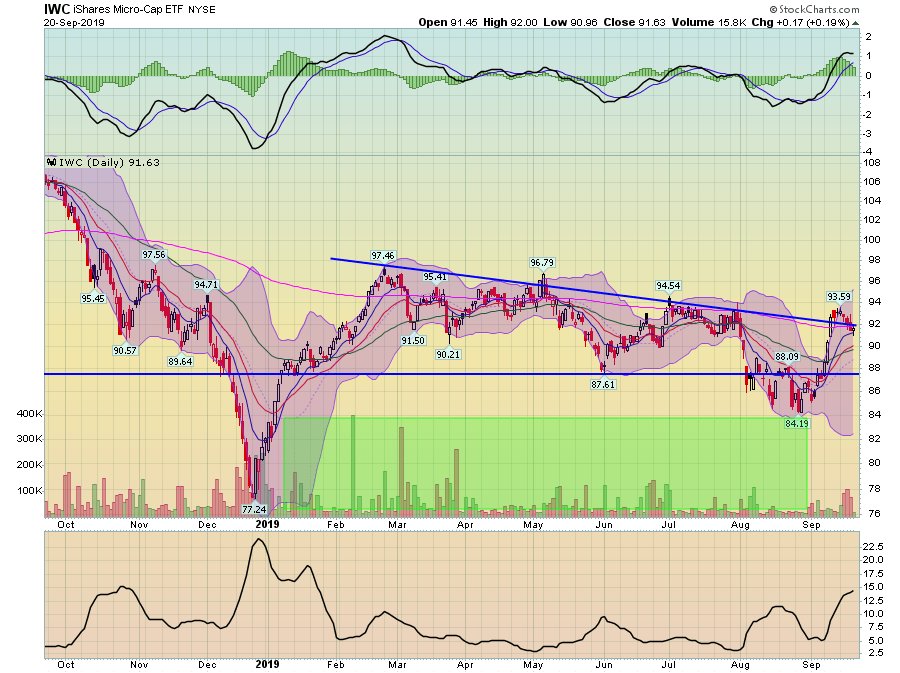
Micro-caps broke key resistance levels last week, but have fallen back.
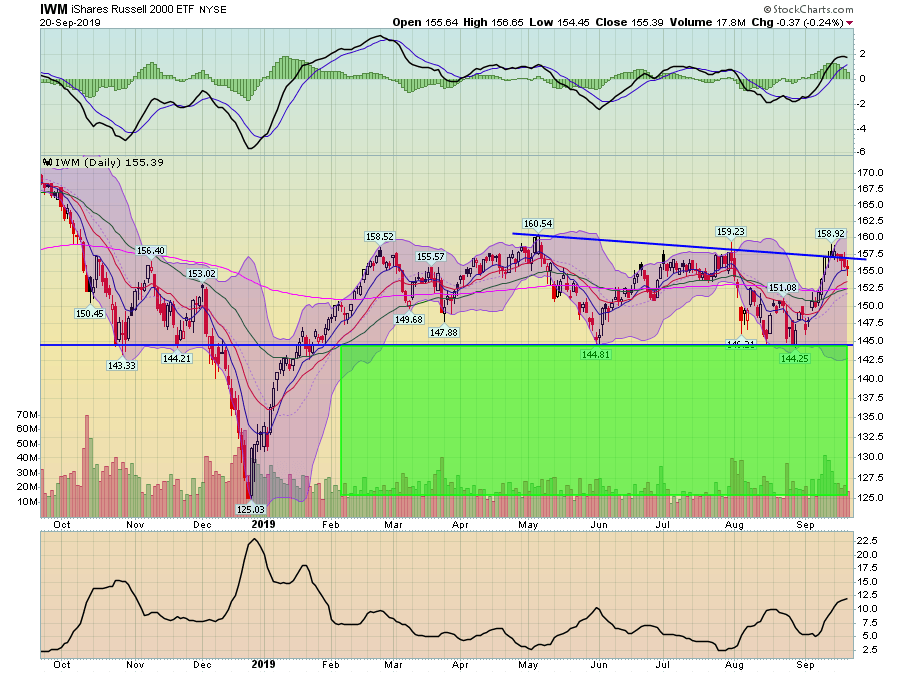
Small-caps exhibit the same trend, as do ...
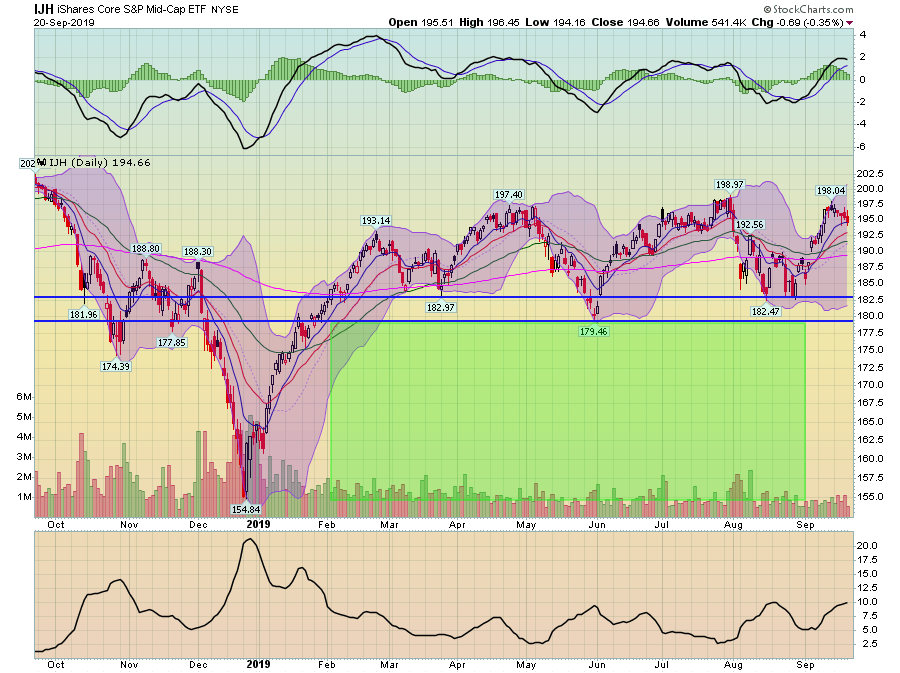
... mid-caps ...
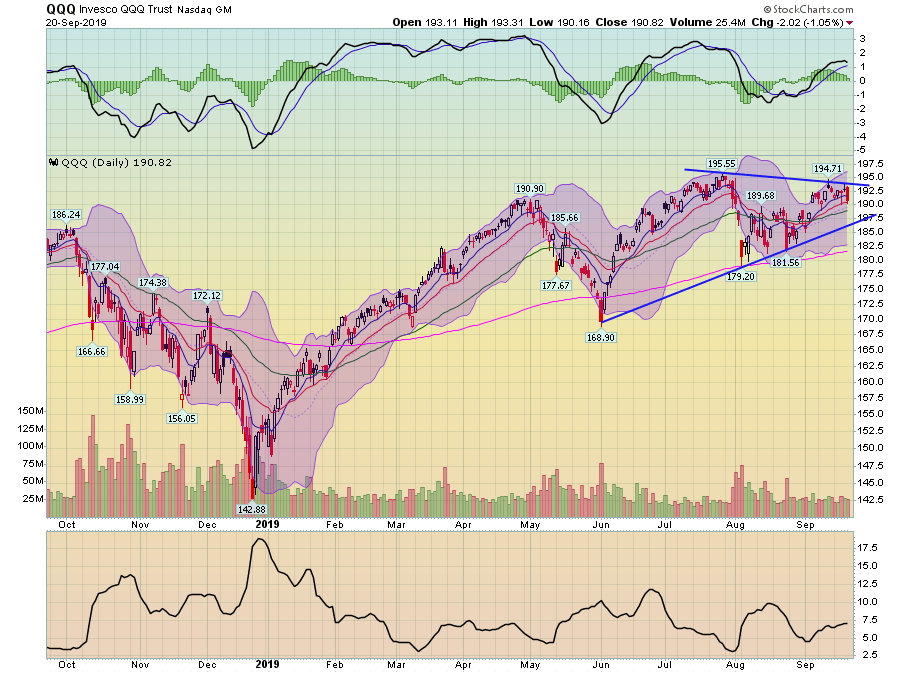
... the Nasdaq ...
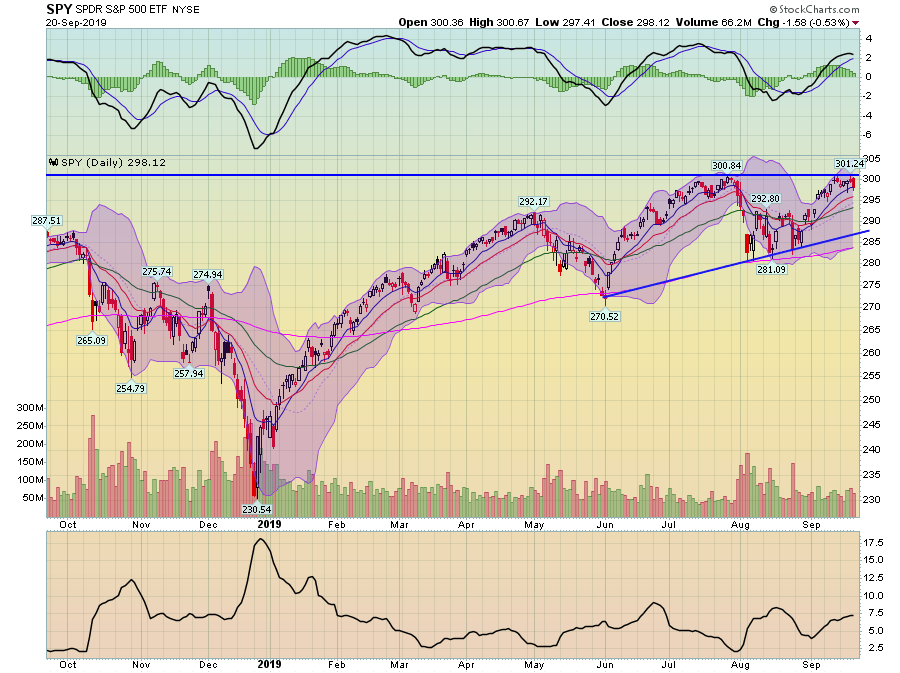
... and the S&P 500.
Remember that markets don't advance continually -- a natural pause after an advance is normal. But none of the markets look poised to make a strong move higher, which should concern us.
