It’s hard to explain why, on the day when GDP was revised down to show a much larger-than-expected drop, Fed Funds rate expectations rose a bit, bond yields crept upwards and the US stock market hit a new record high. It could be that the larger-than-expected drop in initial jobless claims was encouraging, but then again pending home sales for April were also below expectations, too. At the end of the day it probably has more to do with sentiment than with the data, which in any event all came out before the start of US trading.
There was the usual end-of-month data dump overnight from Japan. What it showed was worrisome: a larger-than-expected decline in consumption, expectations of weak output, and slowing price rises. In other words, Abenomics isn’t working. The BoJ may have to redouble its stimulus later in the year after all, with negative implications for the yen.
Apparently the rush to buy in March ahead of the consumption tax hike and the subsequent drop-off in demand in April was greater than during the previous consumption tax hike in 1997. Demand soared by 10.7% mom (SA) in March and then collapsed 13.3% mom in April. Meanwhile, industrial production also fell 2.5% mom in April as companies scaled back production in line with the fall-off in domestic demand. The government lowered its assessment of production to “appears to be flat” from “continues to show an upward movement,” as one might expect given companies’ forecast for basically flat output in May and June. It looks like the fall-out from the consumption tax hike may be bigger than people had anticipated.
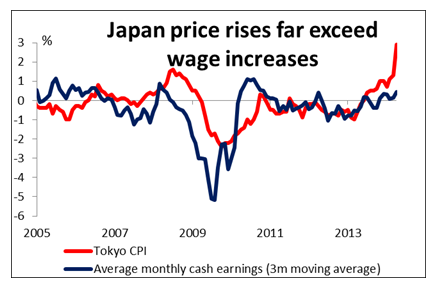
On the other hand, the impact on prices may be less than anticipated. The April core national CPI (that is, excluding fresh foods), came in at +3.2% yoy, which would be 1.5% yoy after factoring out the estimated 1.7 ppt boost from the tax hike. This is up from +1.3% yoy in March. But the Tokyo core CPI for May apparently slowed to +0.9% yoy from +1.0% yoy after taking account of the impact of the tax hike in May. Corporate prices also peaked last November. It looks like upward pressure on prices is actually diminishing. With output flat and prices falling, the likelihood of further Bank of Japan policy moves may rise further. Nonetheless, JPY strengthened slightly.
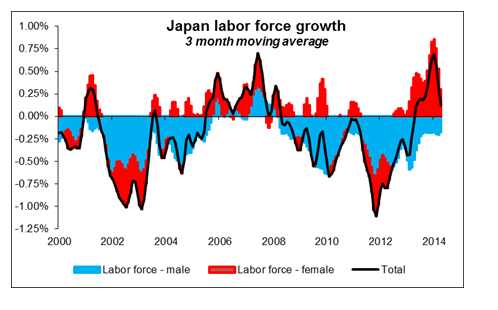
There was one other worrisome point in the figures. The unemployment rate was unchanged at 3.6% in April, but this hides a worrisome trend: the labor force population declined by 260,000. The labor force had been boosted recently by more women going to work, but the number of female workers began to shrink in January. Overall the number of workers apparently peaked last November and has started to shrink again. This is of course the nightmare scenario for Japan: how is a shrinking workforce going to support a growing number of pensioners and repay the ever-rising mountain of debt?
The commodity currencies were the best performing ones over the last 24 hours. In New Zealand, building permits for April surprised the market by rising +1.5% mom instead of declining 3.5% as expected, while in Australia, private sector credit rose by a faster-than-expected 0.5% mom in April (consensus: +0.4%). CAD meanwhile gained on technical factors after stop-losses were triggered in areas below recent lows.
Today: The European day starts with Germany’s retail sales for April, which are expected to have risen 0.2% mom, after declining 0.7% in March. Italy’s preliminary CPI rate for May is expected to have remained unchanged at +0.5%, while Sweden’s GDP for Q1 is forecast to have slowed.
In the US, personal income and personal spending are expected to have slowed in April, while the final UoM consumer sentiment for May is estimated to have risen.
From Canada, GDP for March is expected to have slowed to +0.1% mom from +0.2% in February, driving the yoy rate down to 2.3% from 2.5%.
We have four speakers on Friday’s schedule: Cleveland Fed President Sandra Pianalto gives opening remarks at the second day of conference entitled “Inflation, Monetary Policy and the Public”. Incoming Cleveland Fed President Loretta Mester will speak at the conference. Richmond Fed President Jeffrey Lacker and European Central Bank Governing Council member Carlos Costa also speak.
The Market
EUR/USD in a consolidative mode
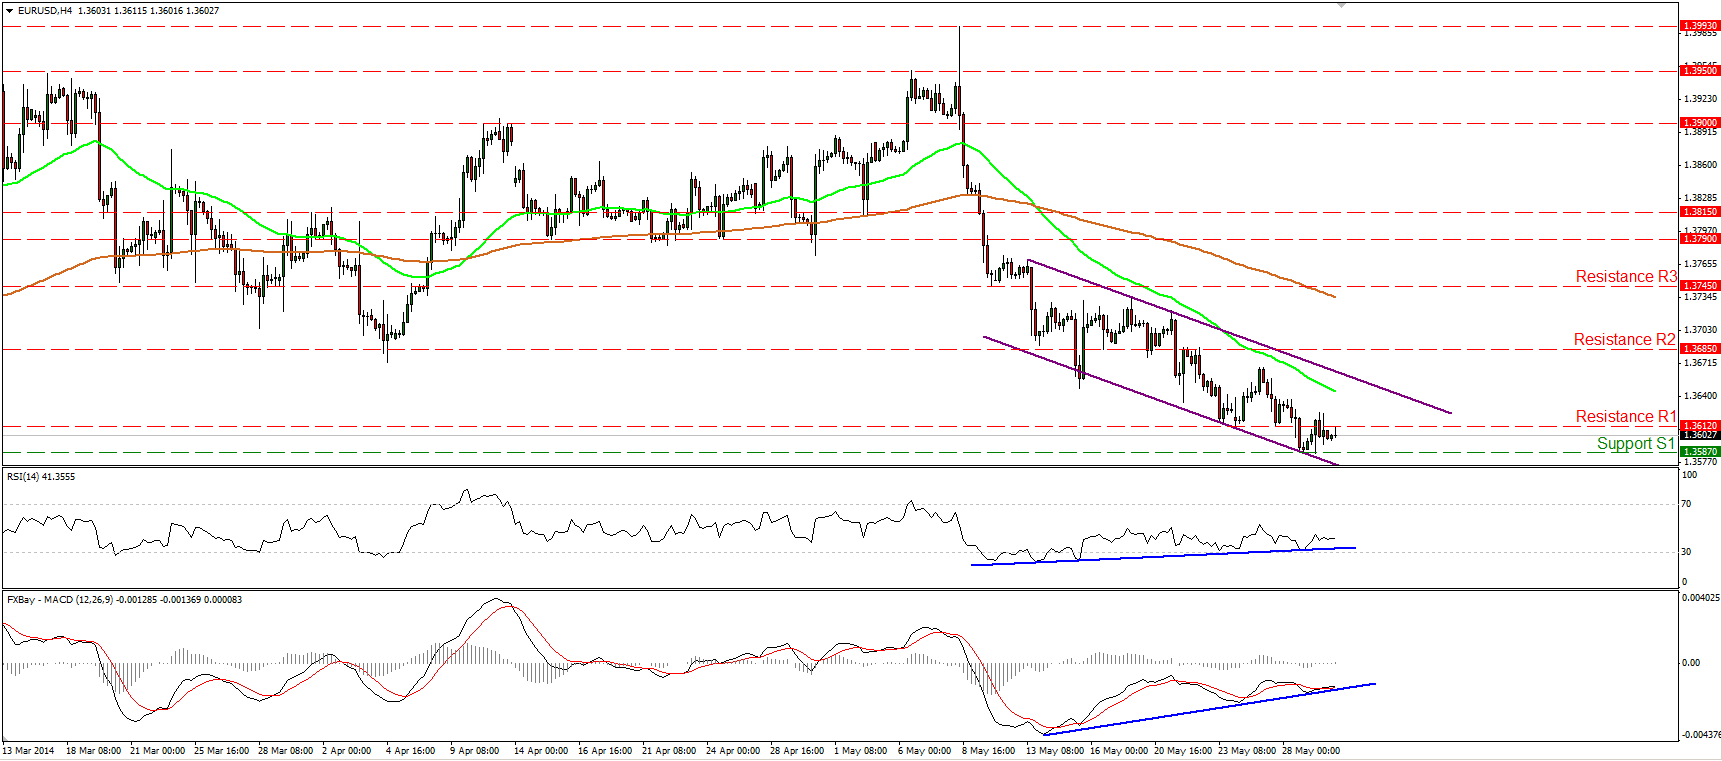
EUR/USD moved in a consolidative mode, remaining between the support of 1.3587 (S1) and the resistance of 1.3612 (R1). As long as the rate is printing lower highs and lower lows within the purple downtrend channel and below both the moving averages, the outlook remains to the downside. A dip below 1.3587 (S1) could have larger bearish implications, targeting the lows of February at 1.3475 (S2). Nonetheless, the positive divergence between our momentum studies and the price action remains in effect, thus I still cannot rule out further consolidation or an upside corrective wave within the channel. On the daily chart, the rate is trading below the 200-day moving average, increasing the possibilities for the continuation of the downtrend.
• Support: 1.3587 (S1), 1.3475 (S2), 1.3400 (S3).
• Resistance: 1.3612 (R1), 1.3685 (R2), 1.3745 (R3).
USD/JPY declines after finding resistance at 102.00
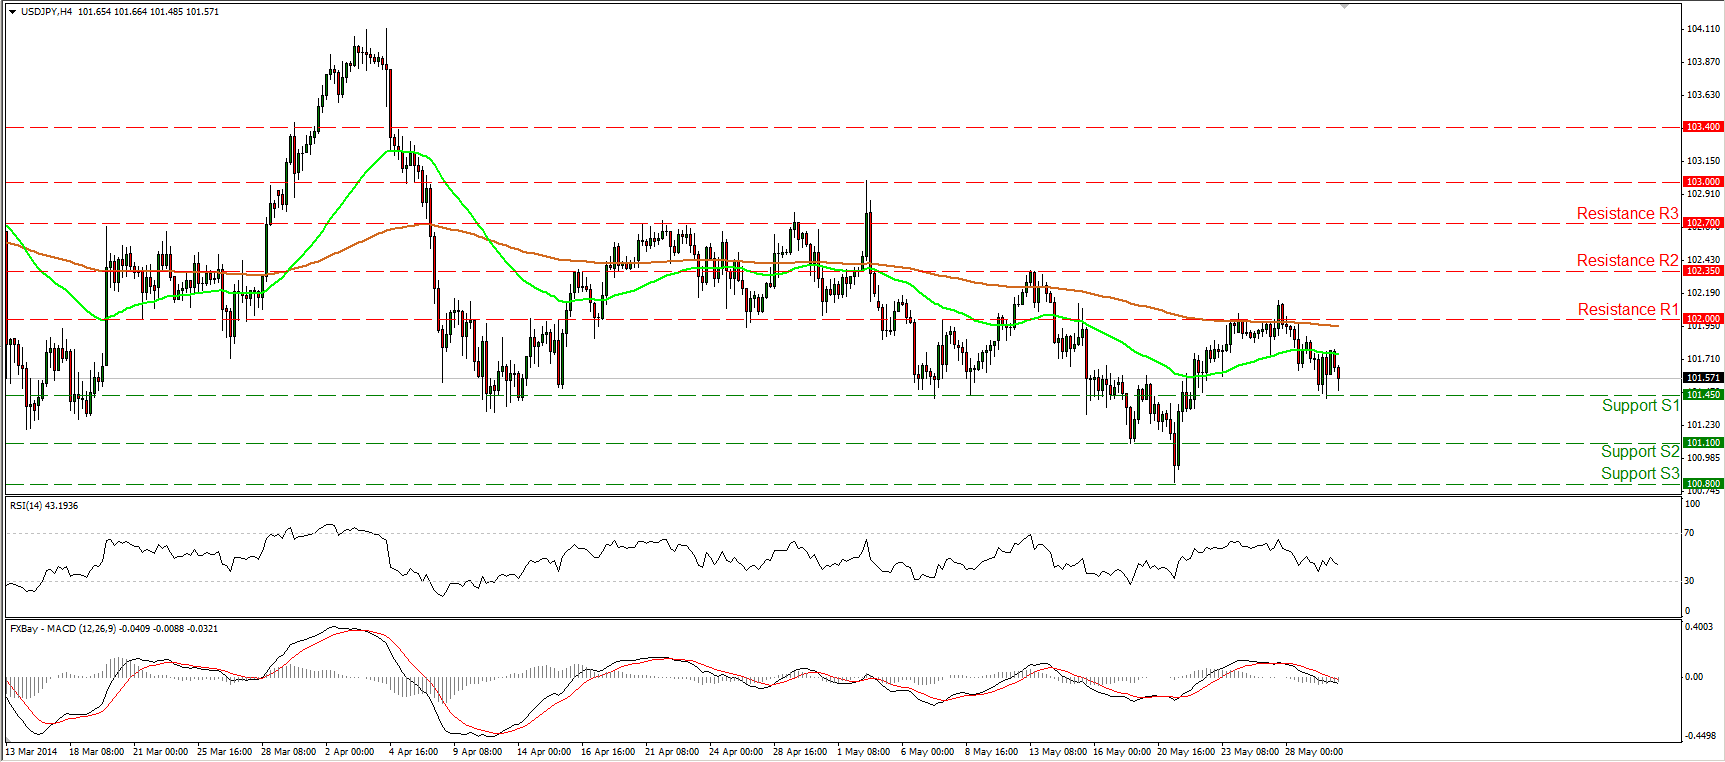
USD/JPY moved lower after finding strong resistance at the 102.00 zone, which coincides with the 200-period moving average. The bearish wave confirmed the negative divergence between our hourly momentum studies and the price action. In early European trading the pair is trading slightly above the 101.45 (S1) support. A clear break of that support could target the next one at 101.10 (S2). The MACD, already below its signal line, obtained a negative sign, shifting the momentum to the downside. In the bigger picture, the long-term path of USD/JPY remains sideways, since we cannot identify a clear trending structure.
• Support: 101.45 (S1), 101.10 (S2), 100.80 (S3).
• Resistance: 102.00 (R1), 102.35 (R2), 102.70 (R3).
EUR/GBP hits the downtrend line
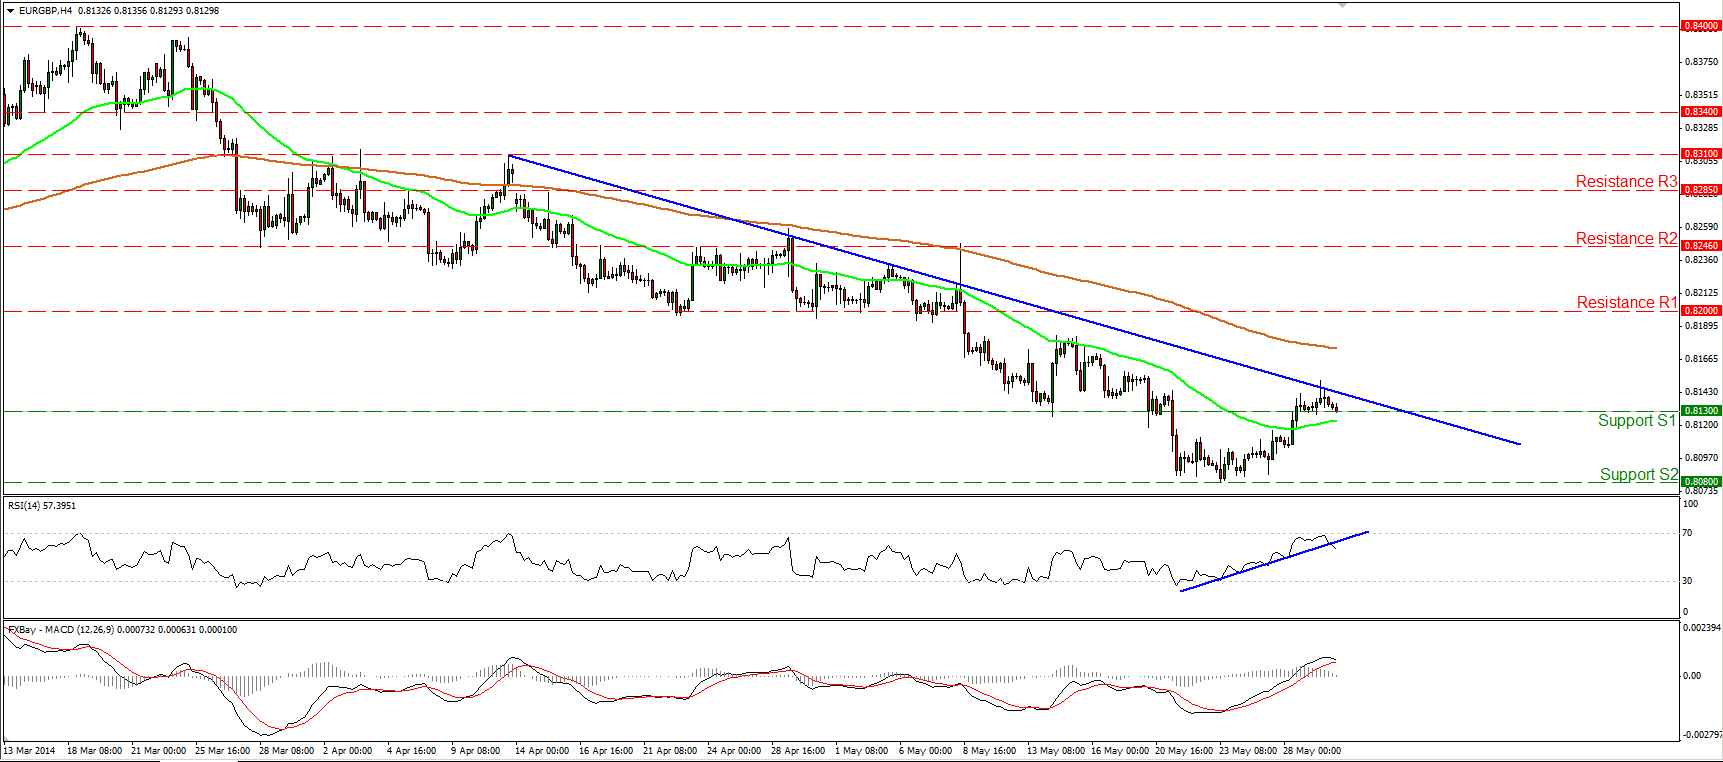
EUR/GBP moved higher to hit the blue downtrend line. Considering that the RSI found resistance at its 70 level and moved below its blue support line, and the fact that the MACD shows signs of topping, I would expect the forthcoming wave to be to the downside. Such a move may target again the lows of 0.8080 (S2). As long as the rate is printing lower highs and lower lows below the downtrend line, the path remains to the downside. However, we need a dip below 0.8080 (S2) to have a forthcoming lower low and the continuation of the trend.
• Support: 0.8130 (S1), 0.8080 (S2), 0.8035 (S3).
• Resistance: 0.8200 (R1), 0.8246 (R2), 0.8285 (R3).
Gold in a retracing mode
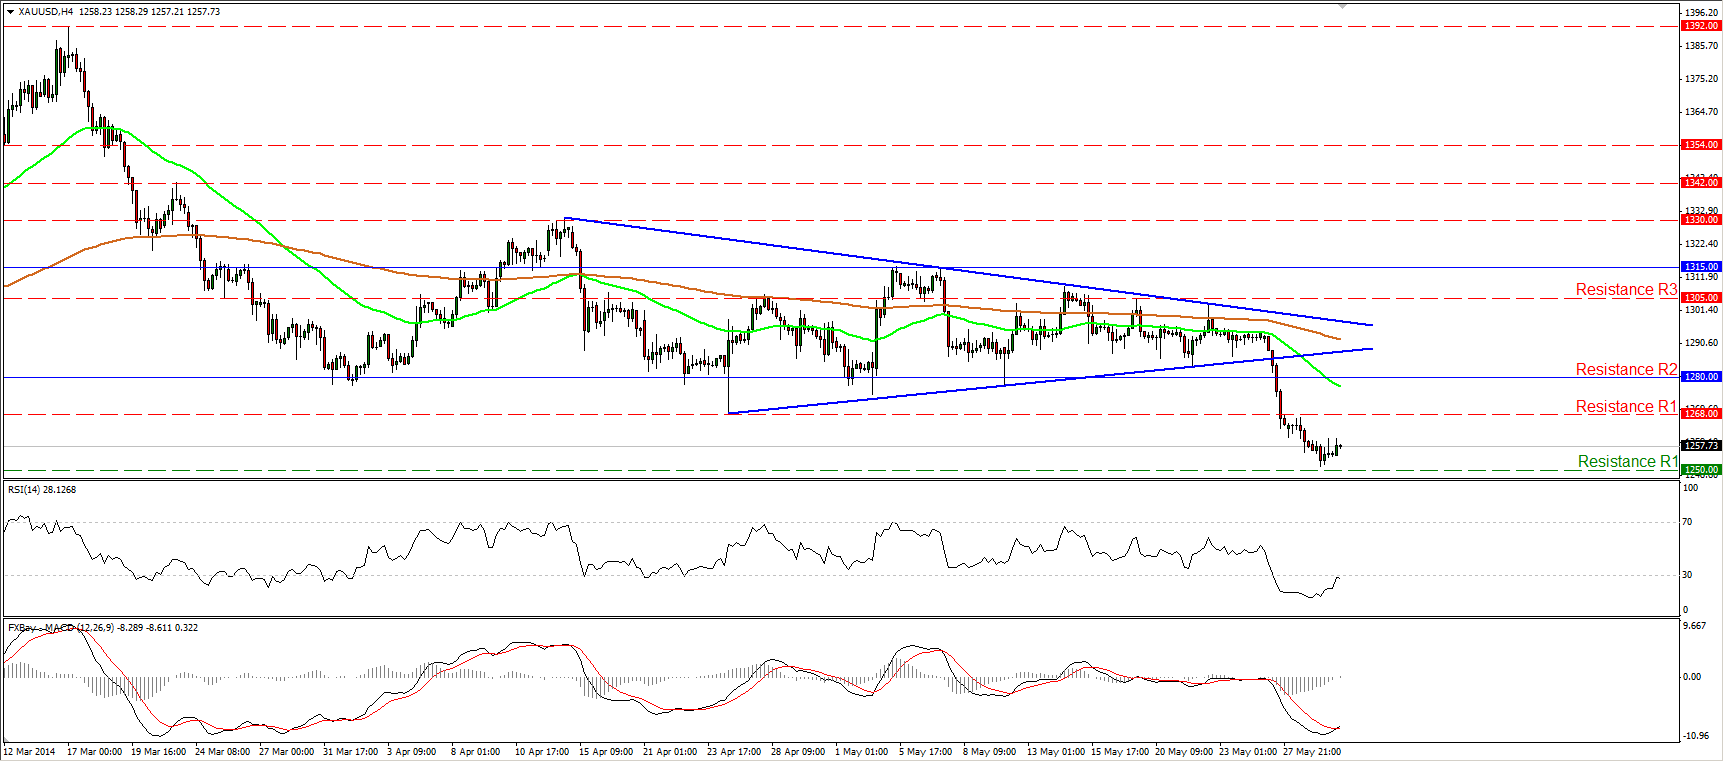
Gold moved slightly higher after finding support one dollar above our 1250 (S1) barrier. The RSI, already in its oversold zone, is approaching its 30 level, while the MACD, although in its bearish territory, crossed above its trigger line, favoring the continuation of the retracement. Nonetheless, I still see a negative picture and if the bears are strong enough to regain control and push the yellow metal below 1250 (S1), I would expect them to target the next support at 1235 (S2), slightly above the 161.8% extension level of the triangle’s width.
• Support: 1250 (S1), 1235 (S2), 1218 (S3).
• Resistance: 1268 (R1), 1280 (R2), 1305 (R3).
WTI higher but finds resistance
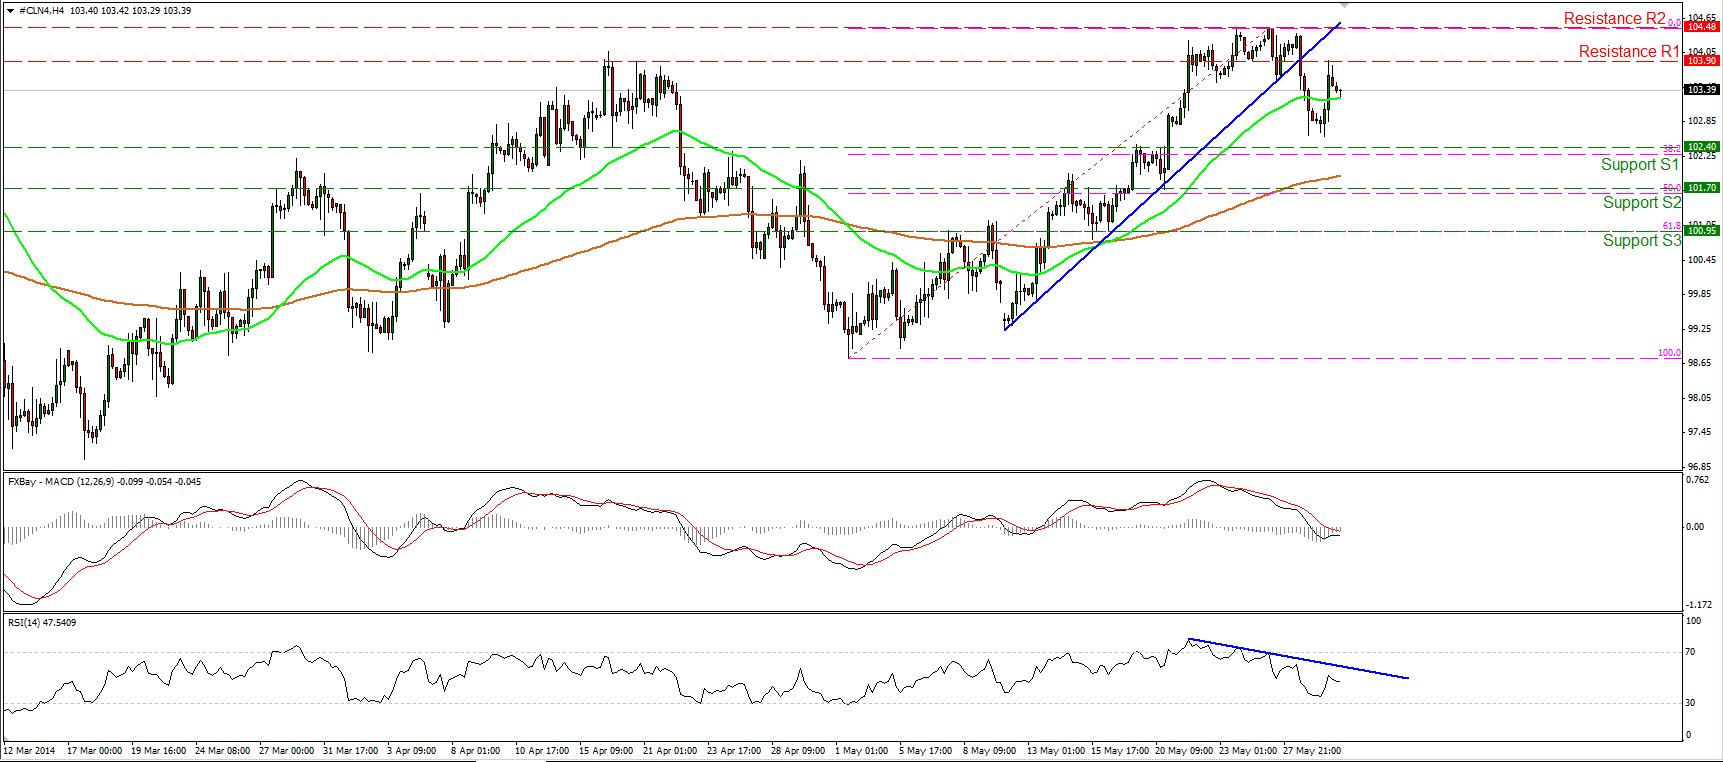
WTI moved higher on Thursday, but the advance was halted by 103.90 (R1). The price remains below the prior blue uptrend line and since the possibility for a lower highs still exist, I would still consider the outlook negative. Our short-term momentum studies continue their downward paths, while the MACD lies below both its signal and zero lines, favoring a bearish wave. Such a move may target the 102.40 zone, near the 38.2% retracement level of the prevailing advance.
• Support: 102.40 (S1), 101.70 (S2), 100.95 (S3).
• Resistance: 103.90 (R1), 104.48 (R2), 105.00 (R3).

