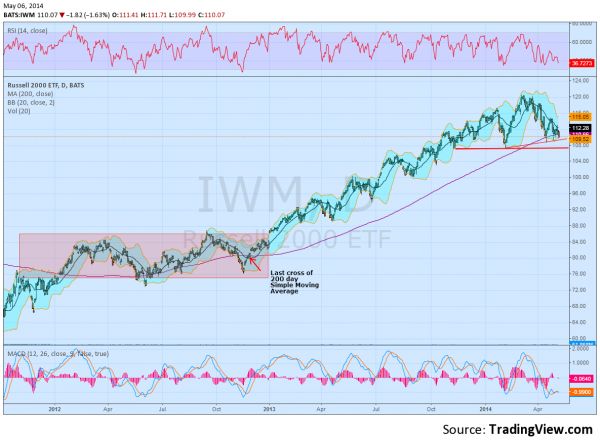
It might be, but not just because it is the 200 day Simple Moving Average. The rhetoric picked up with the Russell 2000 ETF, (ARCA:IWM), closing below this key level for the first time since Thanksgiving 2012. That is a long time. In fact my fellow Ohioan to the South, Ryan Detrick at Schaeffer’s, tells us that it is was above it for 363 days, just one day shy of the record of 364 days in 1994. That is a long time. Now before you go and sell everything keep in mind some positives from the chart below. What is positive here? Plenty. The 200 day SMA is rising, maybe flattening but rising. There is support (thick red line) at 107.20 just a little lower, with the key word being lower.
There is short term rising trend support (thin red line) making higher lows. I am not trying to tell you that this is a rosy scenario, it is not. But, it is also not a doomsday scenario. Look what happened the last time the 200 day SMA went flat (red box). There was a full year of consolidation followed by a move 30% higher. Is a year long consolidation what everyone called for at the start of the year? A move under the 200 day SMA is ok. A continued and prolonged decline, making lower lows is not. Stay viligant.
Disclaimer: The information in this blog post represents my own opinions and does not contain a recommendation for any particular security or investment. I or my affiliates may hold positions or other interests in securities mentioned in the Blog, please see my Disclaimer page for my full disclaimer.

