Strike price selection is such a key part of options trading basics and options calculations. There are 3 types of strike prices for both put and call options: in-the-money, at-the-money (and the closely related near-the-money) and out-of-the-money. Moneyness tells option holders whether exercising will lead to a profit. Moneyness looks at the value of an option if you were to exercise it right now. A loss would signify the option is out of the money, while a gain would mean it’s in the money. At the money means that you will break even upon exercise. In this article, I will show examples of the 3 types of strikes and the moneyness of each as they relate to put and call options.
Preview example
Let’s assume the price of a stock is $22.50. Here’s the easy part first: The $22.50 strike price would be at-the-money for both puts and calls. If the option holder (buyer) exercised the option and bought or sold the stock for $22.50, it would represent a breakeven situation compared to the current market value of $22.50.
Next, we will evaluate the $20 strike price. For call options this strike price is in-the-money because if the call was exercised, the call buyer would then buy the shares at $20 and can sell those shares at market for $22.50, generating a profit of $2.50 per share. The amount that the strike price is in-the-money is known as intrinsic value. For put options, however, the $20 strike is out-of-the-money because the holder has the right to sell the shares for $20, below market value.
Looking at the $25 strike price, the call holder has the right to buy the shares for $25, well above market value and therefore with no inherent value. For call options this strike is out-of-the-money. For put options, however, the $25 strike is in-the-money because the holder of the put has the right to sell his shares for $25, well above market value of $22.50. This option then has $2.50 of intrinsic value. The moneyness of in-the-money and out-of-the-money strikes is inversely related for calls and puts. A reliable way to determine the moneyness of an option is to ask this question: If I am the holder of the option, am I better off exercising the option or buying or selling the stock at market. If you are better off exercising then the strike price is in-the-money and has intrinsic value.
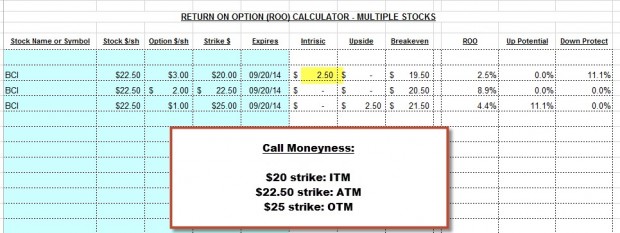
Example of calculating moneyness for call options using the Ellman Calculator (get a free copy using the “free resources” link at the top of this page)

Call options-calculating moneyness
Each strike has its benefits:
- $20 ITM: Offers 11.1% protection of the initial option profit (ROO or 2.5%). I favor these in bear or volatile markets
- $22.50 ATM: Offers the highest initial returns (ROO or 8.9%) but no upside potential or downside protection of the ROO
- $25 OTM: Offers a nice initial return (4.4%) and the potential for another 11.1% if share value appreciates to the $25 strike
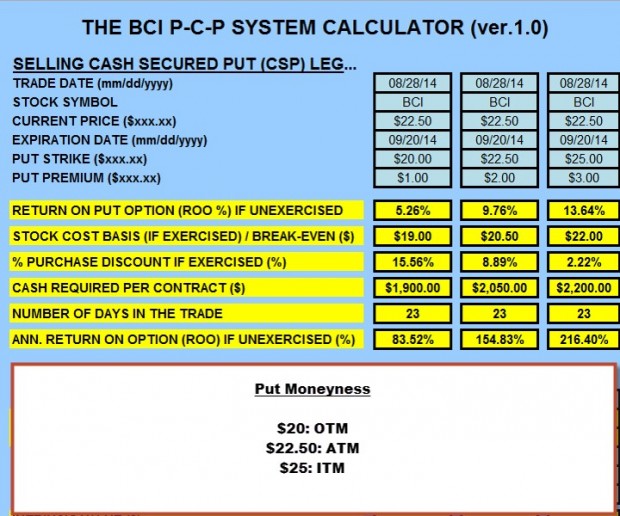
Example of calculating moneyness for put options

Calculating moneyness for put options
Each strike has its benefits:
- $20 OTM: Excellent initial return (5.26%) if unexercised and opportunity to purchase at a 15.56% discount from current market value if exercised
- $22.50 ATM: Generates a higher initial return (9.76%) than the $20 put and an opportunity to purchase the stock at an 8.89% discount from current market value if exercised
- $25 ITM: Offers the highest initial return if unexercised (13.64%) and an opportunity to buy the stock at a 2.22% discount from current market value if exercised
Summary
The moneyness of in-the-money and out-of-the-money strikes are inversely related for calls and puts. Each strike offers certain advantages that should be taken advantage of depending on market conditions, chart technicals, strategy goals and personal risk tolerance.
Scouter Ratings
Money Central recently reconstituted its website and as I write this article, the Scouter stats are not available. My team is reaching out to site support to ascertain whether those stats will eventually be available and, if so, when. If not, we will put an alternate plan in place over the coming weeks. Keep in mind that this is only one screen in a series of multiple fundamental, technical and common sense screens. We are currently evaluating alternate choices to replace this screen if, in fact, it will no longer be available in the future. This has happened in the past with the IBD site when we moved from stock checkup to SmartSelect. With or without the Scouter Ratings, the BCI Premium Stock Reports will remain the elite covered call writing resource. We will keep you informed.
Market tone
A volatile week included several mixed economic reports.
- New jobs of an unexpected 227,000 were added decreasing the unemployment level to 5.9%
- Personal income in August increased by 0.3% as expected
- Initial jobless claims for the week ending 9-27 came in at 287,000 below the 300,000 expected
- Consumer confidence dropped by 7.4 to a reading of 86
- In August, the trade deficit declined to $40.3 billion, better than expected
- Construction spending declined in August by 0.8% but was up 5% year-over-year
- The ISM manufacturing index for September came in at 56.6, worse than expected but still reflecting economic expansion
- In August factory orders dropped by 10.
Summary
IBD: Market in correction
GMI: 1/6: Sell signal since market close on 9-26-14
BCI: This site remains bullish on the overall economy but recognizes the impact of issues occurring with Ebola, in Hong Kong, with ISIS, in the Ukraine and here at home with the Secret Service (the door was unlocked…are you kidding me!). As a result I am taking a temporary defensive stand and favoring in-the-money strikes 2-to-1 with the expectation of returning to mostly out-of-the-money strikes as soon as these issues are absorbed by the financial markets.
Disclosure: Next live seminar - Monday, October 27, 2014, Austin, Texas Click for information I will be out-of-the-country for the next 2 weeks but will stay in touch as long as my internet connection functions.
