
The Bureau of Labor Statistics released the latest CPI data this morning. Year-over-year unadjusted Headline CPI came in at 1.98%, which the BLS rounds to 2.0%, up from 1.59% last month (rounded to 1.6%). Year-over year-Core CPI (ex Food and Energy) came in at an even 2.00%, up slightly from last month's 1.93%.
Here's the introduction from the BLS summary, which leads with the seasonally adjusted data monthly data:
The Consumer Price Index for All Urban Consumers (CPI-U) increased 0.7 percent in February on a seasonally adjusted basis, the U.S. Bureau of Labor Statistics reported today. Over the last 12 months, the all items index increased 2.0 percent before seasonal adjustment.
The gasoline index rose 9.1 percent in February to account for almost three-fourths of the seasonally adjusted all items increase. The indexes for electricity, natural gas, and fuel oil also increased, leading to a 5.4 percent rise in the energy index. The food index increased slightly in February, rising 0.1 percent. A sharp increase in the fruits and vegetables index was the major cause of the 0.1 percent increase in the food at home index, with other major grocery store food group indexes mixed.
The index for all items less food and energy increased 0.2 percent in February. The indexes for shelter, used cars and trucks, recreation, and medical care all rose in February. These increases more than offset declines in the indexes for new vehicles, apparel, airline fares, and tobacco.
The all items index increased 2.0 percent over the last 12 months compared to a 1.6 percent increase for the 12 months ending January. The index for all items less food and energy also increased 2.0 percent over the last 12 months. The energy index increased 2.3 percent and the food index rose 1.6 percent. More...
The Consensus
The Briefing.com consensus forecast was for a seasonally adjusted MoM 0.5% for Headline and 0.2% Core.
The first chart is an overlay of Headline CPI and Core CPI (the latter excludes Food and Energy) since 1957. The second chart gives a close-up of the two since 2000.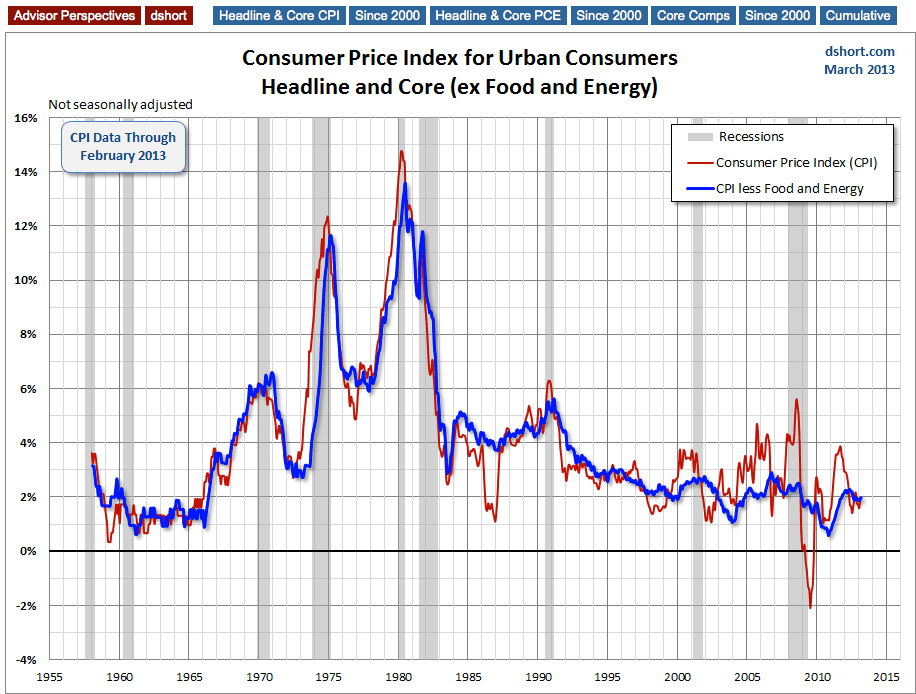
On the chart below I've highlighted 2 to 2.5 percent range. Two percent has generally been understood to be the Fed's target for core inflation. However, the December 12 FOMC meeting raised the inflation ceiling to 2.5% for the next year or two while their accommodative measures (low Fed Funds Rate and quantitative easing) are in place.
The Gap Between
Here we see more easily see the widening spread between headline and core CPI since late 2010, a pattern that began changing in October 2011 as headline inflation declined while core continued to rise, although it reversed directions earlier this year. We also see the jump in headline inflation since August owing mostly to the inevitable ripple effect of the rise in gasoline prices. With the decline in gasoline prices over the past few months, the headline number has continued to ease.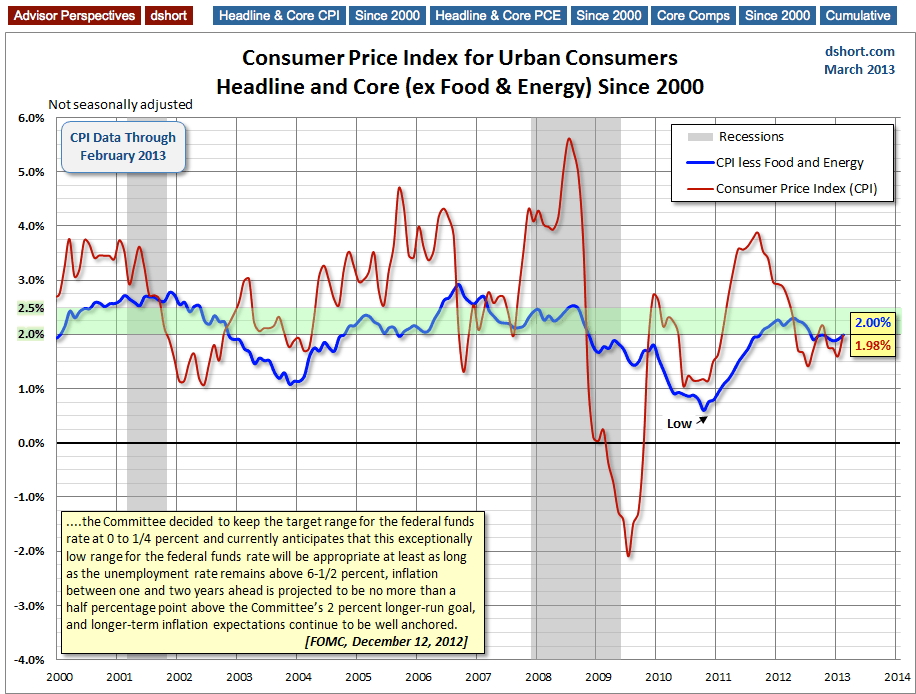
Federal Reserve policy, which has historically focused on core inflation, and especially the core Personal Consumption Expenditures (PCE), will see that the latest core CPI is at the near-term target range of 2 to 2.5 percent, and the more volatile headline inflation, at least for last month, is at the same level.
- English (UK)
- English (India)
- English (Canada)
- English (Australia)
- English (South Africa)
- English (Philippines)
- English (Nigeria)
- Deutsch
- Español (España)
- Español (México)
- Français
- Italiano
- Nederlands
- Português (Portugal)
- Polski
- Português (Brasil)
- Русский
- Türkçe
- العربية
- Ελληνικά
- Svenska
- Suomi
- עברית
- 日本語
- 한국어
- 简体中文
- 繁體中文
- Bahasa Indonesia
- Bahasa Melayu
- ไทย
- Tiếng Việt
- हिंदी
Thanks To Gas Prices, Inflation Higher Than Thought
Published 03/15/2013, 10:11 AM
Updated 07/09/2023, 06:31 AM
Thanks To Gas Prices, Inflation Higher Than Thought
Latest comments
Loading next article…
Install Our App
Risk Disclosure: Trading in financial instruments and/or cryptocurrencies involves high risks including the risk of losing some, or all, of your investment amount, and may not be suitable for all investors. Prices of cryptocurrencies are extremely volatile and may be affected by external factors such as financial, regulatory or political events. Trading on margin increases the financial risks.
Before deciding to trade in financial instrument or cryptocurrencies you should be fully informed of the risks and costs associated with trading the financial markets, carefully consider your investment objectives, level of experience, and risk appetite, and seek professional advice where needed.
Fusion Media would like to remind you that the data contained in this website is not necessarily real-time nor accurate. The data and prices on the website are not necessarily provided by any market or exchange, but may be provided by market makers, and so prices may not be accurate and may differ from the actual price at any given market, meaning prices are indicative and not appropriate for trading purposes. Fusion Media and any provider of the data contained in this website will not accept liability for any loss or damage as a result of your trading, or your reliance on the information contained within this website.
It is prohibited to use, store, reproduce, display, modify, transmit or distribute the data contained in this website without the explicit prior written permission of Fusion Media and/or the data provider. All intellectual property rights are reserved by the providers and/or the exchange providing the data contained in this website.
Fusion Media may be compensated by the advertisers that appear on the website, based on your interaction with the advertisements or advertisers.
© 2007-2025 - Fusion Media Limited. All Rights Reserved.