Tezos wants to stage a near-term price recovery, but there is one hurdle that it must overcome.
Key Takeaways
- The parabolic SAR and MACD suggest that Tezos is preparing for a bullish impulse.
- Nonetheless, the smart contracts token faces stiff resistance ahead.
- Only a candlestick close above the 100-twelve-hour moving average, will add credibility to the optimistic outlook.
The Tezos token, XTZ, is facing an uphill battle after falling more than 58%. Still, several technical indexes suggest that the top-20 cryptocurrency is on its way to greener pastures.
The Odds Seems to Favor Tezos’ Bulls
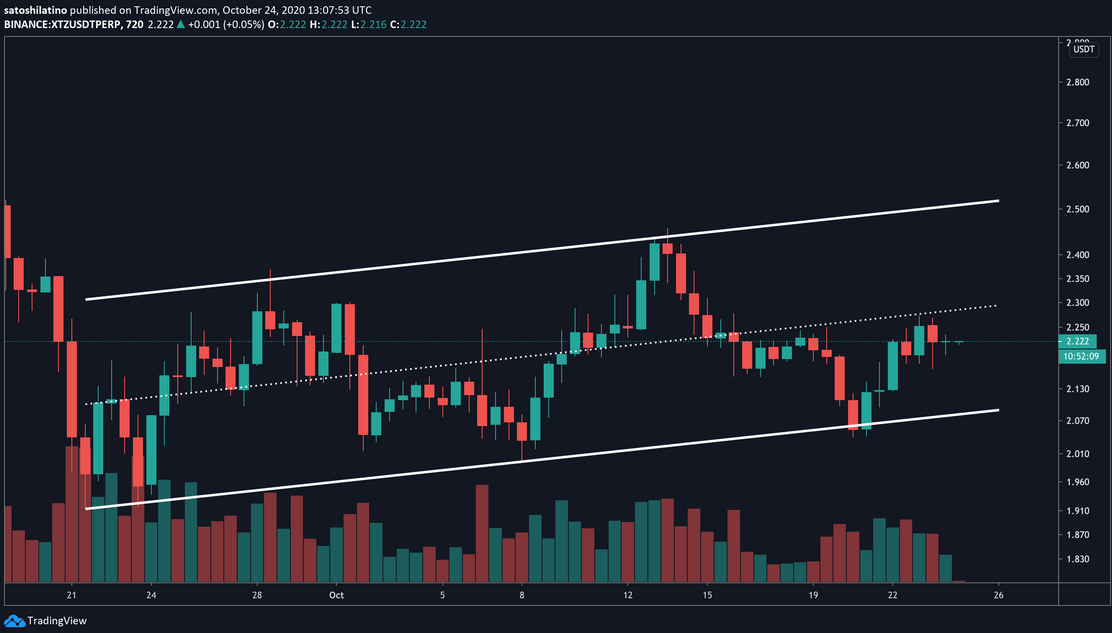
When looking at Tezos’ price action on its 12-hour chart, the token has been contained within an ascending parallel channel for the past month.
Each time XTZ has risen to this technical formation’s upper boundary, it gets rejected and retraces to the lower edge. From this point, it tends to rebound, consistent with the characteristics of a channel.
Following a retest of the underlying support, many buy orders got filled, allowing Tezos to bounce back up again. The bullish impulse has, however, been capped by the middle line of the ascending parallel channel.
Regardless, multiple technical indexes suggest that this cryptocurrency is poised to advance towards the overhead resistance at $2.5.

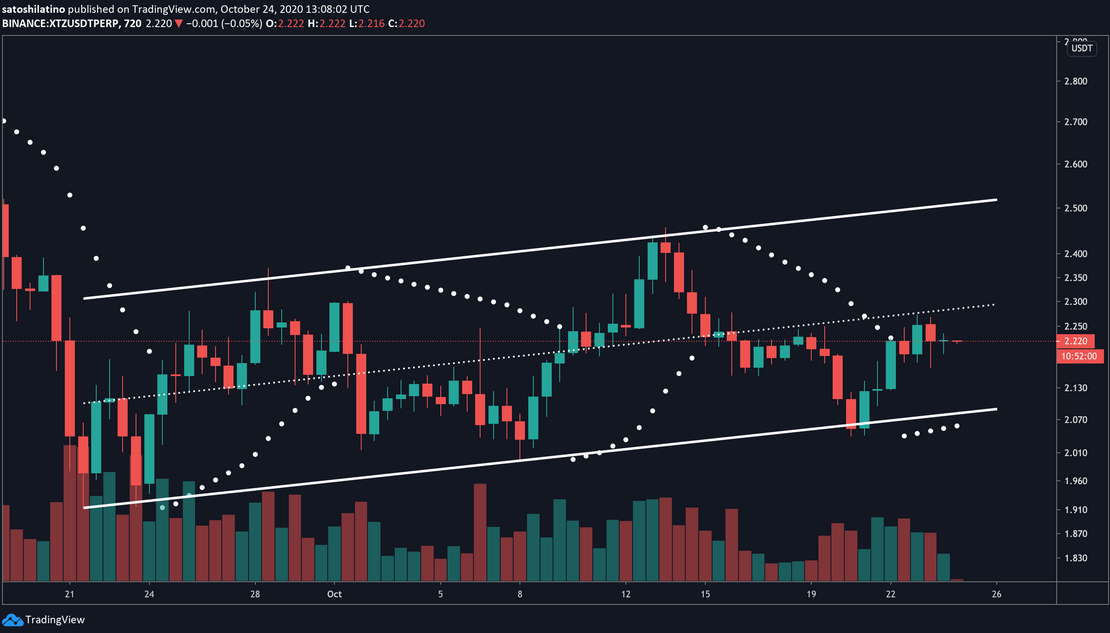
The parabolic stop and reverse point, or “SAR,” adds credence to the optimistic outlook.
This trend-following indicator forecasts that Tezos’ downtrend reached exhaustion. The SAR points moved below XTZ’s price, which can be considered a very positive sign.
Historically, the SAR metric has been highly effective in determining the course of this altcoin. The last two times the parabolic SAR flipped from bearish to bullish within the 12-hour chart, Tezos’ price surged by 17% and 12%, respectively.

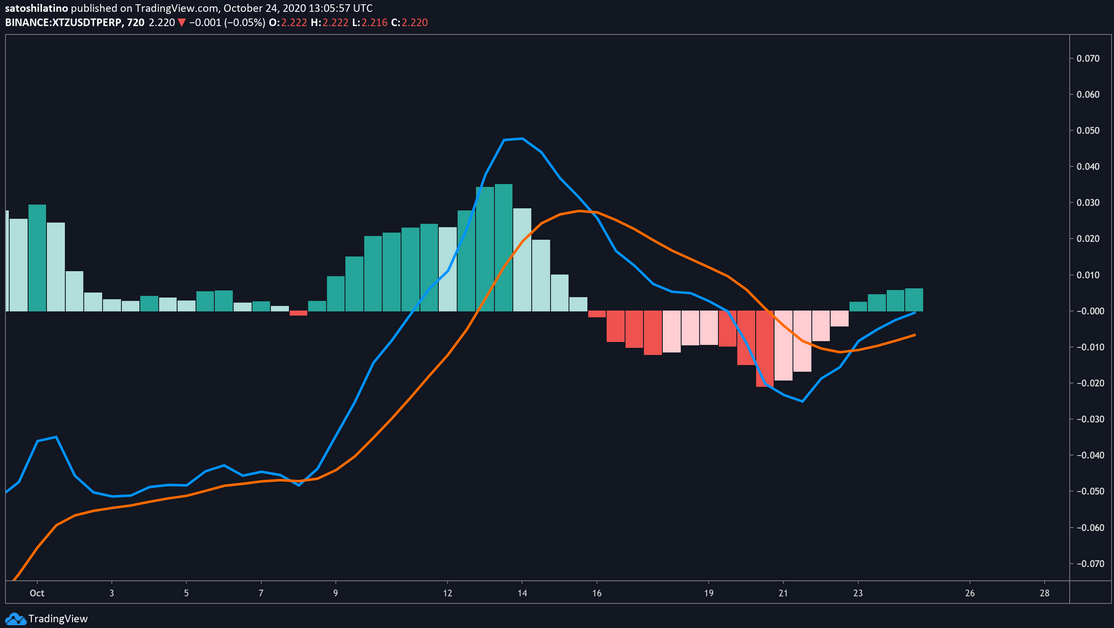
Moreover, the moving average convergence divergence, or MACD, also turned bullish within this time frame.
As the 12-twelve-hour exponential moving average crossed above the 26-twelve-hour exponential moving average, the odds for a further bullish impulse increased significantly.

While the odds seem to favor the bulls, Tezos still faces stiff resistance ahead.
Key Price Levels to Watch
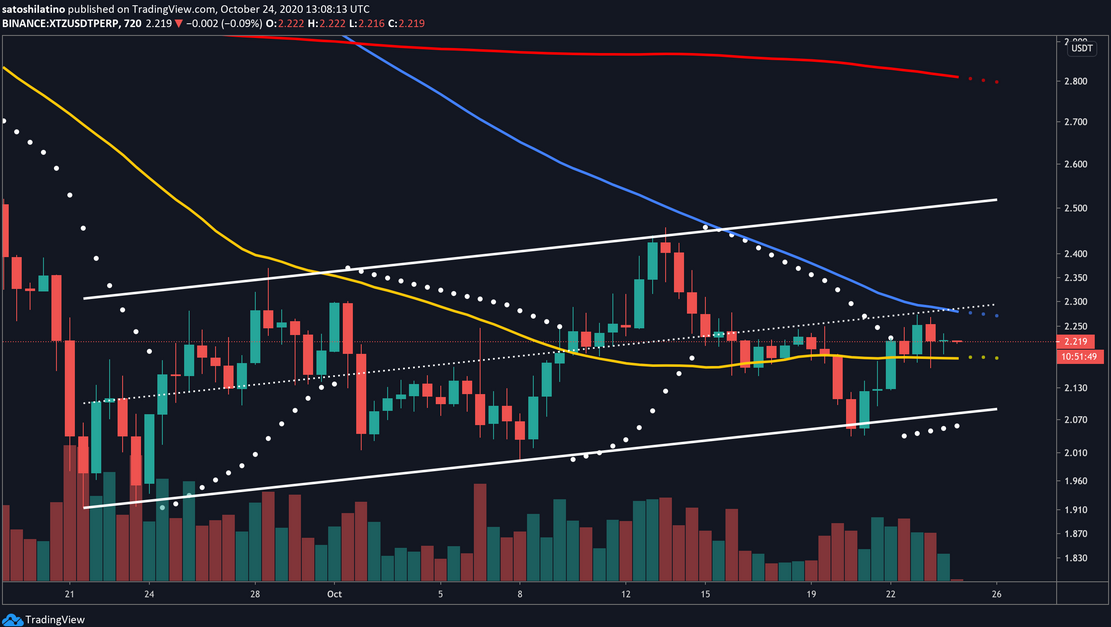
The 100-twelve-hour moving average and the middle line of the parallel channel previously mentioned appear to be preventing this altcoin from achieving its upside potential. Therefore, only a candlestick close above these hurdles will help validate the optimistic outlook.
If this were to happen, the next critical areas of interest to pay attention to are the channel’s upper boundary at $2.5 and the 200-twelve-hour moving average at $2.8.

If sell orders begin to pile up and Tezos loses the 50-twelve-hour moving average as support, the near-term forecast will turn bearish.
Under such circumstances, XTZ will likely drop to the parallel channel’s lower boundary, which currently sits at $2.1.
