In response to my Harry Browne Permanent ETF Portfolio article from last week, David Jackson of Seeking Alpha wondered if the portfolio had been tested with Emerging Markets ETFs as opposed to US equities. His theory is the Emerging Markets have added beta over US stocks and may perform better in the future due to higher expected GDP growth.
I created a second Harry Browne Permanent ETF Portfolio in ETF Replay and then used their platform to test the results. The portfolio consists of a 25% equal allocation to EEM (MSCI Emerging Markets Index Fund), TLT (iShares Barclays 20+ Year Treasury), SHY (iShares Barclays 1-3 Year Treasury Bond Fund), and GLD (SPDR Gold Trust). This allocation is identical to the portfolio in my “original” Harry Browne portfolio with one exception: EEM has been substituted for SPY (SPDR S&P 500 ETF).
If an investor bought the Emerging Markets Permanent Portfolio on January 3rd, 2005 and held until February 17th, 2012, the total return was 128.4% (12.3% CAGR) and 12.7% volatility (all returns discussed exclude commissions, taxes, and slippage). The original Harry Browne Portfolio (SPY/SHY/TLT/GLD) would have returned 105.6% (10.7% CAGR) at 9.3% volatility: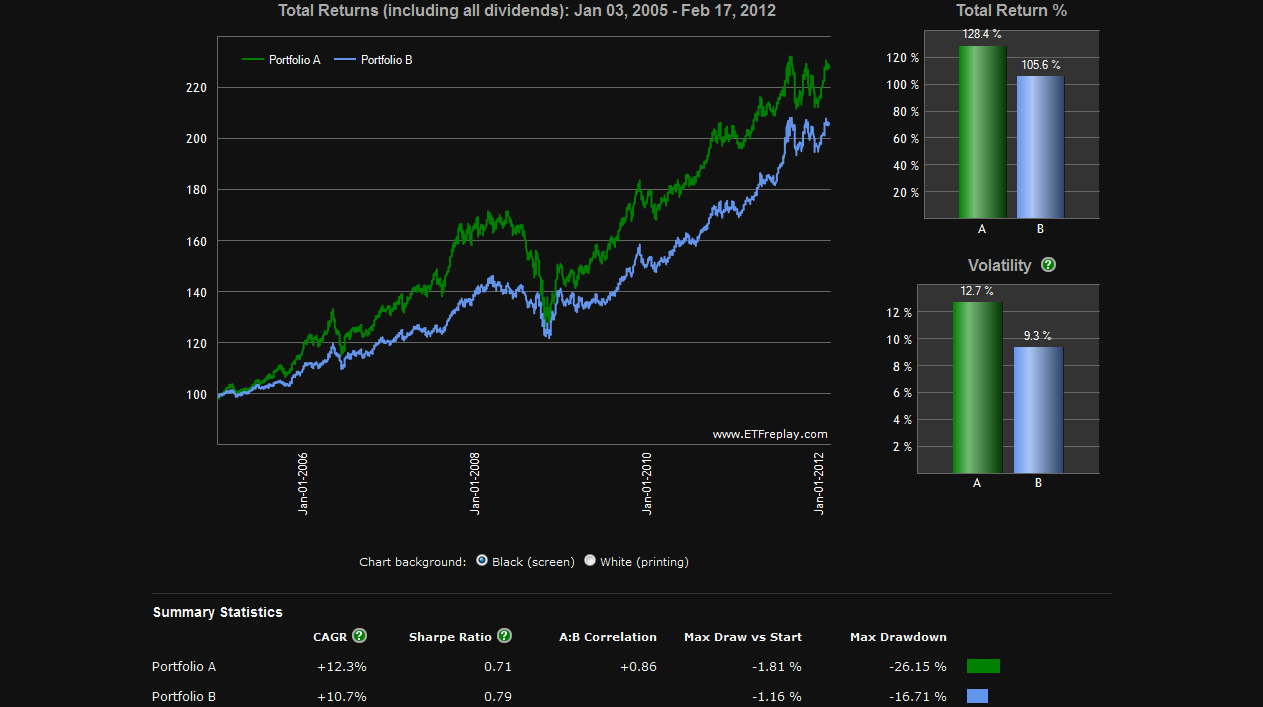
The max drawdown on the Emerging Market Permanent portfolio was 26.15% versus 16.17% for the original version. The increased volatility and drawdown of the Emerging Market version is not surprising since emerging market equities have traditionally had higher volatility than large cap US equities.
In my original article I also tested the 10 month moving average system popularized in recent years by Mebane Faber in The Ivy Portfolio: How to Invest Like the Top Endowments and Avoid Bear Markets. When an ETF in the portfolio was below its 10 month moving average at month-end, the position was sold and held in “cash” (SHY was used as a substitute for cash). When it closed the month above its 10 month moving average, the ETF was purchased at the stated allocation.
To properly test the moving average system I had to begin the test at the beginning of 2006 since GLD did not have adequate trading history to generate a 10 month moving average in 2005. In order to properly compare strategies (moving average vs. buy and hold) we first need to show the results for buying and holding the portfolios over the same time period of 2006-present (portfolio A is the Emerging Markets version, Portfolio B is the original):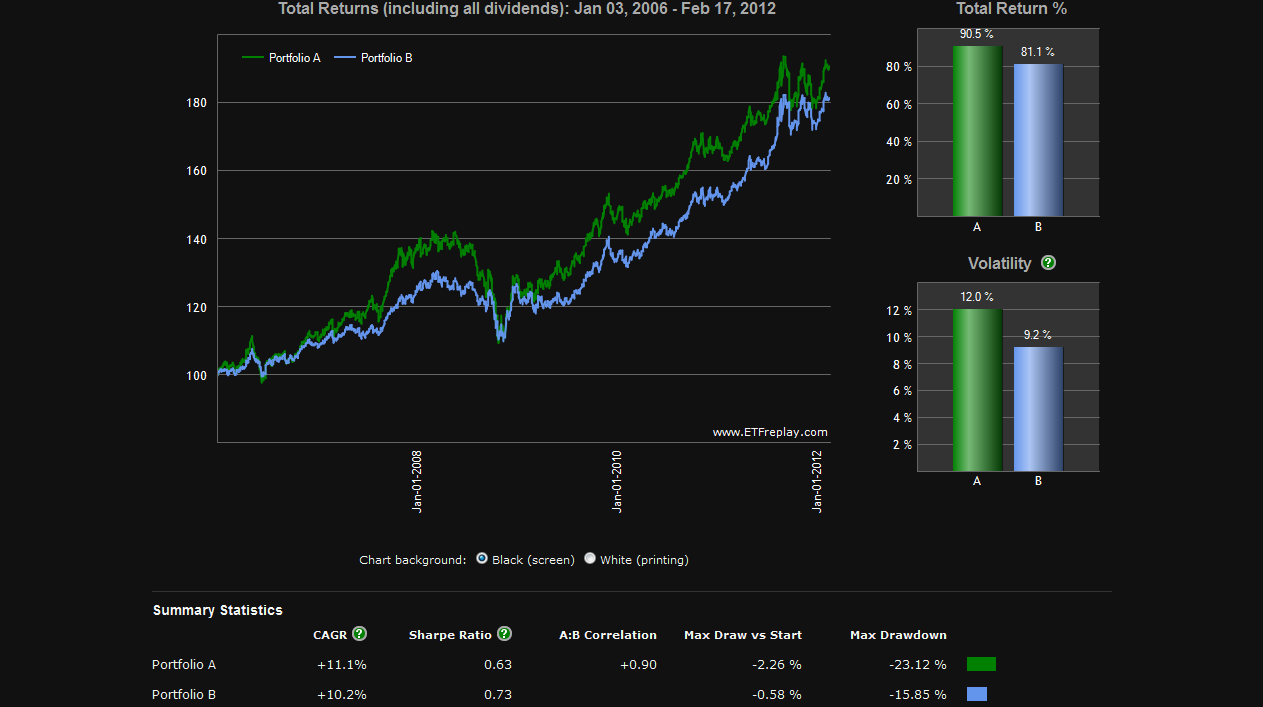
We see that the Emerging Markets version had a total return of 90.5% (11.1% CAGR). .63 sharpe ration, and 12% volatility. The original version had a total return of 81.1% (10.2% CAGR), .73 sharpe ratio, and 9.2% volatility.
For the first 10 month moving average test we will revisit the original Harry Browne ETF Portfolio (SPY/SHY/TLT/GLD). When we test the 10 month moving average system we see is that the moving average system decreased volatility and returns while increasing the sharpe ratio: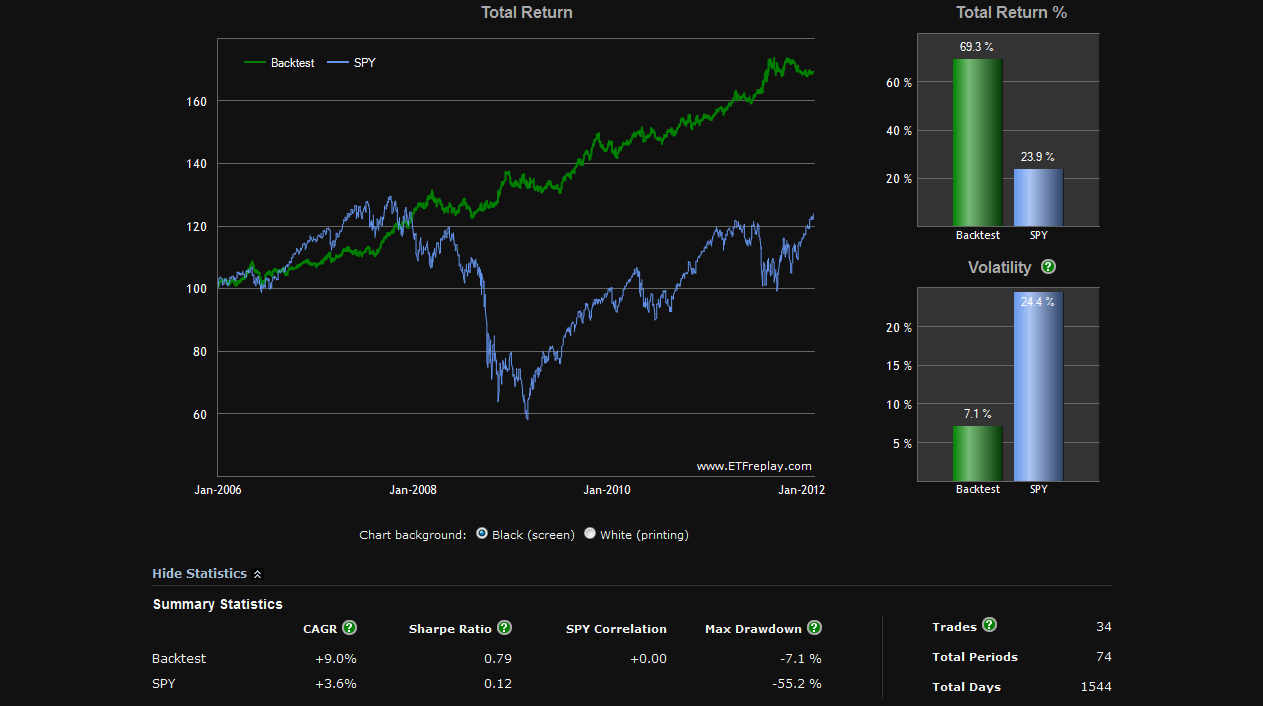
Below are the annual performance statistics which include no down years (2012 is down year to date):
When we apply the 10 month moving average system to the Emerging Markets version(EEM/SHY/TLT/GLD), we see the same impact, a decrease in returns and volatility and an increase in the portfolios sharpe ratio: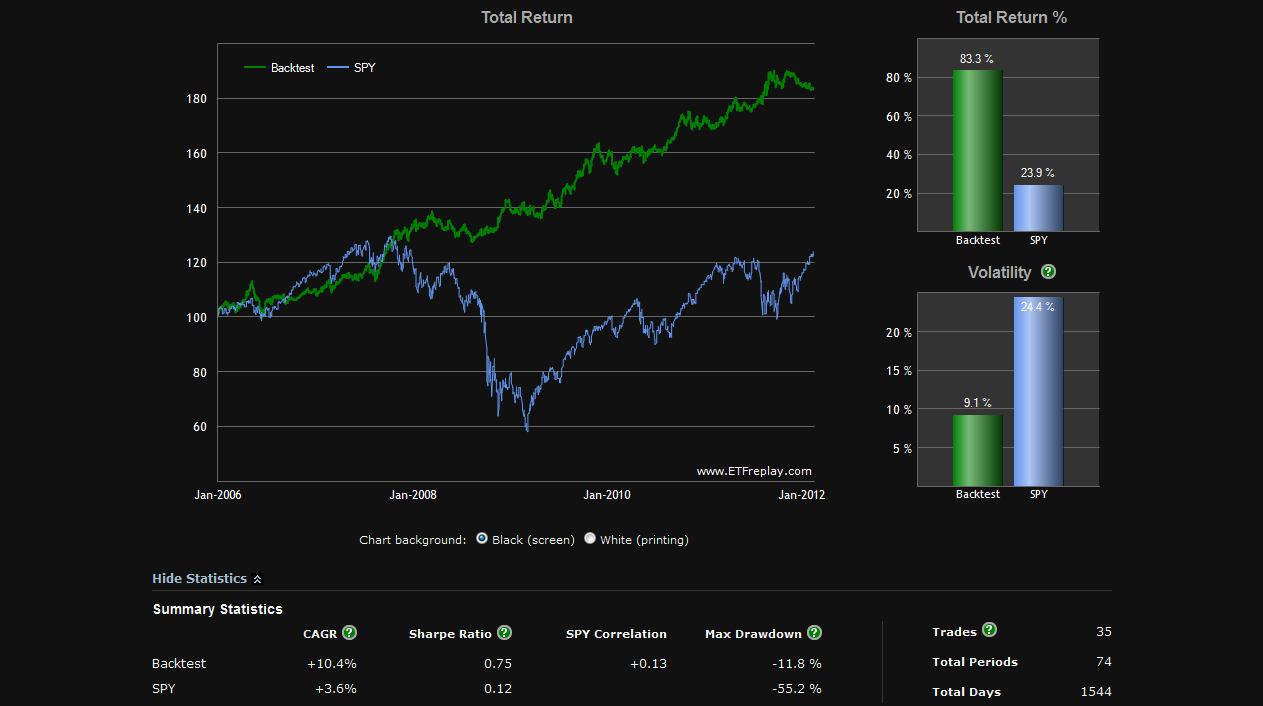
The annual statistics include no losing years (2012 is down year to date):
The table below summarizes the returns of each strategy for comparison purposes: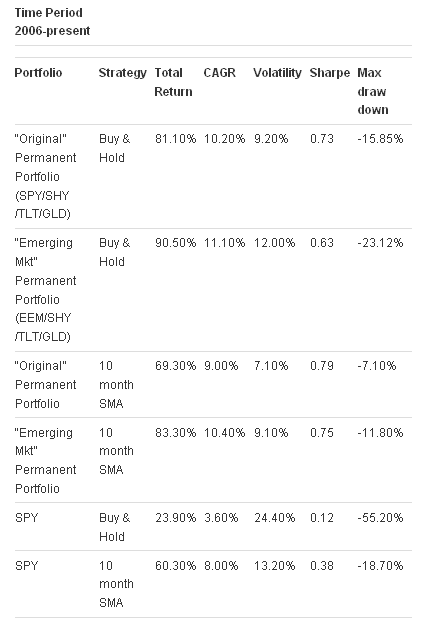
There are some important caveats in these tests. The time period covered is relatively short by historical standards so it is difficult to draw significant conclusions. The period tested includes 2008, a particularly volatile period for equities and fixed income securities. Commissions, taxes, and slippage (the price you would actually get filled at when placing a real order versus the historical data used for the tests) will impact results.
- English (UK)
- English (India)
- English (Canada)
- English (Australia)
- English (South Africa)
- English (Philippines)
- English (Nigeria)
- Deutsch
- Español (España)
- Español (México)
- Français
- Italiano
- Nederlands
- Português (Portugal)
- Polski
- Português (Brasil)
- Русский
- Türkçe
- العربية
- Ελληνικά
- Svenska
- Suomi
- עברית
- 日本語
- 한국어
- 简体中文
- 繁體中文
- Bahasa Indonesia
- Bahasa Melayu
- ไทย
- Tiếng Việt
- हिंदी
Testing the Harry Browne Permanent Portfolio with Emerging Markets
Published 02/19/2012, 01:04 AM
Updated 07/09/2023, 06:31 AM
Testing the Harry Browne Permanent Portfolio with Emerging Markets
Latest comments
Loading next article…
Install Our App
Risk Disclosure: Trading in financial instruments and/or cryptocurrencies involves high risks including the risk of losing some, or all, of your investment amount, and may not be suitable for all investors. Prices of cryptocurrencies are extremely volatile and may be affected by external factors such as financial, regulatory or political events. Trading on margin increases the financial risks.
Before deciding to trade in financial instrument or cryptocurrencies you should be fully informed of the risks and costs associated with trading the financial markets, carefully consider your investment objectives, level of experience, and risk appetite, and seek professional advice where needed.
Fusion Media would like to remind you that the data contained in this website is not necessarily real-time nor accurate. The data and prices on the website are not necessarily provided by any market or exchange, but may be provided by market makers, and so prices may not be accurate and may differ from the actual price at any given market, meaning prices are indicative and not appropriate for trading purposes. Fusion Media and any provider of the data contained in this website will not accept liability for any loss or damage as a result of your trading, or your reliance on the information contained within this website.
It is prohibited to use, store, reproduce, display, modify, transmit or distribute the data contained in this website without the explicit prior written permission of Fusion Media and/or the data provider. All intellectual property rights are reserved by the providers and/or the exchange providing the data contained in this website.
Fusion Media may be compensated by the advertisers that appear on the website, based on your interaction with the advertisements or advertisers.
© 2007-2025 - Fusion Media Limited. All Rights Reserved.
