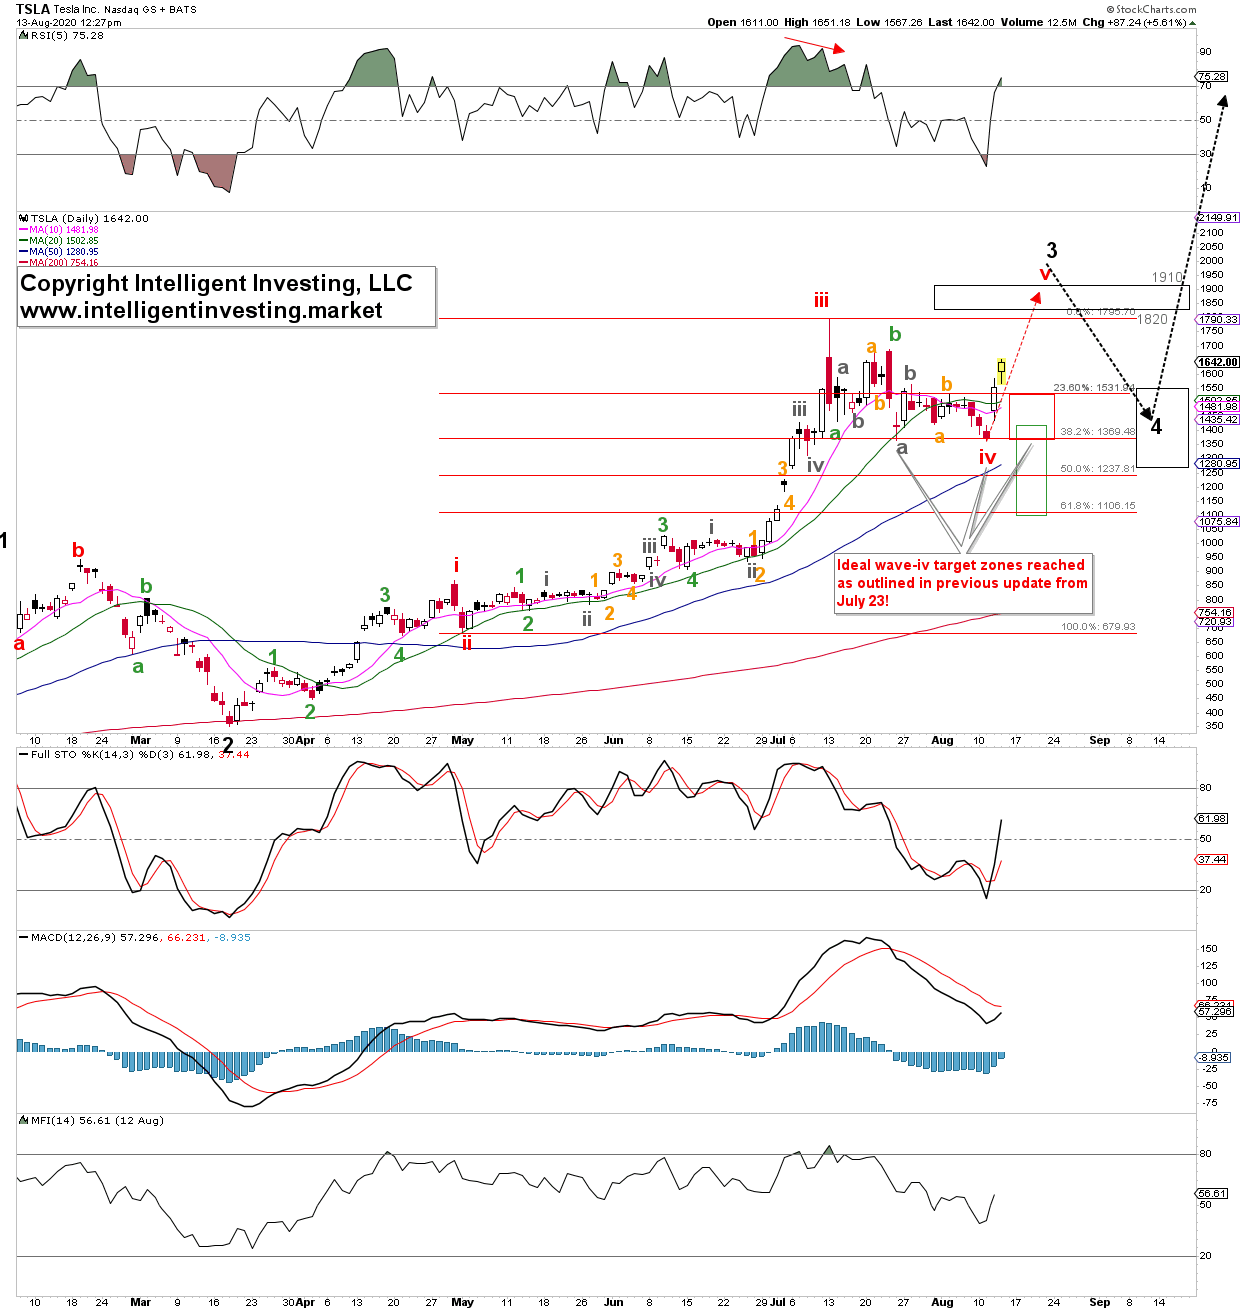
Tesla (NASDAQ:TSLA) stock is “supposedly” rallying on the news of a 5-to-1 stock split. However, in my update of July 23, see here, I already answered the question “What is wrong with Tesla’s stock?” using the Elliott Wave Principle (EWP) and Technical Analyses (TA) and found:
- Tesla is now as overbought and correcting.
- Tesla should now be in (red) wave-iv before moving higher for (red) wave-v to complete the anticipated (black) “wave-3?”.
- Tesla [should] target ideally between $1,369-1,320 for (red) wave-iv before moving higher to new All-time Highs (ATH) for (red) wave-v of (black) wave-3.
Fast forward, and Tesla bottomed, twice, right at the upper end of the ideal target zone, before moving higher. At $1,365 on Aug. 11, and $1,366 on July 24. See Figure 1 below.
In addition, price did what I would call a flat fourth wave correction of the $1,795 all-time high made July 13. The stock retraced almost precisely 38.20% of the entire third wave (red wave-iii) rally. Both the correction pattern and the retrace level are typical for a fourth wave.
Figure 1, TSLA daily chart.

Thus, my analyses from July 23 was correct. Items 1), 2), and 3) have all be checked off. That is the power of the EWP combined with robust TA.
In fact, without knowing this “stock-split-news” on July 23, I already knew with a high degree of certainty what Tesla stock would do over the next few weeks: correct, bottom at around $1,370+/-50, and then rally. I did not need any “news” for that forecast, nor will I ever need any news to forecast the most likely price movement of any stock or index. News is simply a catalyst. For all I care about, the story could have been that Tesla developed an electric-powered yellow submarine. The stock would have rallied also. What matters are the price patterns, Fibonacci-levels, i.e., price levels and recognizing those as being ultimately important. News is noise.
So, what is next?
Recognizing I am always wrong till proven right by the market, and so far, it has proven me right, my analyses are correct as long as the Aug. 11 low at $1,365 holds. In that case, I will be looking for an ideal target of $1,900 where (red) wave-i equals the length of (red) wave-v. This is a typical relationship between 1st and 5th waves in the EWP. Since 5th waves can be shorter or longer, I set a target zone of $1,820-1910. This current wave high will then complete, ideally, a more significant 3rd wave (black wave-3), and we should see Tesla correct once again back to $1,275-1,550 for a larger wave-4, before a last wave-5 rally to new all-time highs.
But let’s not get too far ahead of ourselves, and instead focus on the current uptrend. As usual: know your trading time frame, know your pain level, and never assume anything. Hope is not a profitable strategy.
