- This earnings season, all eyes are on Tesla as investors await their report amid a substantial decline in stock price.
- Analysts are bracing for potentially poor results, with all key metrics projected to decrease year-over-year in Q1 2023.
- With intensifying competition, concerns linger over cost-cutting measures and the company's long-term growth strategy.
- For less than $9 a month, access our AI-powered ProPicks stock selection tool. Learn more here>>
This earnings season is set to feature a flurry of interesting reports, but one company is likely to dominate investor attention: Tesla (NASDAQ:TSLA).
With the stock price down roughly 65% from its highs due to the broader market correction in late 2021, let's delve into what investors should expect from their earnings report and analyze the current situation.
A Flurry of Red Flags?
Analysts are bracing for a potentially poor earnings report. Here's what the current estimates predict:
- Revenues: $22.3 Billion (-4.6% YoY decrease compared to Q1 2023)
- EBITDA: $3.41 Billion (-20.1% YoY decrease compared to Q1 2023)
- EBIT: $1.54 Billion (-42.4% YoY decrease compared to Q1 2023)
- EPS: $0.50 USD (-41.8% YoY decrease compared to Q1 2023)
These projections paint a pessimistic picture, and Elon Musk will need to address several key issues:
- Intensifying Competition: The arrival of Xiaomi (OTC:XIACY)'s new electric car, the SU7, is creating significant headwinds. Priced at $27,000, it's directly challenging Tesla's Model S and has reportedly seen initial demand outstrip supply.
- Cost-Cutting Concerns: Efforts by Musk to reduce staff raise questions about Tesla's long-term commitment to innovation and growth.
Tesla: Fair Value
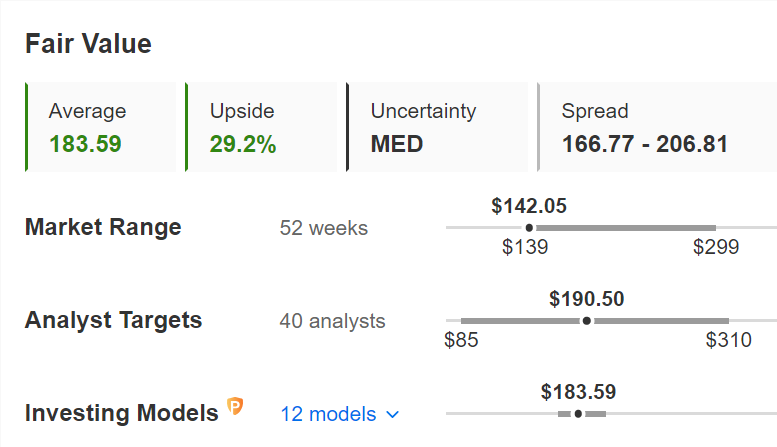
InvestingPro's Fair Value estimates peg Tesla's intrinsic value at just over $183 as of today. However, this value is susceptible to significant drops if the company delivers negative quarterly results or issues concerning forward guidance.
This estimated fair value also aligns closely with the average price target set by analysts who cover Tesla.

Source: InvestingPro
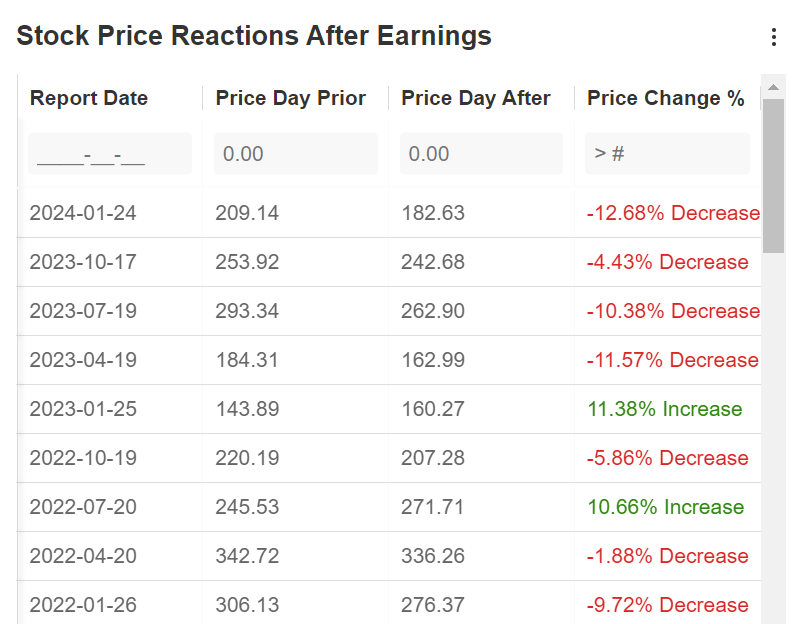
How might the market react? Recent quarters have indeed witnessed a notable shift, with almost every quarterly period in 2021, 2022, and 2023 favoring selling. 
Source: InvestingPro
All that's left is to wait for the markets to close and, as always, observe the outcome. Personally, I view Tesla as a risky stock given the numerous obstacles it faces in the short and medium term.
On a positive note, many investors and analysts currently perceive more risk than opportunity. Therefore, a surprisingly strong and unexpected quarterly performance could result in significant short-term appreciation.
Technical View
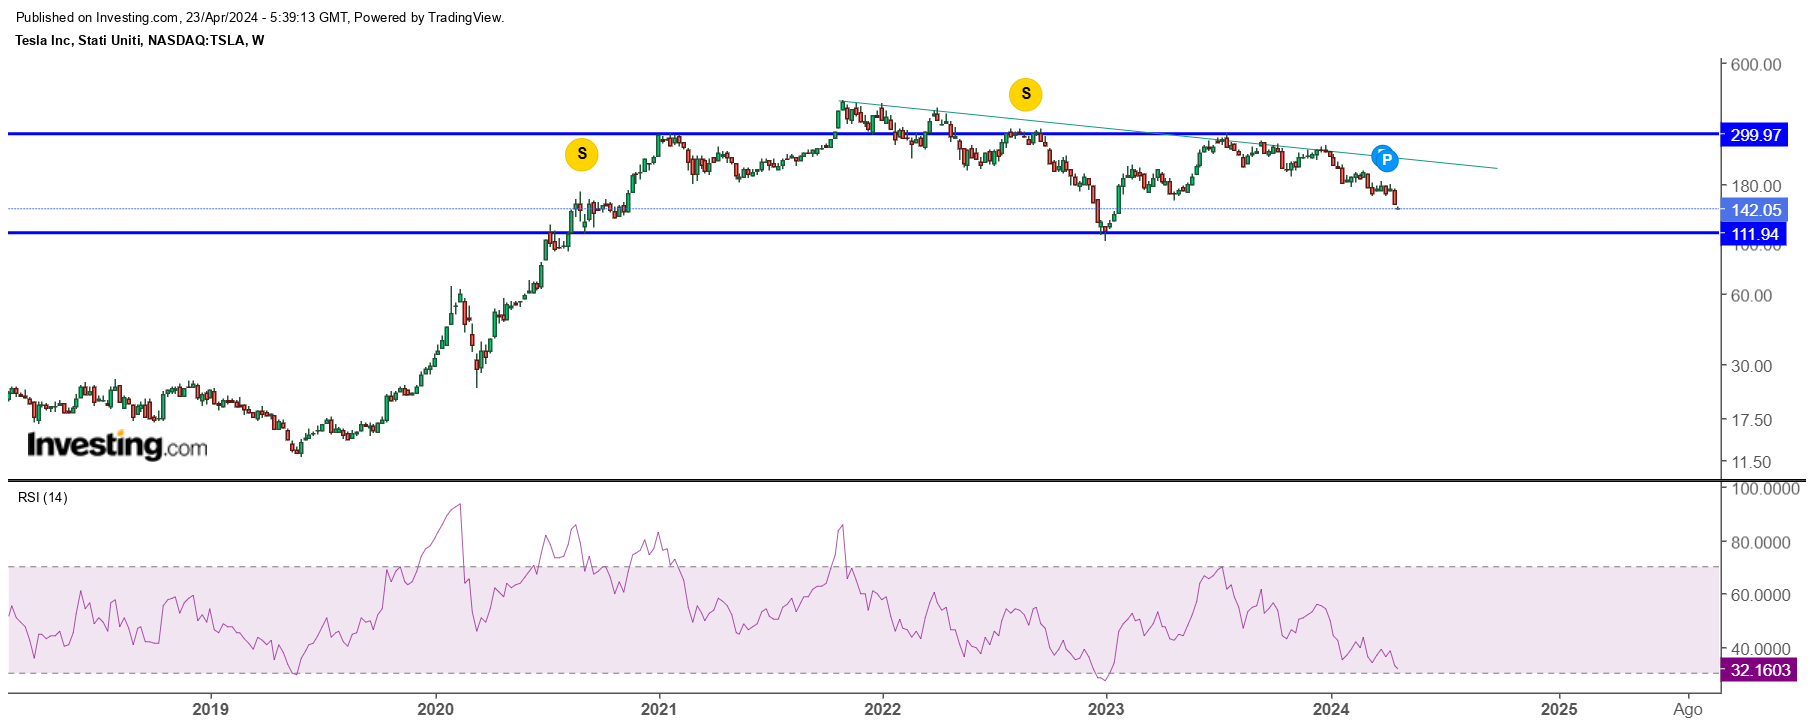
Looking at the charts, we can see that the low, currently serving as potential bearish support, is around the $112 mark.

If we're considering a short position for a negative quarterly outcome, this level could potentially be the target.
Conversely, if things turn out better than anticipated, the initial bullish test might occur around the 30-week moving average on the weekly timeframe, situated at $191.
***
DISCOUNT CODE
Want to deepen and discover the best investment opportunities? Take advantage of a special discount to subscribe to InvestingPro+ and take advantage of all our tools to optimize your investment strategy.
(The link directly calculates and applies the discount of an additional 10%. In case the page does not load, you enter the code proit2024 to activate the offer.)
You will get a number of exclusive tools that will enable you to better cope with the market:
- ProPicks: equity portfolios managed by a fusion of artificial intelligence and human expertise, with proven performance.
- ProTips: digestible information to simplify masses of complex financial data into a few words
- Fair Value and Health Score: 2 synthetic indicators based on financial data that provide immediate insight into the potential and risk of each stock.
- Advanced Stock Screener: Search for the best stocks based on your expectations, taking into account hundreds of financial metrics and indicators.
- Historical financial data for thousands of stocks: So that fundamental analysis professionals can dig into all the details themselves.
- And many more services, not to mention those we plan to add soon!
Disclaimer: This article is written for informational purposes only; it does not constitute a solicitation, offer, advice, counseling or recommendation to invest as such it is not intended to incentivize the purchase of assets in any way. As a reminder, any type of assets, is evaluated from multiple points of view and is highly risky and therefore, any investment decision and the associated risk remains with the investor. The author does not own the stocks mentioned in the analysis.

