Terex Corporation (Terex) is a diversified global equipment manufacturer of a variety of machinery products. Terex is focused on delivering customer-driven solutions for a range of commercial applications, including the construction, infrastructure, quarrying, mining, shipping, transportation, refining, energy and utility industries.
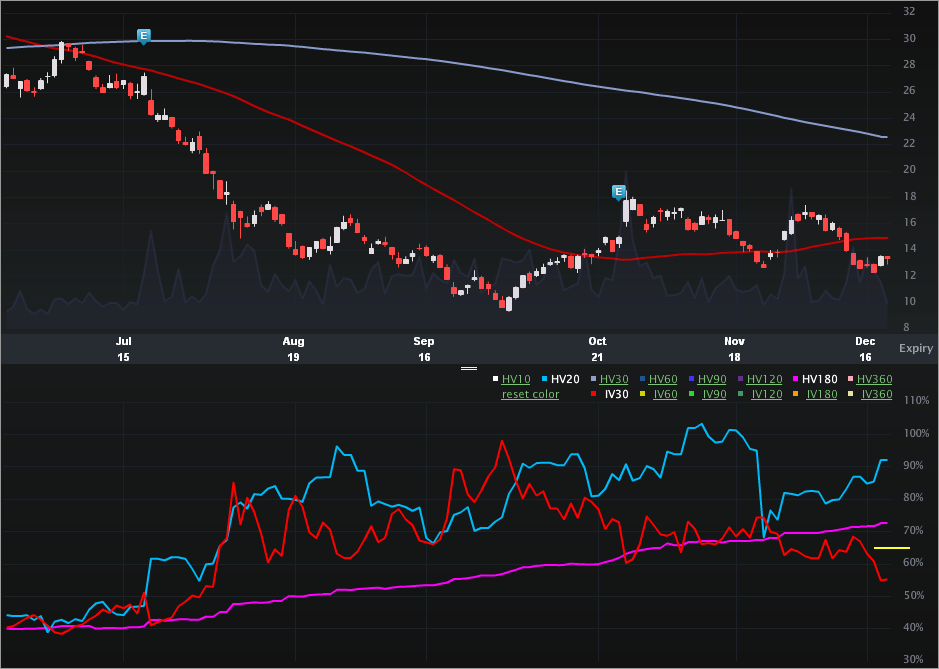
This is another vol note examining depressed implied to historical realized vol and again, this name has earnings approaching. Let's start with the Charts Tab (6 months) is below. The top portion is the stock price, the bottom is the vol (IV30™ - red vs HV20 - blue vs HV180 - pink).
We can see the stock was trading near $30 and is down ~60% to $13.36 in less than six months. On the vol side, we can see how the implied has been diverging from the short-term historical realized vol (HV20) since late Nov. The divergence is more than implied simply falling, but it's in fact the coincidence of implied dropping as the HV20 has risen. In English, the implied vol has been dropping as the stock's actual movement has been rising. As of right now that vol diff is quite large. Specifically:
IV30™: 55.15
HV20: 92.12
HV180: 72.58
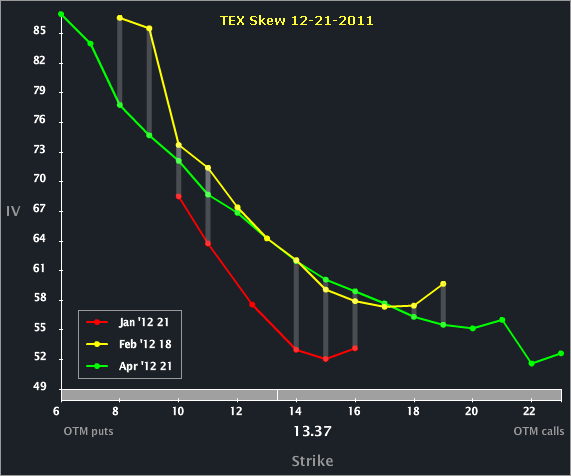
I'll get back to that little yellow line I drew in the vol chart, later. For now, let's turn to the Skew Tab, below.
We can see how Jan vol is depressed relative to Feb and Apr. A part of Jan's lower vol is the inclusion of the Holiday season. But it's not Jan that interests me. The last four years, TEX earnings have been announced on:
2-9-2011
2-17-2010
2-11-2009
2-20-2008
Feb expiry this year is 2-18-2011. Tricky... Even more tricky, check out the earnings dates for the cycle before the Feb release:
10-20-2010
10-21-2009
10-22-2008
10-24-2007
And this year, earnings were released 10-26-2011. Earnings tend to be on Wednesdays for TEX. It seems like the next earnings cycle could be released on either Wednesday 2-15-2012 or Wednesday 2-22-2012. I believe it's that ambiguity that has Feb and Apr options priced to nearly identical vol.
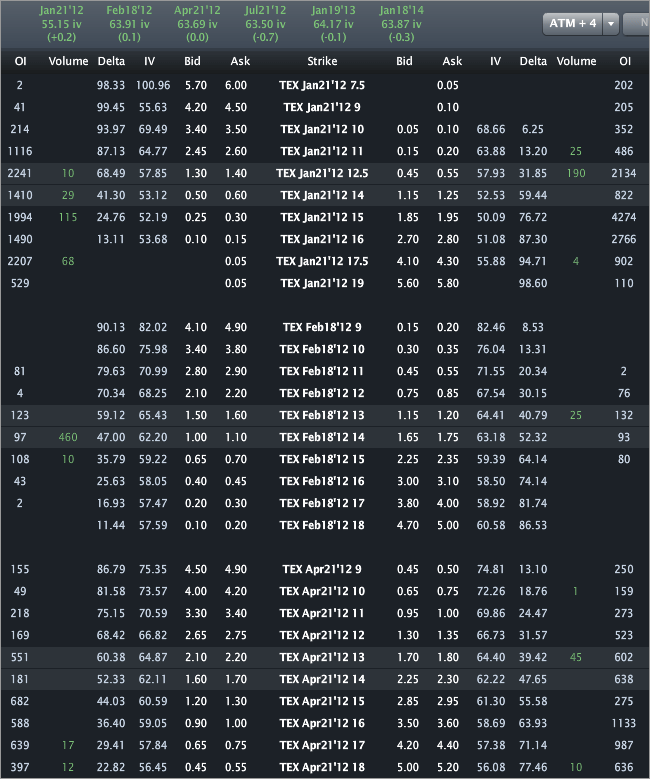
Let's turn to the Options Tab for completeness.
We can see Jan is priced to 55.15 vol, while Feb is priced to 63.91 and Apr to 63.50. Back to the Charts Tab -- that ~63iv level is the yellow mark on the chart. Looking back to the vol comps, we can see that even that level is depressed to the HV20 and HV180. Of course, we don't know what those measures will be in two months, but for now, it's... interesting.
This is trade analysis, not a recommendation.
- English (UK)
- English (India)
- English (Canada)
- English (Australia)
- English (South Africa)
- English (Philippines)
- English (Nigeria)
- Deutsch
- Español (España)
- Español (México)
- Français
- Italiano
- Nederlands
- Português (Portugal)
- Polski
- Português (Brasil)
- Русский
- Türkçe
- العربية
- Ελληνικά
- Svenska
- Suomi
- עברית
- 日本語
- 한국어
- 简体中文
- 繁體中文
- Bahasa Indonesia
- Bahasa Melayu
- ไทย
- Tiếng Việt
- हिंदी
Terex (TEX) - Depressed Vol, Earnings Date Ambiguity Priced in Skew
Published 12/22/2011, 02:57 AM
Updated 07/09/2023, 06:31 AM
Terex (TEX) - Depressed Vol, Earnings Date Ambiguity Priced in Skew
Latest comments
Loading next article…
Install Our App
Risk Disclosure: Trading in financial instruments and/or cryptocurrencies involves high risks including the risk of losing some, or all, of your investment amount, and may not be suitable for all investors. Prices of cryptocurrencies are extremely volatile and may be affected by external factors such as financial, regulatory or political events. Trading on margin increases the financial risks.
Before deciding to trade in financial instrument or cryptocurrencies you should be fully informed of the risks and costs associated with trading the financial markets, carefully consider your investment objectives, level of experience, and risk appetite, and seek professional advice where needed.
Fusion Media would like to remind you that the data contained in this website is not necessarily real-time nor accurate. The data and prices on the website are not necessarily provided by any market or exchange, but may be provided by market makers, and so prices may not be accurate and may differ from the actual price at any given market, meaning prices are indicative and not appropriate for trading purposes. Fusion Media and any provider of the data contained in this website will not accept liability for any loss or damage as a result of your trading, or your reliance on the information contained within this website.
It is prohibited to use, store, reproduce, display, modify, transmit or distribute the data contained in this website without the explicit prior written permission of Fusion Media and/or the data provider. All intellectual property rights are reserved by the providers and/or the exchange providing the data contained in this website.
Fusion Media may be compensated by the advertisers that appear on the website, based on your interaction with the advertisements or advertisers.
© 2007-2025 - Fusion Media Limited. All Rights Reserved.
