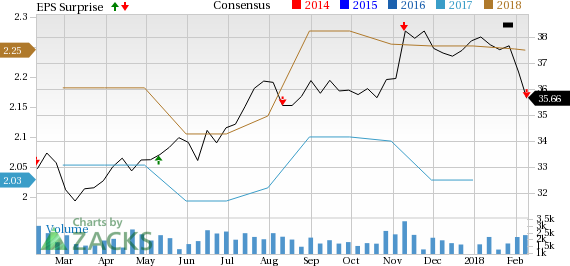
TELUS Corp. (NYSE:TU) reported mixed results in fourth-quarter 2017, with the bottom line missing the Zacks Consensus Estimate and the top line beating the same.
TELUS carries a Zacks Rank #3 (Hold). You can see the complete list of today’s Zacks #1 Rank (Strong Buy) stocks here.
Net income on a GAAP basis was approximately $221.15 million or 47 cents per share compared with $63.75 million or 14 cents in the prior-year quarter. The fourth-quarter adjusted earnings of 43 cents missed the Zacks Consensus Estimate of 45 cents.
Total revenues were approximately $2,730 million, up 10.27% year over year and above the Zacks Consensus Estimate of $2,727 million. Service revenues were $2,507.38 million, up 3.5% year over year. Equipment revenues totaled $170.78 million, up 3.8% year over year. Other revenues were $50.37 million.
Quarterly operating income was $439.93 million, up 136.9% year over year. Adjusted EBITDA (earnings before interest, tax, depreciation and amortization) was $916.07 million, up 4.7% year over year. Quarterly-adjusted EBITDA margin was 33.8% compared with 33.7% in the year-ago quarter.
Cash Flow & Liquidity
In fourth-quarter 2017, TELUS generated approximately $770.47 million of cash from operations, up 33.7% year over year. Free cash flow was $215.64 million against a negative flow of $150.32 million in the prior-year quarter.
In the quarter under review, the company had cash and temporary investments of $400.58 million, up from $339.98 million at the end of 2016. Long-term debt was $9,645.47 million compared with $9,132.35 million at the end of 2016.
Segmental Results
Wireless revenues increased 6.8% year over year to approximately $1,559.83 million in the reported quarter. Wireless network revenues increased 5.4% to $1,394.56 million. Equipment and other service revenues were approximately $133 million, up 9.0% year over year. Inter-service network revenues were $7.87 million, down 33.3% year over year.
Adjusted EBITDA of $562.71 million increased 5% from the prior-year quarter’s figure. Quarterly adjusted EBITDA margin was 36.4% compared with 36.7% in the year-ago quarter. Wireless capital expenditures declined 6.4% to $183.37 million.
Blended ARPU inched up 1.6% to $52.94. Monthly postpaid subscriber churn increased 1 basis point (bps) year over year to 0.99%. Blended monthly churn declined 2 bps to 1.23%, indicating an increase in the mix of postpaid versus prepaid subscribers.
In the reported quarter, the company gained 8,911,000 total wireless connections (up 3.8% y/y), which include 7,978,000 postpaid (up 5.7%) and 933,000 prepaid (down 9.9%) connections. Wireless net additions of 98,000 include postpaid net additions of 121,000, while losing a net of 23,000 prepaid connections due to increased competition.
Wireline revenues increased 2% to $1,216.70 million. Data service & equipment revenues were $876.72 million, up 6%. Voice revenues were $231.38 million, down 13.5%. Other services and equipment revenues were $42.49 million, down 11.5% year over year. Other operational revenues were approximately $25.97 million. Inter-service revenues grossed around $40.14 million, flat year over year.
Adjusted EBITDA of $353.36 million increased 4.3% from the prior-year quarter’s figure. Quarterly adjusted EBITDA margin was 29.1% compared with 28.5% in the year-ago quarter. Wireline capital expenditures declined 7.2% to $398.22 million.
In the reported quarter, TELUS had 4,139,000 total wireline subscribers (up 1.2% y/y), 1,098,000 total TELUS TV connections (up 3.7%), 1,743,000 High-speed Internet connections (up 5.3%) and 1,298,000 Residential network access lines (NALs) (down 5.5%). The company gained a net of 21,000 Wireline connections which include 14,000 TELUS TV connections and 21,000 High-speed Internet connections. However, the company lost 14,000 Residential network access lines. The persistent NAL losses indicate the shift to wireless and Internet-based services as well as increased competition.
Dividend Hike
TELUS’ board of directors declared a quarterly dividend of C$0.5050 per share on issued and outstanding common shares. The dividend will be paid on Apr 2, 2018, to shareholders of record as of Mar 9, 2018.
2018 Financial Targets
TELUS provided its consolidated financial targets for 2018.
For 2018, TELUS projects revenue increase of 4-6% to the range of $13.835-$14.100 billion. Adjusted EBITDA is expected in the range of $5.105-$5.230 billion, higher by 4-7%. Basic earnings per share (EPS) are expected to increase 3-9% to $2.53-$2.68.Consolidated capital expenditures for 2018 (excluding the purchase of spectrum licenses) are estimated at approximately $2.85 billion. The company’s cash income tax payments for the full year are estimated in the range of $170-$230 million, consistent with the year-ago level of $191 million.
The aforementioned targets reflect persistent growth in data services across both wireless and wireline, supported by strategic investments in advanced broadband technologies and leading networks. Further, the company is backed by multi-year dividend growth schemes, since May 2011. Till now, the company has announced 14 dividend hikes.
In 2018, TELUS plans to continue generating positive subscriber growth in its key growth segments, including wireless, high-speed Internet and TELUS TV. Increasing customer demand for reliable access and fast-data services are expected to support continued customer growth. TELUS International and TELUS Health are expected to contribute to the company’s growth profile, organically and from recent acquisitions.
Headwinds
TELUS faces fierce competition in the wireless and wireline segment. In the wireless segment, it competes against the likes of Rogers Communications (NYSE:RCI) and BCE Inc.’s (TO:BCE) subsidiary, Bell Canada, followed by threats from small regional carriers like MTS in Manitoba and SaskTel in Saskatchewan. The wireline segment faces threats from cable-TV operators, such as Shaw Communications (NYSE:SJR) .
The Hottest Tech Mega-Trend of All
Last year, it generated $8 billion in global revenues. By 2020, it's predicted to blast through the roof to $47 billion. Famed investor Mark Cuban says it will produce "the world's first trillionaires," but that should still leave plenty of money for regular investors who make the right trades early.
See Zacks' 3 Best Stocks to Play This Trend >>
TELUS Corporation (TU): Free Stock Analysis Report
BCE, Inc. (BCE): Free Stock Analysis Report
Shaw Communications Inc. (SJR): Free Stock Analysis Report
Rogers Communication, Inc. (RCI): Free Stock Analysis Report
Original post
Zacks Investment Research

