I'm going to try and blog more (post charts for my own amusement) about Crude Oil and Gold futures. There is plenty I don't know about these markets, but this is the beginning of my intention to follow them more closely.
The charts I'll post and the arrow indications on them should be considered "PAPER TRADES" as I do not yet trade real money, live, in these instruments. My approach to them will be very similar to the charts I post in the SPY intraday -- two time frames with an indication of the long-, intermediate- and short- term trends.
Crude Oil: (contract specifications here).
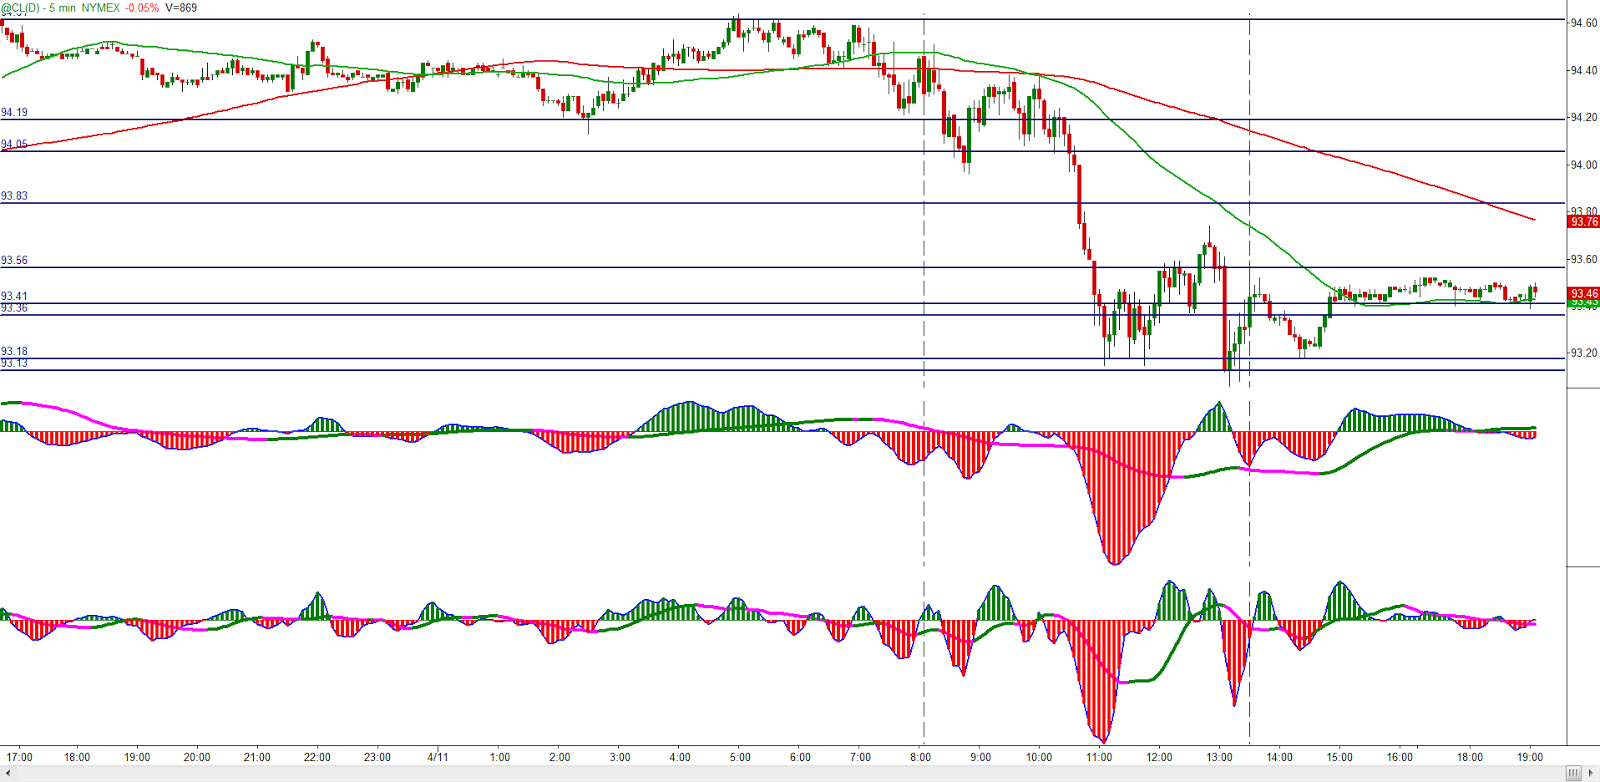
Pre-market (5-minute time frame, top indicator is the higher time frame (15-min) 3/10macd, bottom indicator is the 5-min 3/10macd). Vertical dash line is the Open and horizontal lines are untested (up until the Regular Trading Hours opening session) S/R levels:
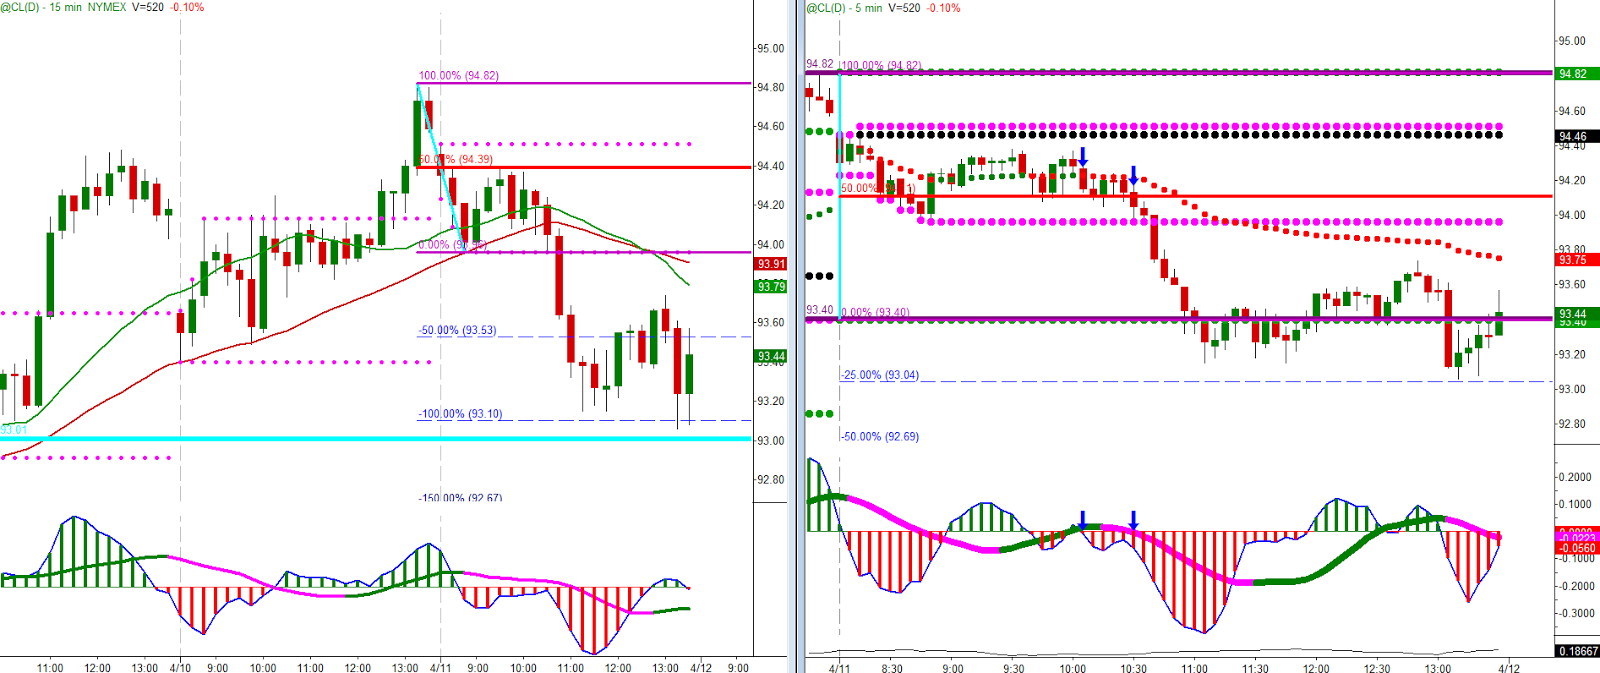
"Open Outcry" session: Arrows indicate potential trade opportunities.
Gold: (contract specs here).
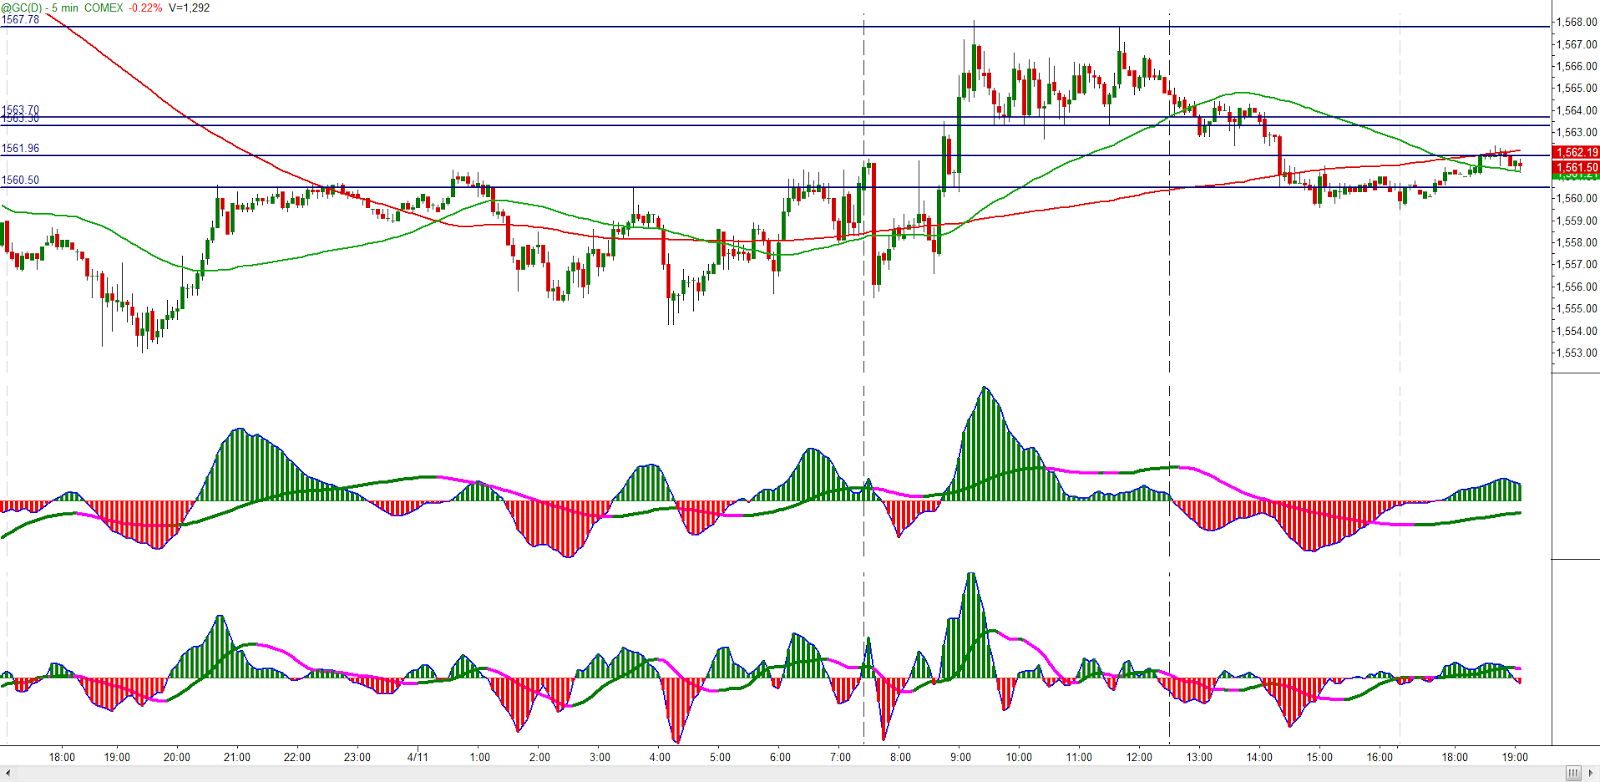
Overnight market
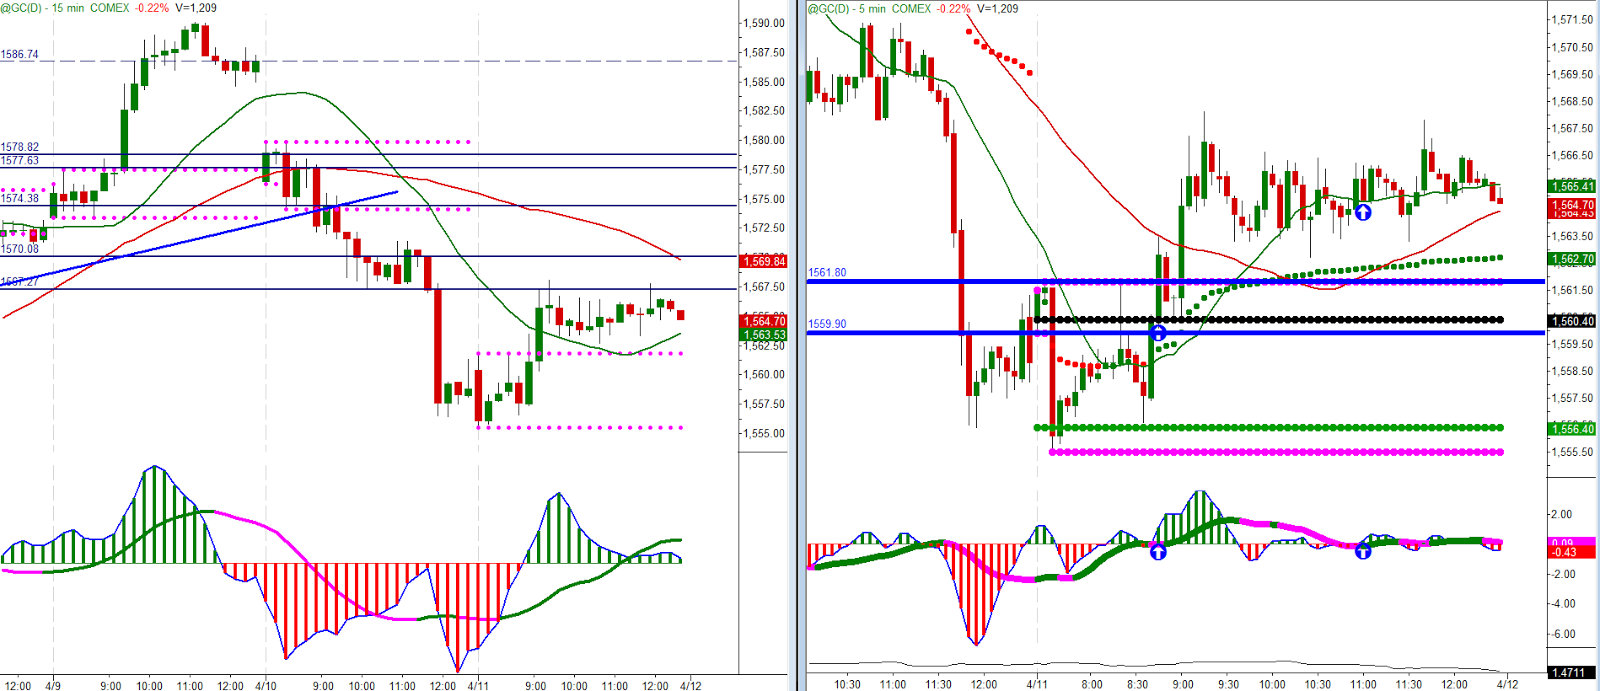
Regular Trading Hours:
- English (UK)
- English (India)
- English (Canada)
- English (Australia)
- English (South Africa)
- English (Philippines)
- English (Nigeria)
- Deutsch
- Español (España)
- Español (México)
- Français
- Italiano
- Nederlands
- Português (Portugal)
- Polski
- Português (Brasil)
- Русский
- Türkçe
- العربية
- Ελληνικά
- Svenska
- Suomi
- עברית
- 日本語
- 한국어
- 简体中文
- 繁體中文
- Bahasa Indonesia
- Bahasa Melayu
- ไทย
- Tiếng Việt
- हिंदी
Technicals On Gold And Crude
Latest comments
Loading next article…
Install Our App
Risk Disclosure: Trading in financial instruments and/or cryptocurrencies involves high risks including the risk of losing some, or all, of your investment amount, and may not be suitable for all investors. Prices of cryptocurrencies are extremely volatile and may be affected by external factors such as financial, regulatory or political events. Trading on margin increases the financial risks.
Before deciding to trade in financial instrument or cryptocurrencies you should be fully informed of the risks and costs associated with trading the financial markets, carefully consider your investment objectives, level of experience, and risk appetite, and seek professional advice where needed.
Fusion Media would like to remind you that the data contained in this website is not necessarily real-time nor accurate. The data and prices on the website are not necessarily provided by any market or exchange, but may be provided by market makers, and so prices may not be accurate and may differ from the actual price at any given market, meaning prices are indicative and not appropriate for trading purposes. Fusion Media and any provider of the data contained in this website will not accept liability for any loss or damage as a result of your trading, or your reliance on the information contained within this website.
It is prohibited to use, store, reproduce, display, modify, transmit or distribute the data contained in this website without the explicit prior written permission of Fusion Media and/or the data provider. All intellectual property rights are reserved by the providers and/or the exchange providing the data contained in this website.
Fusion Media may be compensated by the advertisers that appear on the website, based on your interaction with the advertisements or advertisers.
© 2007-2025 - Fusion Media Limited. All Rights Reserved.
