Key Points:
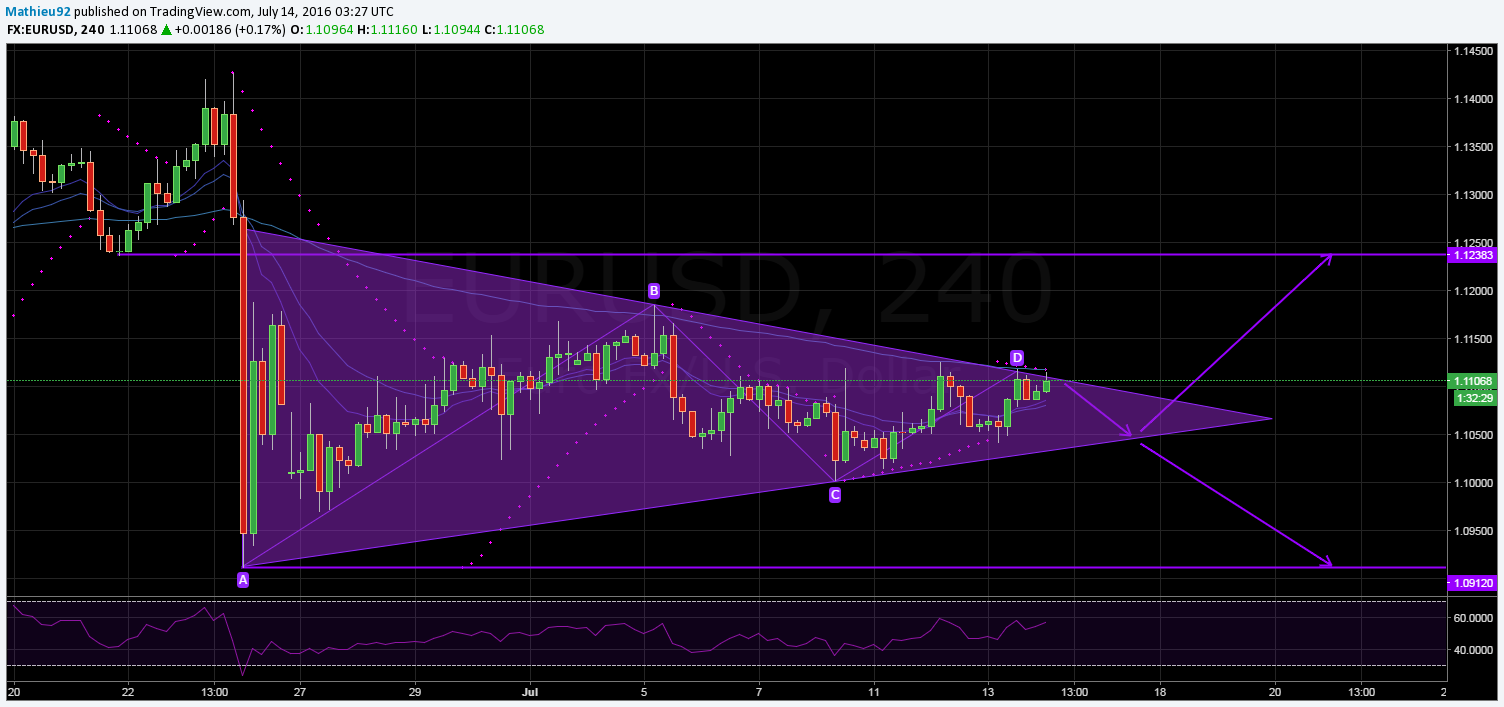
- Symmetrical Triangle pattern coming to an end.
- Technical indicators remain strongly bearish.
- Downside breakout could see the 1.0912 support challenged
After a relatively lengthy period of consolidation, the EUR/USD could finally be setting up to rally back to pre-Brexit price levels. Indeed, there is currently an overwhelming bias in the Commitment of Traders report towards the long side.
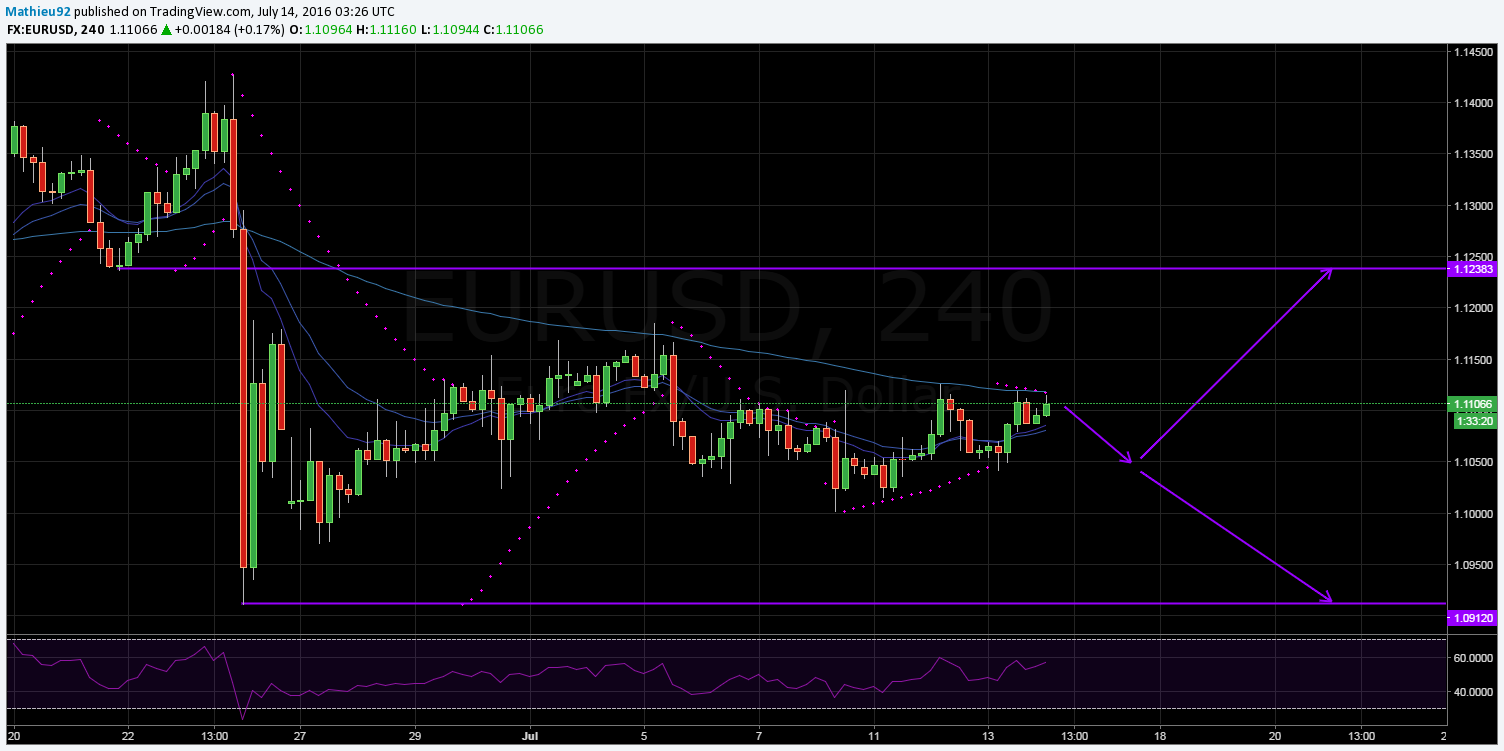
However, the issue may not be as cut and dry as this and, as a result, it is worth looking at a number of other technicals to confirm whether the EUR will, in fact, seek out the 1.1238 handle or sink lower.
Firstly, as is demonstrable on the H4 chart, the pair is nearing the end of a consolidating phase which should see the euro breakout in the near future. Specifically, the pair’s Bollinger Bands are continuing to narrow which is a fairly solid sign that something is about to give.
However, there will likely be at least one more retracement before the EUR escapes the confines of the triangle formation. Primarily, this comes as a result of the bearish H4 Parabolic SAR readings supplying resistance as the RSI is not presently showing any sort of bias.

Whilst it remains relatively clear that the pair is nearing the end of its neutral phase, exactly which way the euro is going to breakout remains uncertain. By virtue of the symmetrical triangle pattern, the EUR/USD could certainly rally higher or slide lower once the integrity of the triangle has been compromised.
Again, neither RSI nor the Stochastics are providing any strong indication that the pair is predisposed to go in any particular direction. What’s more, unlike the cable, the euro is by no means at its lowest point which gives it plenty of room to move to the downside.
Furthermore, despite the strong bias evident in the COT report, the technicals are actually signalling that a tumble could be the more likely scenario. Namely, daily EMA activity is yet to switch from its strongly bearish configuration which could continue to exert downward pressure on the EUR.
In addition to the EMA activity, the daily Parabolic SAR is also highly bearish which certainly casts doubt on the likelihood of a strong rally.

Ultimately, there remains a significant role for fundamentals to play by the end of the trading week and they could go a long way in influencing the pair’s movements. Strong postings in the veritable flood of US indicators due over the next two days will almost guarantee a slip for the pair.
Conversely, a spate of particularly poor results could see the EUR surge as the week comes to a close. However, in the absence of any particular trend in the results, technicals are certainly suggesting that a slip could be on the cards.
