In this past weekend’s newsletter, I covered the current technical position of oil/energy-related investments and the recent bear-market rally. The latter is most relevant to today’s discussion on bonds.
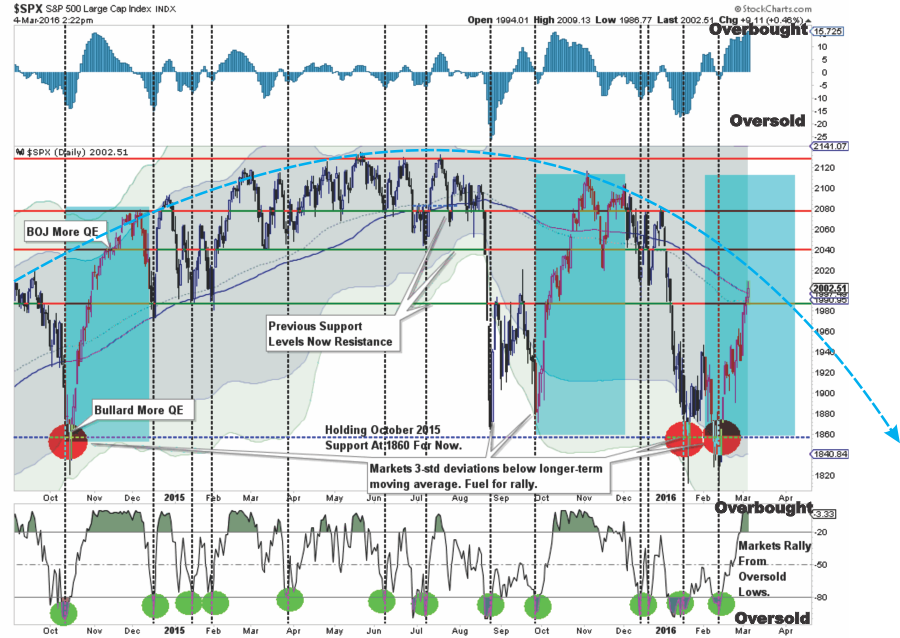
As I have stated before, when the market re-establishes a positive trend, I will recommend putting preserved capital back to work. However, for such an equity increase to be warranted, the market will need to break the current declining price trend and work off some of the currently extreme overbought conditions. This is shown in the updated chart from last week.
There are quite a few moving pieces here, so let me explain.
- The shaded areas represent 2 and 3-standard deviations of price movement from the 125-day moving average. I am using a longer-term moving average here to represent more extreme price extensions of the index. The last 4 times prices were 3-standard deviations below the moving average, the subsequent rallies were very sharp as short positions were forced to cover.
- The top and bottom of the chart show the overbought/sold conditions of the market. The recent rally has responded as expected from recent oversold conditions. With the oversold condition now exhausted, the potential for further upside has been greatly reduced.
- The easiest path for prices continues to be lower as downward resistance continues to be built. The arching dashed blue line shows the change of overall advancing to now declining price trends.
The last sentence above is the most important. The signal to increase equity related exposure in portfolios will require a breakout above the currently negative price trend. Until that happens, we remain confined in a ‘bear’ market.
With the markets now struggling to gain ground as the “first-of-the-month” buying frenzy begins to fade, the question is now whether the next decline retests, or breaks, recent lows OR establishes a higher bottom to begin building a more bullish case from.
However, until the more bullish case can be built and confirmed, it is important to reiterate the most basic rules of portfolio management:
- In rising market trends – buy dips.
- In declining market trends – sell rallies.
What does this have to do with bonds? Good question.
Bonds remain a true diversifier within a portfolio by providing a return of principal function (if you own individual bonds), an inverse correlation to the financial markets and an income stream derived from the interest payments. This is why over the long term a bond/stock portfolio will outperform a stock only allocation.
BONDS OVERSOLD?
In June of 2013, when the cries of the “death of the bond bull market” were rampant, I made repeated calls that then was an ideal time to be a “buyer” of bonds.
However, the recent spike in interest rates has certainly caught everyone’s attention and begs the question is whether the 30-year bond bull market has indeed seen its inevitable end. I do not think this is the case and, from a portfolio management perspective, I believe this is a prime opportunity to increase fixed income holdings in portfolios.
As shown in the chart below, this was the correct call and, despite repeated wrong calls by the mainstream analysts, bonds remain in an ongoing bullish trend.
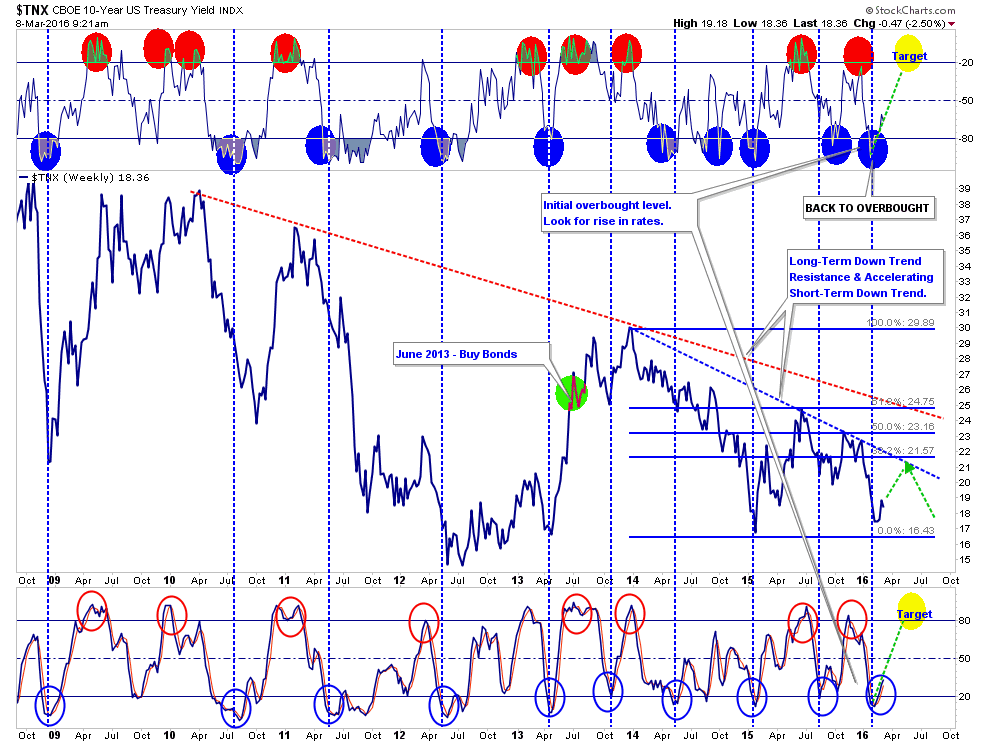
Since interest rates are the inverse of bond prices, we can look at a long-term chart of rates to determine when bonds are overbought or oversold. Currently, following the market’s slide from the beginning of the year, interest rates, while having up-ticked slightly over the last couple of weeks, remain oversold.
This suggests that the most likely target for rates in the near term could be as high as 2.0% from the current levels of 1.83%. While .17% doesn’t sound like a much of a move in rates such an increase back to the long-term downtrend will push rates from their current “oversold” condition back to “overbought.” This will provide the best opportunity to add to bond exposure back into portfolios.
The same is confirmed by the very long-term chart (50 years) of 10-year interest rates overlaid with a 7-year moving average.
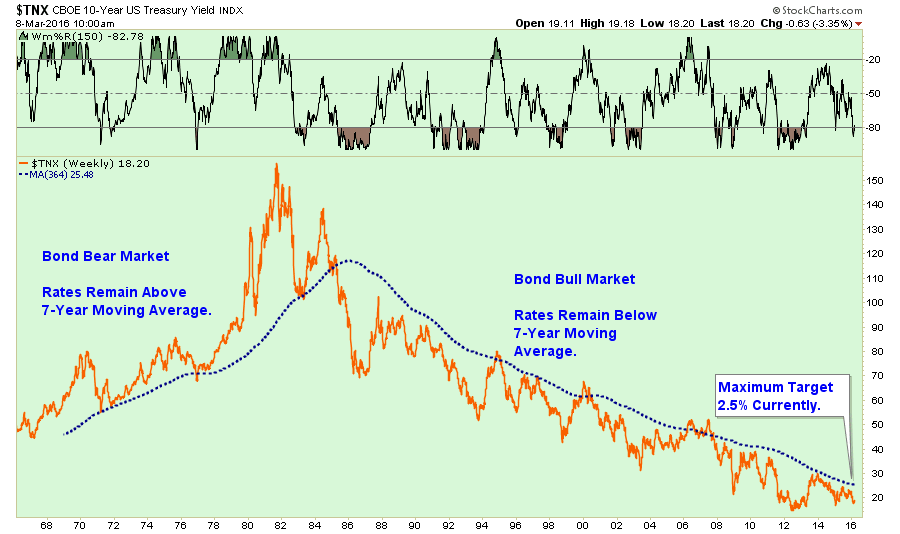
As you will note, “Bond Bear Markets” exist when rates are rising, due to accelerating economic growth, and remain above their 7-year moving average which is in an uptrend. The opposite occurs during “Bond Bear Markets.”
The economic comparison is more clearly shown in the chart below, which shows the Wage/GDP/Inflation Composite Index as compared to 10-year interest rates.
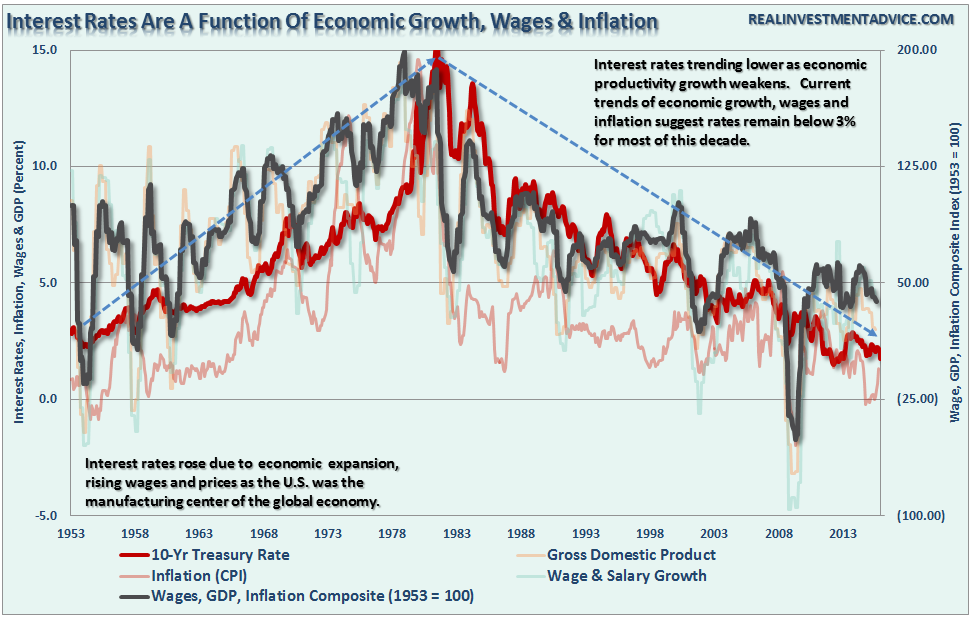
With the composite index once again on the decline, it is unlikely that the current move higher in rates will last very long. Why? Because interest rates are the “blood” in the veins of the economy.
Let me explain the importance of rates on everything.
PEOPLE DON’T BUY HOUSES
People don’t buy houses or cars. They buy payments. Payments are a function of interest rates and when interest rates rise sharply mortgage activity falls as payments rise above expectations. In an economy where roughly 70% of American’s have little or no savings, an adjustment higher in payments significantly impacts family budgets.
Currently, economic activity would be far worse than it is currently if it wasn’t for the surging increase in low/no money down loans, zero-percent interest plans for 60 months and the ability to qualify with sub-prime credit. While these are the same “WMD’s” that led to the last financial crisis, lessons were not learned as the need to generate sales once again exceeds the grasp of logic.
But here are more reasons why the “Great Bond Bull Market” is not dead yet:
1) Rising interest rates raise the debt servicing requirements which reduces future productive investment.
2) As stated above, rising interest rates will immediately slow the housing market taking that small contribution to the economy away. People buy payments, not houses, and rising rates mean higher payments.
3) An increase in interest rates means higher borrowing costs which leads to lower profit margins for corporations. This will negatively impact corporate earnings and the financial markets.
4) One of the main arguments of stock bulls over the last 5-years has been that stocks are cheap based on low interest rates. When rates rise the markets become overvalued very quickly.
5) The massive derivatives and credit markets will be negatively impacted. Much of the recovery to date has been based on suppressing interest rates to spur growth.
6) As rates increase so does the variable rate interest payments on credit cards. With the consumer being impacted by stagnant wages and increased taxes, higher credit payments will lead to a rapid contraction in income and rising defaults.
7) Rising defaults on debt service will negatively impact banks which are still not adequately capitalized and still burdened by large levels of bad debts.
8) Many corporate share buyback plans and dividend issuances have been done through the use of cheap debt, which has led to increases corporate balance sheet leverage. This will end.
9) Corporate capital expenditures are dependent on borrowing costs. Higher borrowing costs leads to lower CapEx.
10) The deficit/GDP ratio will begin to soar as borrowing costs rise sharply. The many forecasts for lower future deficits will crumble as new forecasts begin to propel higher.
I could go on, but you get the idea.
BOND BUYING OPPORTUNITY COMING
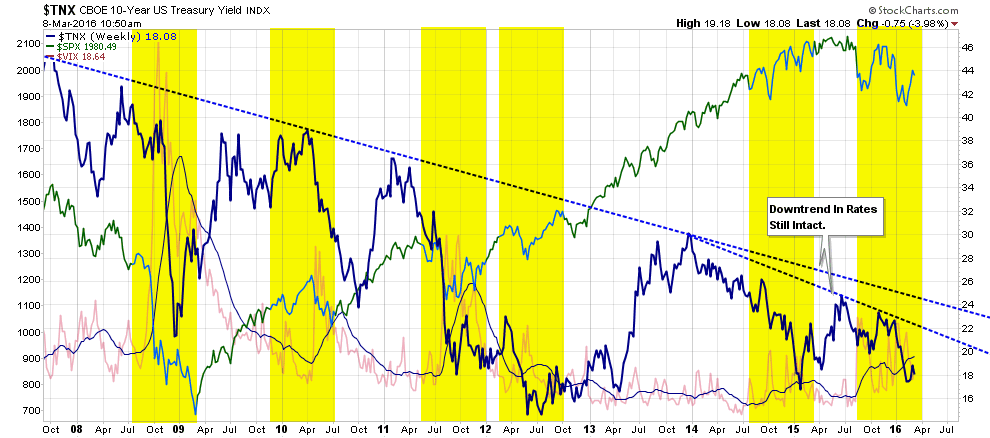
While bond prices currently remain overbought, such a condition will likely not last very long. As shown below, markets and volatility have an inverse relationship with rates, hence the non-correlation for portfolios. The rising trend of volatility currently corresponds with the decline in markets and the rise in bond prices.
This analysis also suggests that the current correction in stocks is likely not over as of yet in the longer term. However, in the very short-term, the current oversold condition in rates suggests that the current “bear market rally” could last through the month of March. Such would not be surprising following a rather brutal first two months of the year.
However, as we approach summer, the seasonal weakness of the markets will likely resurface and bonds will once again become a safe haven for investors against further market declines.

