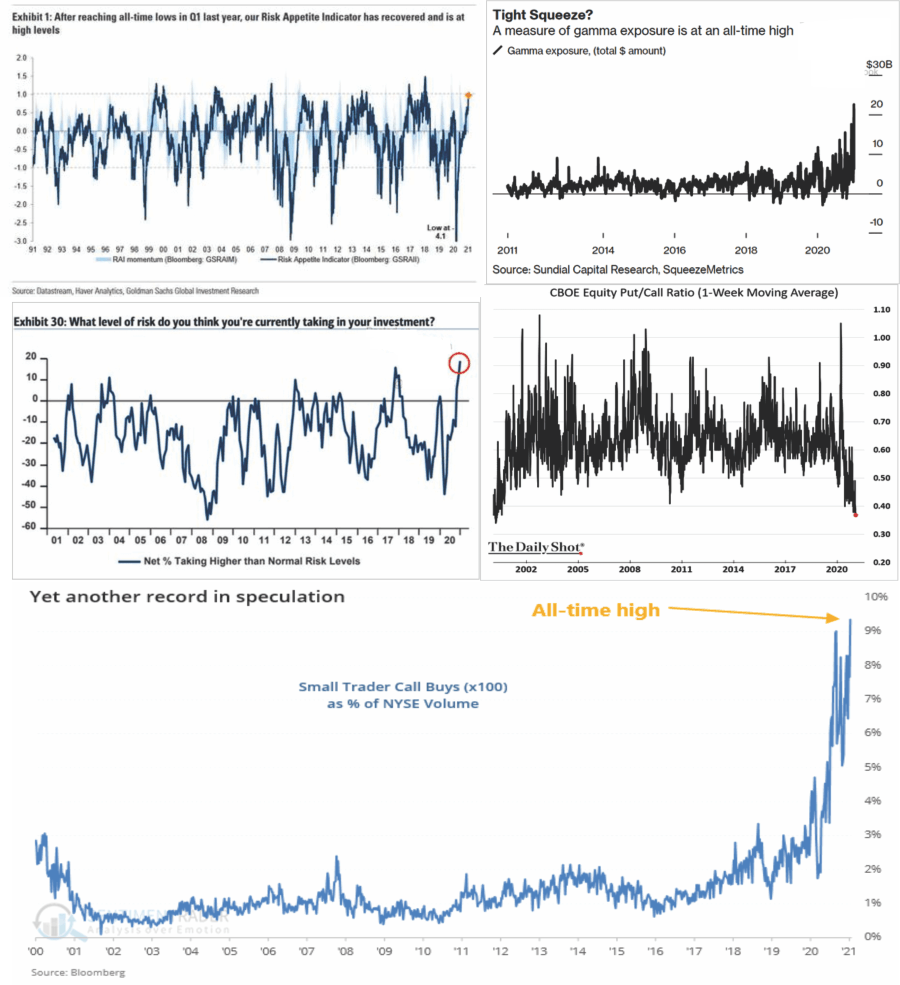
During the last few weeks, I have discussed the rising levels of exuberance in the markets.
On Friday, I tweeted the following:
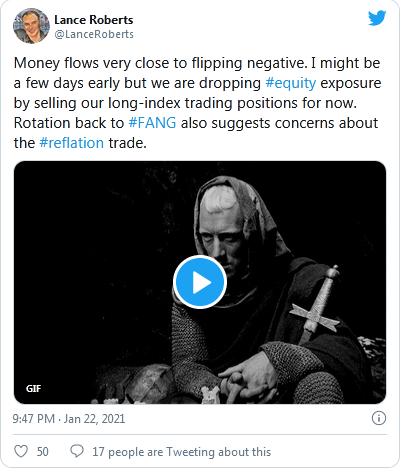
Not surprisingly, I received more than a few emails chastising me for “bailing on the bull market, which is going higher.”
Such is hardly the case. We reduced our weighting in our “indexed” positions, which we use for overweighting equity allocations during short-term bullish advances. Even though we took gains in our index positions, we remain primarily long-biased in our equity and ETF portfolios. However, given the extreme technical overbought and deviated conditions, it was prudent to raise some cash and protect our gains.
When Everyone Agrees
However, it wasn’t just the conditions we discussed which have us concerned about the markets in the short term. Investor positioning has also reached rather extreme levels. As Bob Farrell once wrote:
“When all experts agree, something else is bound to happen.”
Currently, with investor’s extremely long equity exposure, the risk of a correction has become more elevated.
If these extremes don’t ring some alarm bells, I am not sure exactly what will.
Importantly, while we are reducing risk now, such doesn’t mean the exuberance in the market can’t continue over the next few days to several weeks. Many will suggest our actions were wrong if the markets continue to rise, and we missed out.
Such could undoubtedly be the case. However, I will remind you that we wrote much the same in January 2020. Over the next few weeks, it appeared we were very wrong until we weren’t.
That is just the way markets work.
Investors Are All In
As we discussed previously, following an actual “bear market,” investors are very slow to return to the market. Following the “Dot.com” crash, it took several years before investors returned their allocation levels to “fully allocated” levels. The same occurred following the “Financial Crisis.”
However, following the March decline, investors quickly allocated back into equities, which coincides with corrections rather than bear markets. Currently, both individual and professional investors are “back in the pool.”
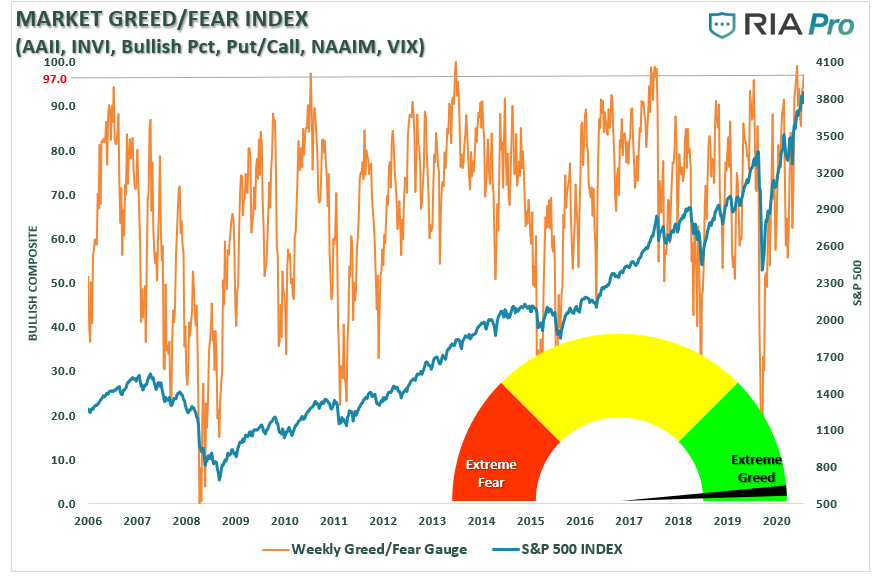
The index below compiles investor positioning in the financial markets. The most current reading, which includes individual and professional managers’ equity exposure, is 97 out of a possible 100. Since 2006 such a level has only been reached three times previously: 2010, 2013, and 2018. In all three cases, the markets were lower within a few weeks to several months later. However, in each case volatility picked up markedly while returns were minimal.
In other words, reducing risk in advance didn’t cost you much.
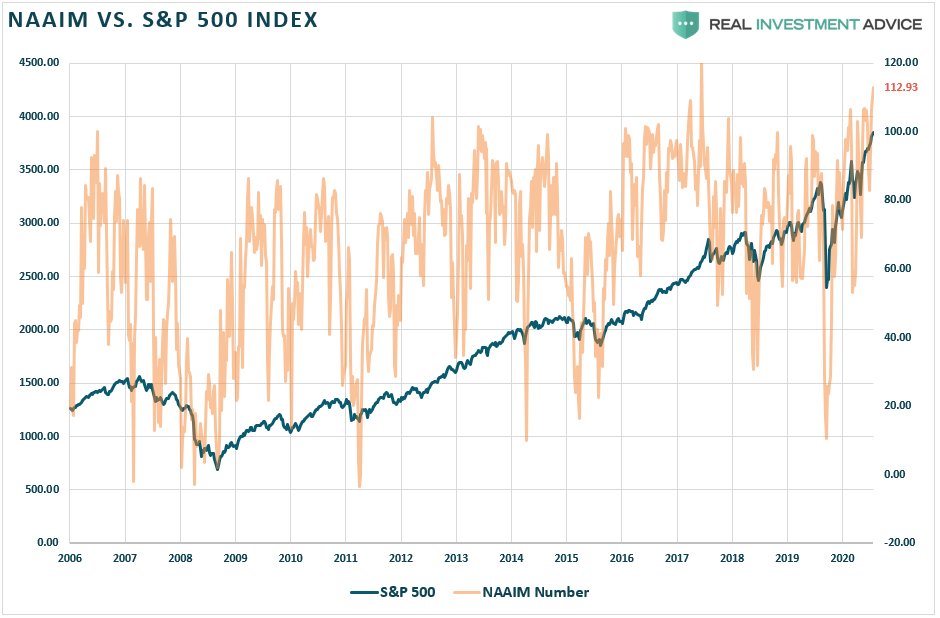
Professional money managers are not only fully exposed to equities but are doing so on leverage. The National Association Of Investment Managers index is now at 113%. Such is the second-highest reading on record, surpassing readings in late 2017 on expectations of tax cuts.
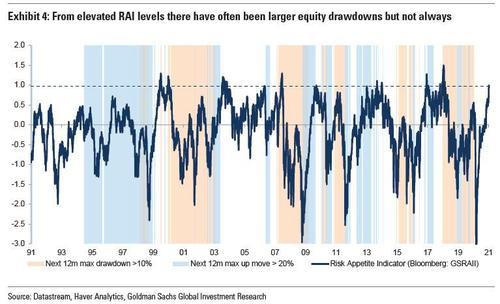
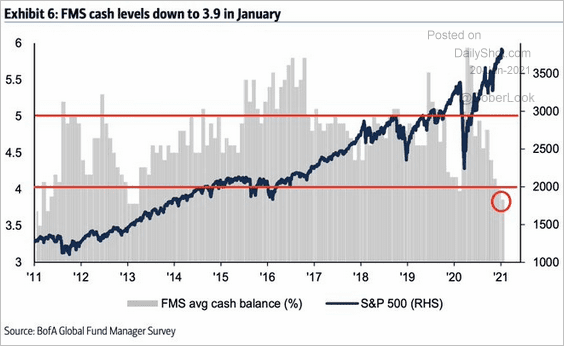
Goldman Sachs (NYSE:GS) risk positioning indicator, and mutual fund cash levels, also suggest that managers are “all in.”
While none of this means that a correction is immediately imminent, it does suggest there are few buyers readily available.
The Supply / Demand Imbalance
Despite the “selloff” in March, retail positioning is once again very long-biased. The implementation of QE-4 once again removed all “fears” of a correction, recession, or bear market.
Historically, such sentiment excesses tend to form around short-term market peaks rather than investable bottoms.
Such is an excellent time to remind you of the other famous “Bob Farrell Rule” to remember:
“#5 – The public buys the most at the top and the least at the bottom.”
As we discussed recently in “There Is No Cash On The Sidelines,” the markets are driven by buyers’ and sellers’ supply and demand.
“In the current bull market advance, few people are willing to sell, so buyers must keep bidding up prices to attract a seller to make a transaction. As long as this remains the case, and exuberance exceeds logic, buyers will continue to pay higher prices to get into the positions they want to own.”
Such is also the definition of the “Greater Fool Theory:”
“The greater fool theory states that it is possible to make money by buying securities, whether or not they are overvalued, by selling them for a profit at a later date. This is because there will always be someone (i.e. a bigger or greater fool) who is willing to pay a higher price.”
The problem comes when buyers are no longer willing to pay a higher price. When sellers realize the change, there will be a rush to sell to a diminishing pool of buyers. Eventually, sellers begin to “panic sell” as buyers evaporate. Such is the point where prices plunge.
Theory Fails In Reality
The whole premise of “cash of the sidelines” is nonsense. While it is excellent rhetoric to feed the bulls while markets are rising, paying attention to nonsensical rationalizations has repeatedly led to poor outcomes.
If you don’t believe that, here are a couple of headlines:
- Jan. 31, 2020 – “Cash on the sidelines reaches highest levels since 2008.”
- Jan. 25, 2020 – “Private equity firms sitting on $1.5 trillion in unspent cash.”
Here is what happened next:
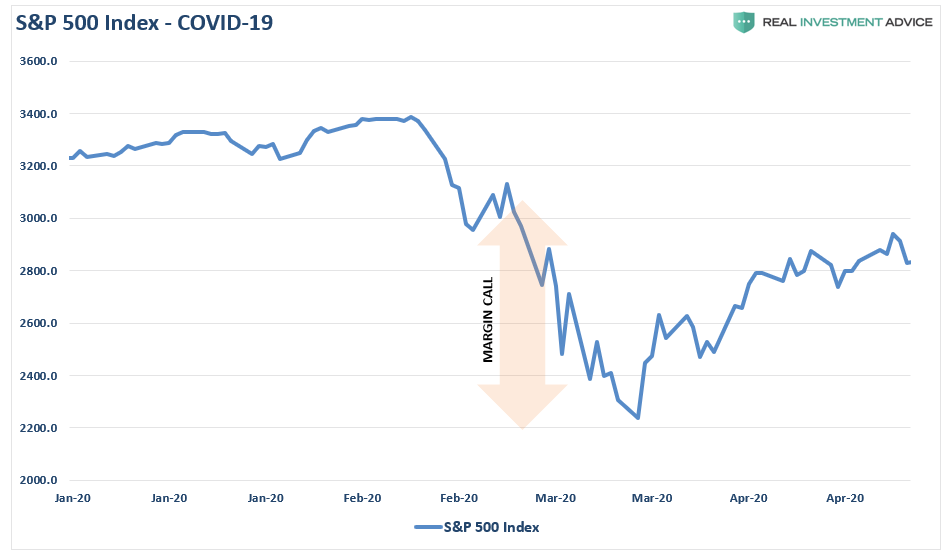
“For every buyer there MUST be seller, the only question is at WHAT PRICE the transaction will occur?”
Risk Immunity
During bull markets, investors get forgiven for their investment mistakes. Overpaying for value, buying fundamentally deficient companies, and taking on excess risk, seems to have no consequence.
Unfortunately, such is where investors tend to go astray.
In the short-term, the market dynamics are indeed bullish. Such is why we are only reducing risks in portfolios currently and not becoming entirely defensive.
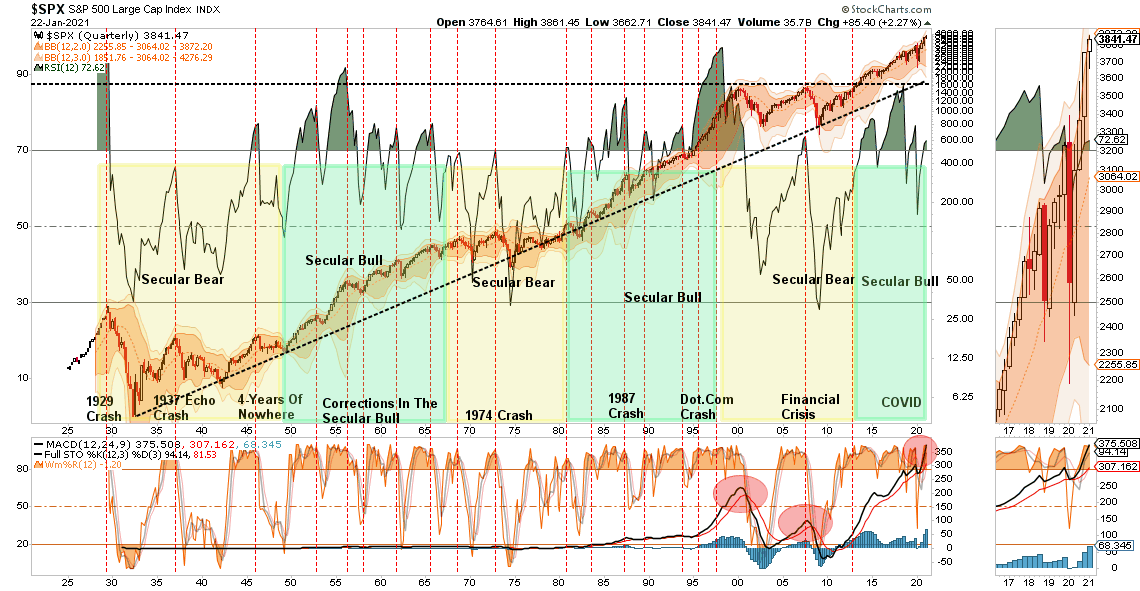
However, on a long-term basis, the picture becomes much more concerning.
- As noted above, this chart is not about short-term trading but the long-term management of risks in portfolios. It is a quarterly chart of the market going back to 1920.
- Note the market has, only on a few rare occasions, been as overbought as it is currently. The recent advance has pushed the market into 3-standard deviations above the 3-year moving average. In every single case, the reversion was not kind to investors.
- Secondly, in the bottom panel, the market has never been this overbought and extended in history.
- As an investor, it is crucial to keep some perspective about where we are in the current cycle. There is every bit of evidence that a significant mean reverting event will occur. Timing is always the issue, which is why use daily and weekly measures to manage risk.
- Don’t get lost in the mainstream media. It is an essential chart.
The Problem Of Overpaying For Value
The current environment has become so richly priced there is little opportunity for investors to extract additional gains from risk-based investments.
There is one true axiom of the market, which investors always tend to forget.
“Investors buy the most at the top, and the least at the bottom.”
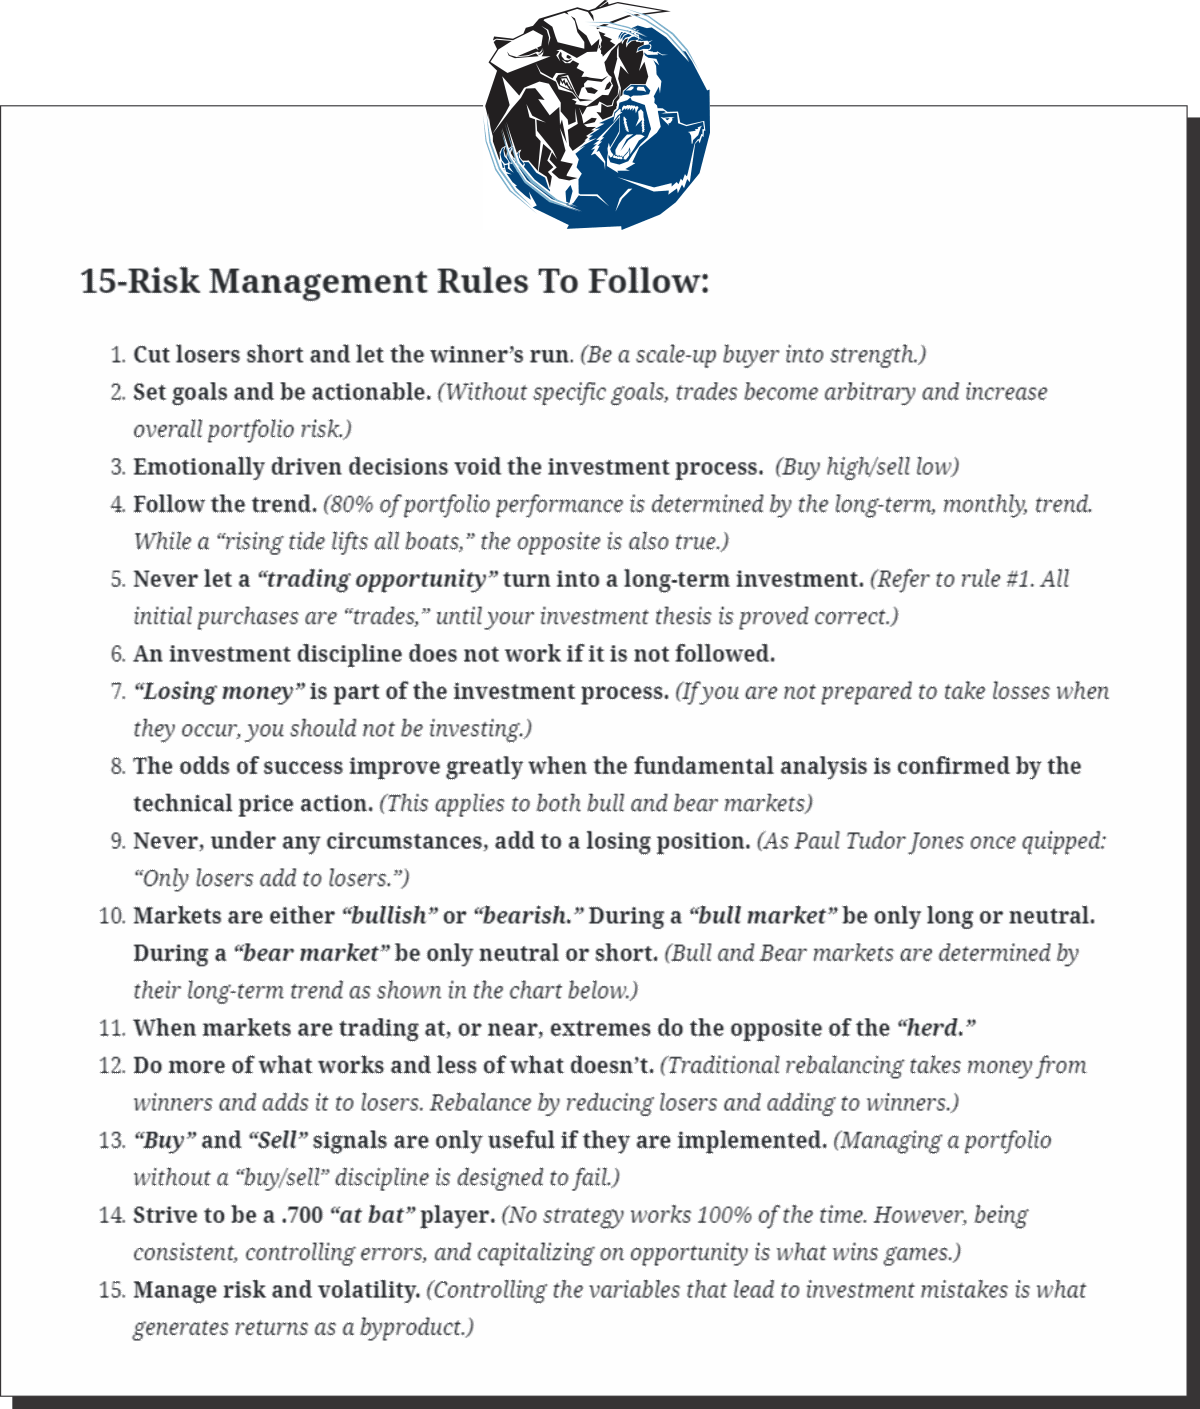
If you feel you must chase the markets currently, then do it with a set of guidelines to follow if things turn against you. We printed these rules a couple of weeks ago but felt there are worth mentioning again.
While we remain optimistic about the markets currently, we are also taking precautionary steps to tighten up stops, add non-correlated assets, raise some cash, and look to hedge risk opportunistically.
Just because it isn’t raining right now doesn’t mean it won’t.
Nobody has ever gotten hurt by keeping an umbrella handy.

