Technically Speaking: Utilities In A Clear Move Lower

Published 11/07/2019, 12:33 AM
Updated 07/09/2023, 06:31 AM

Technically Speaking For November 6

  • The Dallas Fed president is less concerned about rates now that the yield curve is less inverted.
  • More aggressive industries are leading the market higher.
  • The markets are consolidating.
  • Dallas Fed President Kaplan is pleased that the yield curve's inversion is improving (emphasis added):

    “I feel better with a more normally shaped yield curve,” Kaplan told Bloomberg News on Tuesday after speaking at an event in Dallas. Kaplan had voiced concern in the past that having the Fed’s benchmark policy rate above the entire Treasury yield curve was a warning that it had set rates too high...

    “So now that we’ve got a 10-year in the 180s and a 2-year in the 160s -- much more in line with the fed funds rate -- I think it again reinforces to me that we’ve probably got an appropriate setting of the Fed funds rate now,” he said.

    Various measures of the yield curve have been improving. The 10-2 spread -- cited above -- is widening:
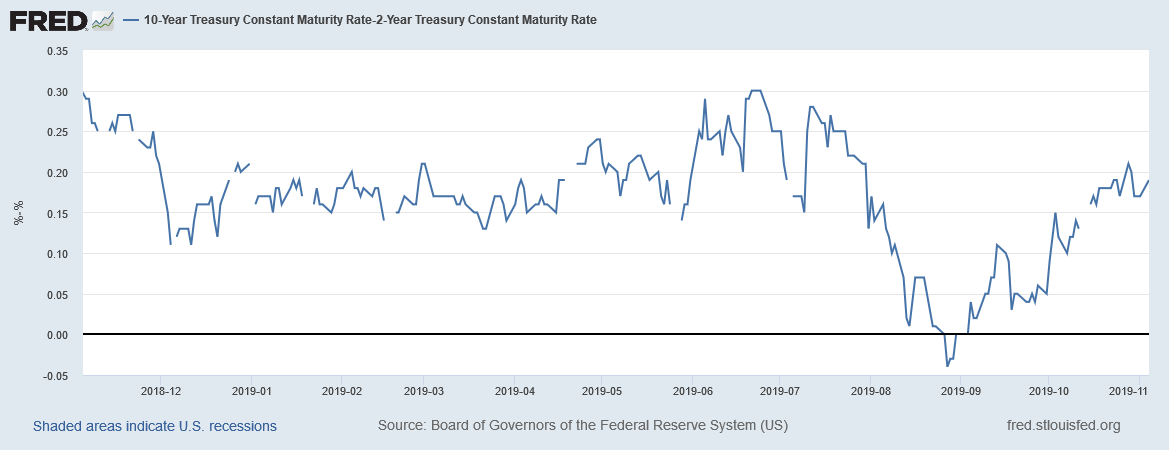
    10 Year Treasury Yield Chart

    Other measures of the yield curve's belly have widened recently and are a prime reason I lowered my recession probability in the next 6-12 months to 15%.

    The latest round of Markit Economic Service Sector Indexes are mostly positive:

  • The EU Service PMI increased from 51.6-52.6. New orders increased, although exports were down
  • China's Service PMI decreased modestly from 51.3-51.1. New orders were up but soft; exports increased.
  • Brazil's Services were down from 51.8-51.2. New orders, exports, employment, and confidence all rose.
  • Russian services PMI rose from 53.6-55.8. New orders, exports, and employment all rose.
  • Japans' services dropped but the report noted that a recent tax increase and weather-related problems were the likely cause.
  • The UK services sector rose from 49.5-50. Brexit remains an issue.
  • Sector performance is turning more bullish.

    The following table shows the top three industry performers for the last month, quarter, six months:

    Top Three Industry Performers

    Technology appears twice, as do financials and industrials. Energy and basic materials are also in the table. Utilities are the only defensive sector, and they only appear in the six-month time, meaning more aggressive sectors are rising in importance over shorter time spans. Overall, this is bullish, indicating that traders have more confidence in the underlying economy.

    Let's turn to the performance tables:
    Performance Table

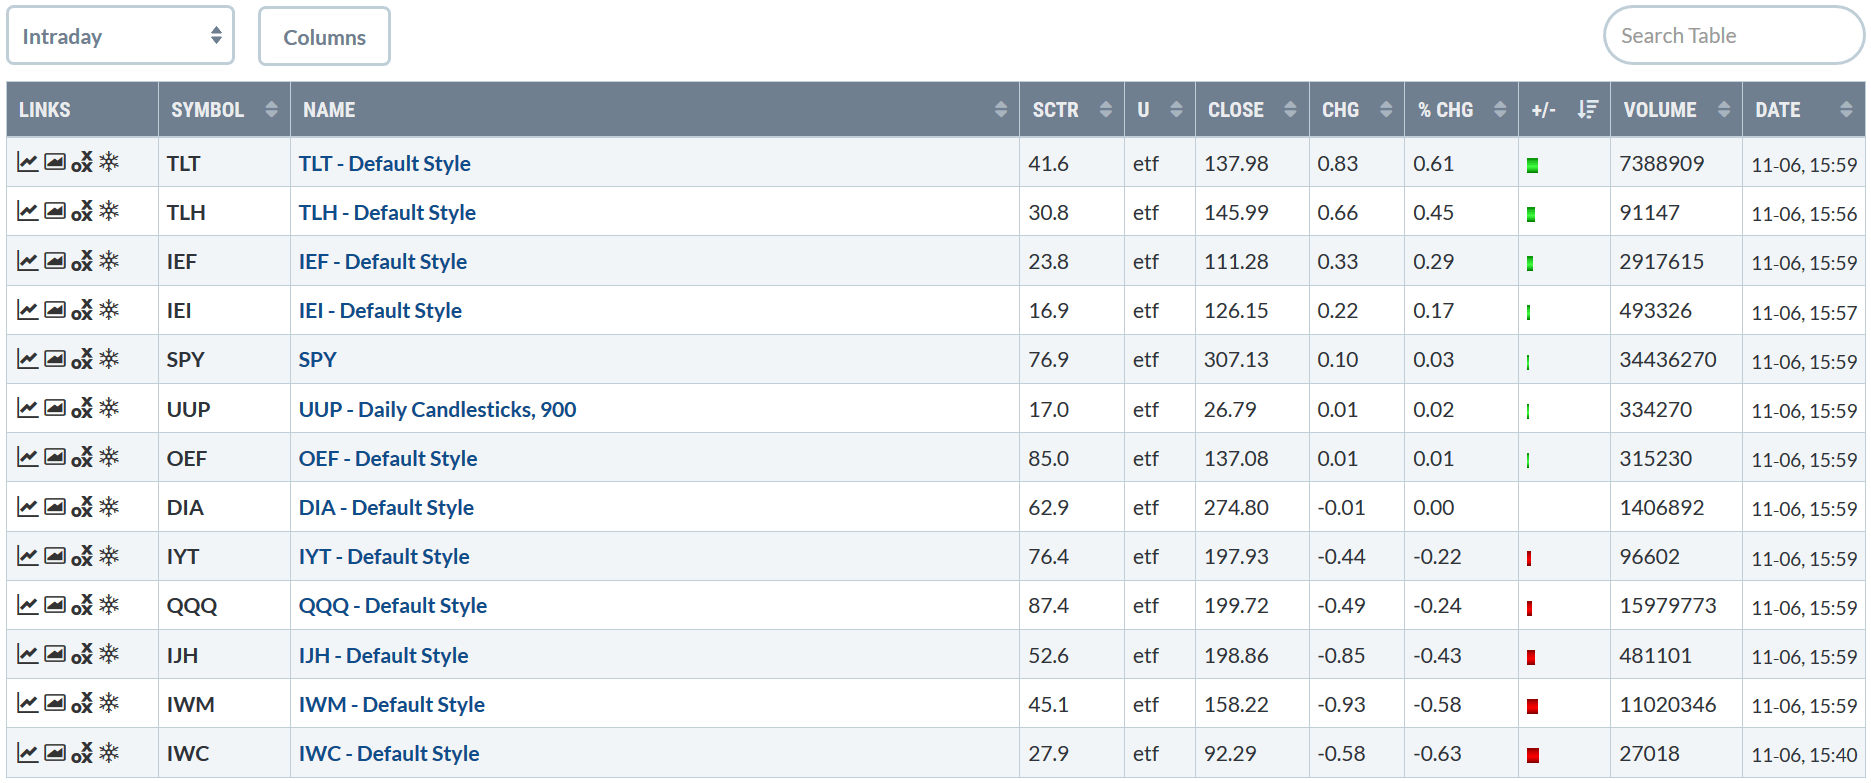
    Ultimately, this is more of a nothing day than anything else. The strongest gain was .61%; larger-caps were either unchanged or off modestly; smaller caps were down. Since the market is in a rally, this is more of a brief consolidation than anything else.
    Sector Performance Table

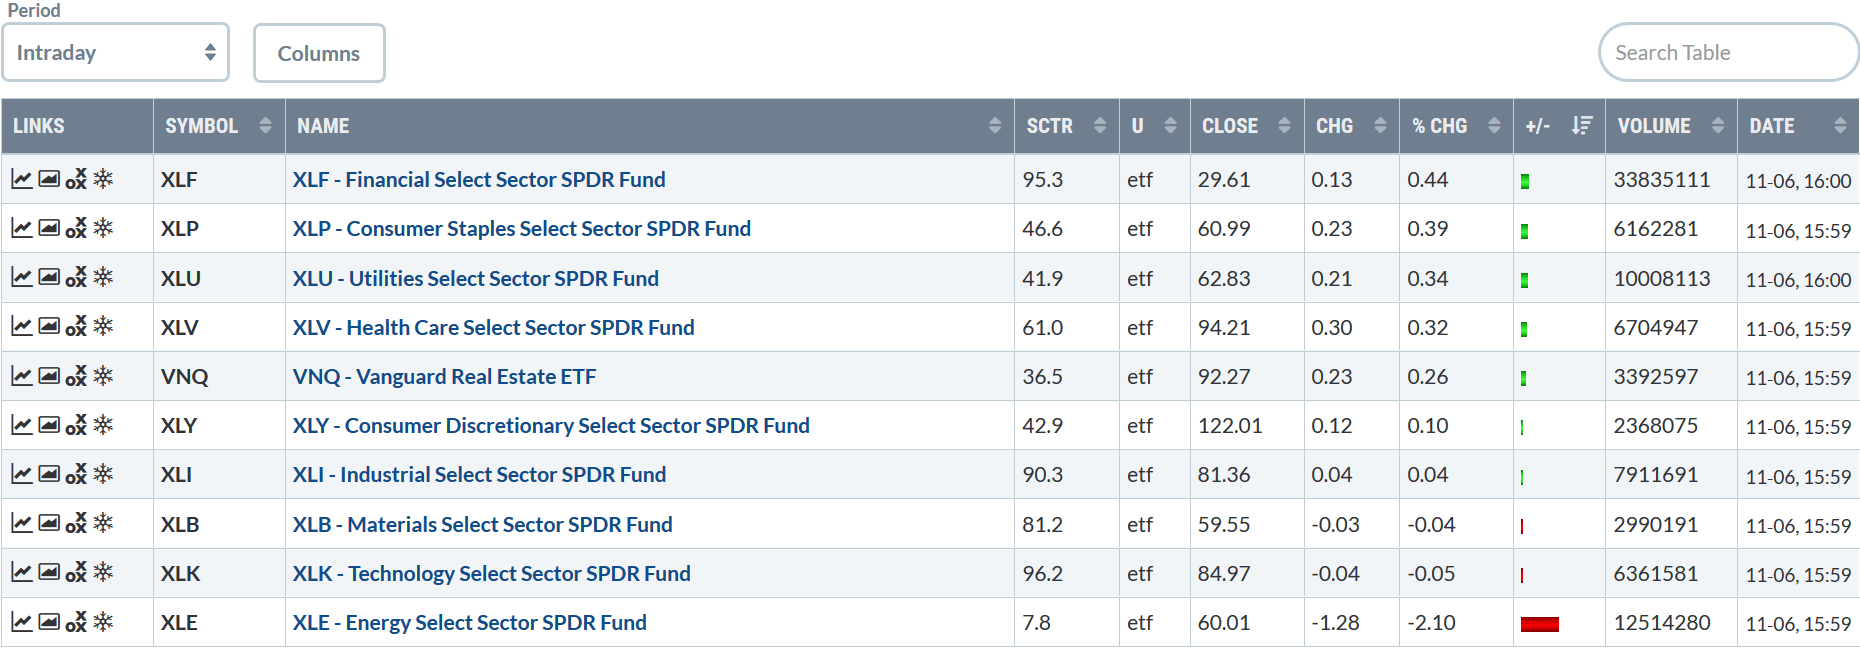
    With the exception of the energy sector, the sector performance was the same as the index's -- up or down modestly. But the movement isn't anything to write home about.

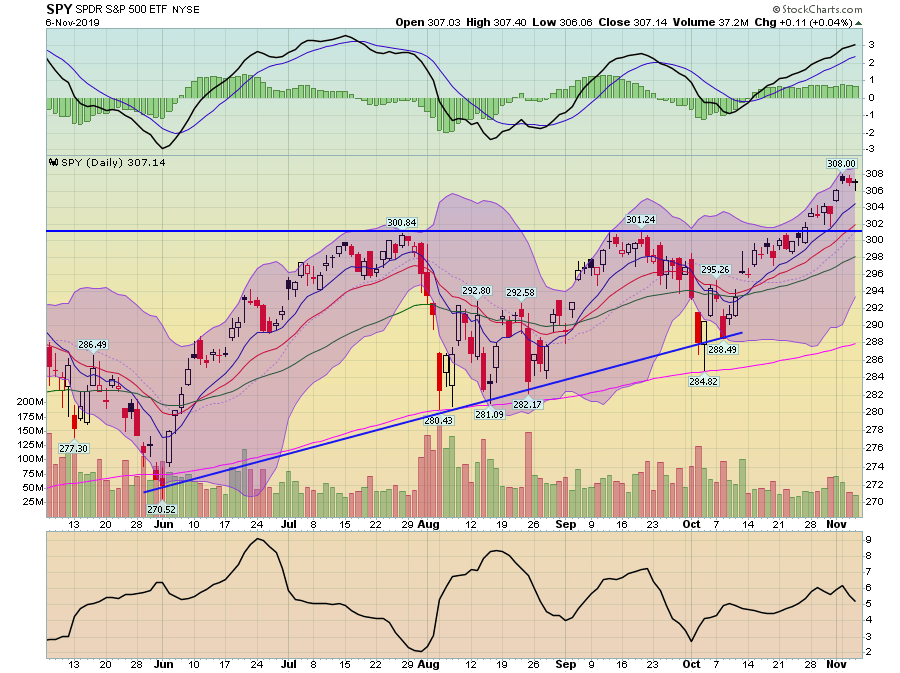
    The charts show the consolidation pretty clearly.
    SPY Daily Chart

    SPY daily chart shows the break-out nine days ago and the consolidation that's occurred over the last three days. Momentum is still positive and the EMA picture is still very bullish (shorter EMAs are higher than the longer EMAs and all are rising).
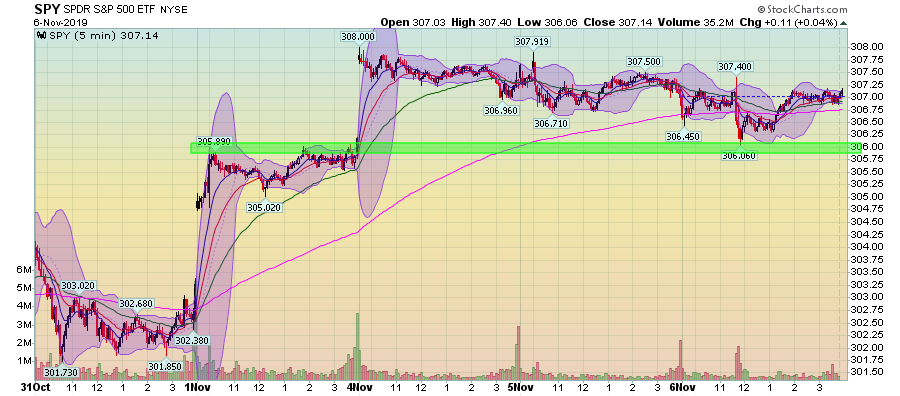
    SPY 5 Min Chart

    Over the last three days, the SPY has trended modestly lower but remains above highs from November 1.
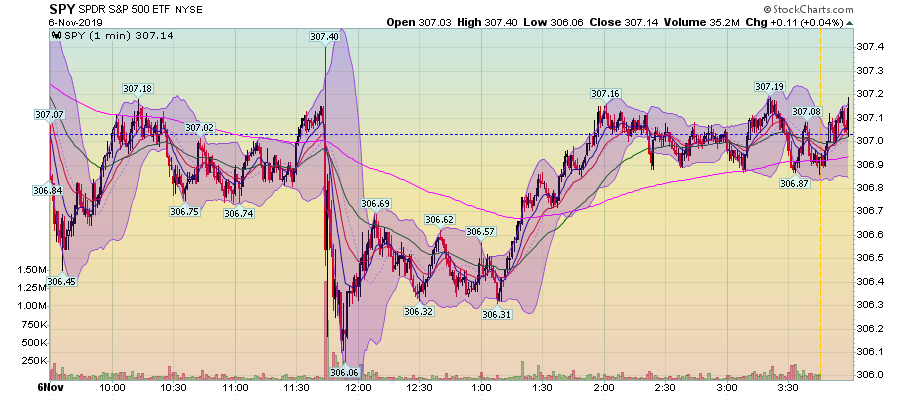
    SPY 1 Min Chart

    Finally, for the SPY, today's chart shows the "nothingness;" prices used yesterday's close (the dashed line) as a center of gravity for trading.

    There is, however, an interesting trend occurring underneath the broader market: two defensive industries are in a 2-week downtrend.
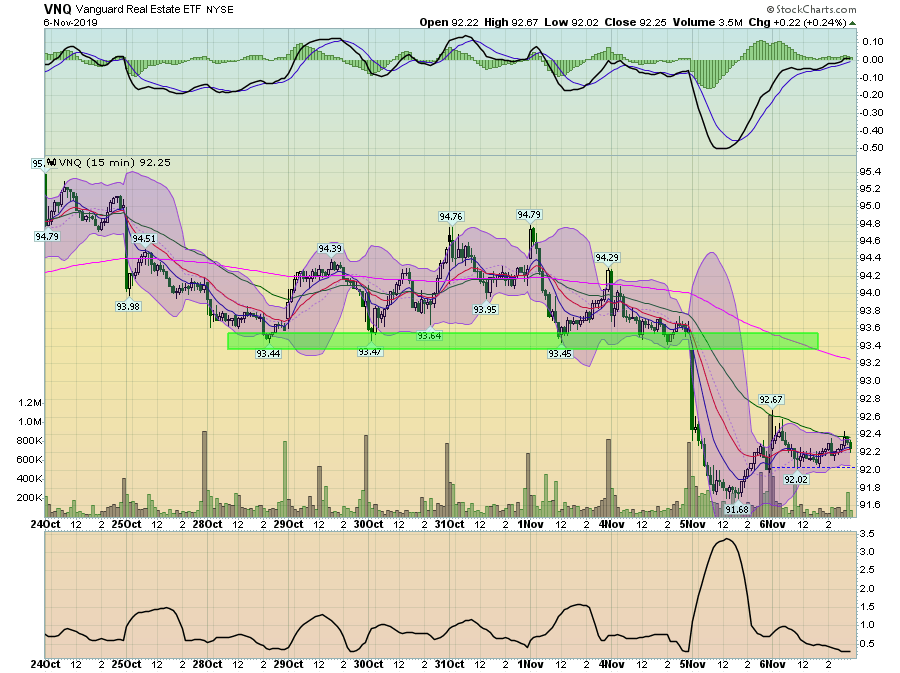
    VNQ 15 Min Chart

    The real estate ETF used the 93 level for technical support between October 28 and November 4. On Tuesday, prices dropped sharply and consolidated losses.
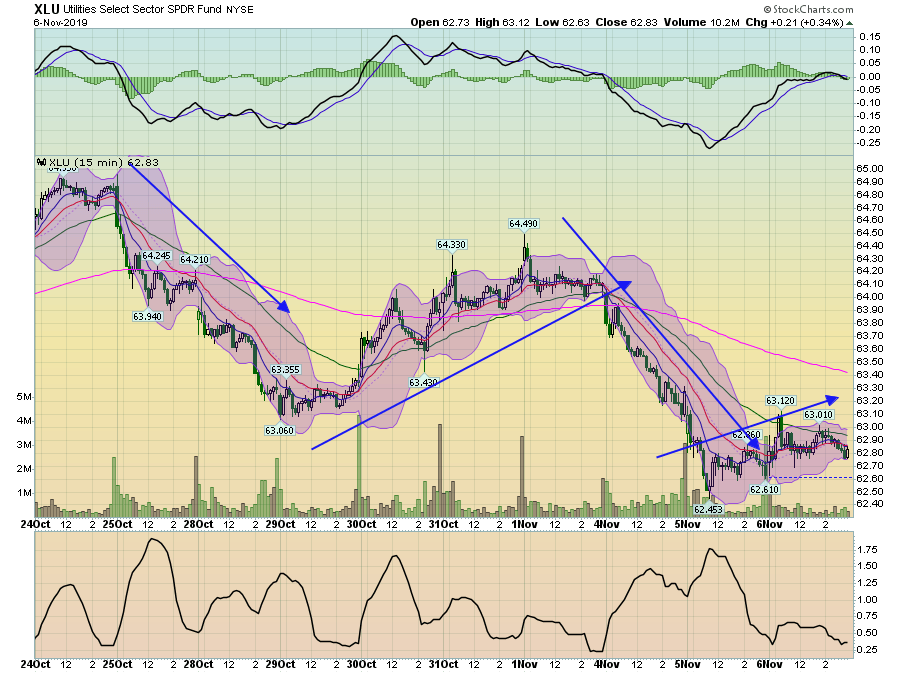
    XLU 15 Min Chart

    Utilities are in a clear move lower; they're printing a series of lower lows and lower highs.

    While the bars on the daily chart are still a bit weak, the underlying trend is clear: the move higher is still intact and the market is solidifying gains.

    Original Post

    Latest comments

    Loading next article…
    Risk Disclosure: Trading in financial instruments and/or cryptocurrencies involves high risks including the risk of losing some, or all, of your investment amount, and may not be suitable for all investors. Prices of cryptocurrencies are extremely volatile and may be affected by external factors such as financial, regulatory or political events. Trading on margin increases the financial risks.
    Before deciding to trade in financial instrument or cryptocurrencies you should be fully informed of the risks and costs associated with trading the financial markets, carefully consider your investment objectives, level of experience, and risk appetite, and seek professional advice where needed.
    Fusion Media would like to remind you that the data contained in this website is not necessarily real-time nor accurate. The data and prices on the website are not necessarily provided by any market or exchange, but may be provided by market makers, and so prices may not be accurate and may differ from the actual price at any given market, meaning prices are indicative and not appropriate for trading purposes. Fusion Media and any provider of the data contained in this website will not accept liability for any loss or damage as a result of your trading, or your reliance on the information contained within this website.
    It is prohibited to use, store, reproduce, display, modify, transmit or distribute the data contained in this website without the explicit prior written permission of Fusion Media and/or the data provider. All intellectual property rights are reserved by the providers and/or the exchange providing the data contained in this website.
    Fusion Media may be compensated by the advertisers that appear on the website, based on your interaction with the advertisements or advertisers.
    © 2007-2025 - Fusion Media Limited. All Rights Reserved.