As we detailed in this past weekend’s newsletter:
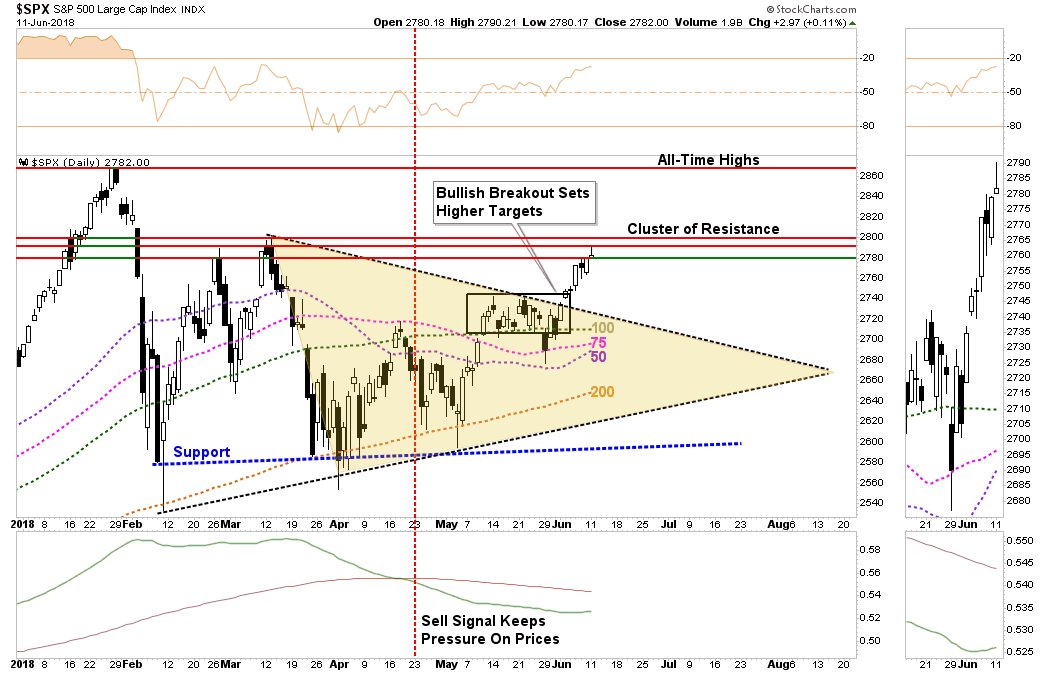
“…[the expected] breakout did occur and pushed prices to the first level of resistance which resides at the late February highs.”

“…there is a significant amount of overhead resistance between 2780 and 2800 which may present a challenge in the short-term to a further advance. However, I suspect any weakness next week will likely provide a decent opportunity to increase equity exposure modestly.
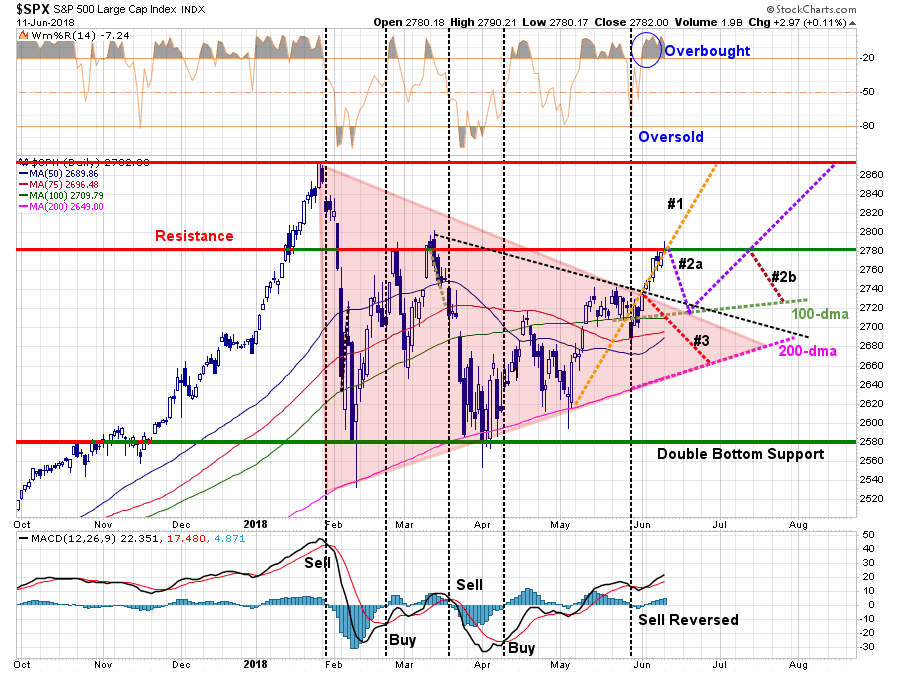
This idea aligns with the updated ‘pathway analysis’ from last week.”

“We had previously given pathway #1, #2a and #2b a 70% probability of coming to fruition. The tracking of pathway #1 also negates pathway #3 entirely for now.
More importantly, the market is sitting at the critical juncture of either a continuation of pathway #1 toward all-time highs or a correction of some sort to retest support and confirm this past week’s breakout. A corrective retest that provides a better entry point to increase exposure is the most preferable of outcomes.”
While we will increase our equity exposure in portfolios, cautiously and moderately, it does not mean we no longer appreciate the risk in the markets, or to investment capital.
Risks To Our View
As we discussed this past weekend, the risks to our view, both in the short and intermediate-term, remain.
- The Fed will hike rates next week, however, their press conference will be closely watched for more “hawkish” undertones.
- Next week, the Trump Administration will announce $50 billion in “tariffs” on Chinese products. The ongoing trade war remains a risk to the markets in the short-term.
- Any unexpected “back-of-the-napkin” policy the White House takes which surprises the market.
- Ongoing liquidity concerns with respect to Italy or Deutsche Bank (DE:DBKGn).
On Monday, the market shrugged off the “back-of-the-napkin” trade policy and backlash by the Administration towards Canada’s Prime Minister Justin Trudeau following the G-7 Summit. However, there is still a growing risk that “trade policy” will have a more detrimental impact to U.S. companies in the months ahead.
There is also risk in the optimism over Trump’s “mano-a-mano” meeting with Kim Jung Un on the issue of a “nuclear-free North Korea.” While the pair signed an agreement yesterday “committing” to denuclearization, it was actually little more than an agreement to have more summits.
The markets had already priced in much of the current events with the recent run up, so an agreement to have more summits left markets a bit “underwhelmed” this morning.
The biggest risk to our more optimistic market view remains the Fed, global Central Bank liquidity support, and monetary policy. Bank of America (NYSE:BAC), via ZeroHedge, provided additional support to our view of the “end of liquidity” which will become more aggressive this year.
“In our view, the ECB has decided to announce in June how QE will end for three reasons. The QE program will end for sure this year, because of technical constraints, so there is no reason to keep the uncertainty and give a false impression that extending QE to 2019 remains an option.
Following the market turmoil from Italy last week, the ECB has strong incentives to make it clear that QE is about to end, also sending a message to the new government in Italy that they should not count on QE support if they want to loosen fiscal policies. And recent headlines on the ECB drop of BTP purchases in May makes the QE program politically more controversial. This suggests that the end of QE has nothing to do with the intended ECB monetary policy stance or the latest economic developments and outlook ahead. We would expect the ECB to emphasize that rate hikes ahead will be strictly data dependent.”
With the FOMC hiking rates this coming week, and accelerating its “balance sheet normalization” by increasing its roll-offs from $30 to $40 billion a month, the proverbial “global liquidity punch bowl” is now being more aggressively removed. This is akin to removing the trampoline with the jumper currently at their apex.
With global economic growth slowing, trade war risks rising, and liquidity being extracted, there is a rising possibility that tighter global monetary policy will lead to a credit-driven event. This is particularly the case given the rate at which corporations have been gorging themselves on cheap debt to take cash out of their balance sheets for the benefit of their executives and shareholders. Steven Pearlstein via the Washington Post:
“Now, 12 years later, it’s happening again. This time, however, it’s not households using cheap debt to take cash out of their overvalued homes. Rather, it is giant corporations using cheap debt — and a one-time tax windfall — to take cash from their balance sheets and send it to shareholders in the form of increased dividends and, in particular, stock buybacks. As before, the cash-outs are helping to drive debt — corporate debt — to record levels. As before, they are adding a short-term sugar high to an already booming economy. And once again, they are diverting capital from productive long-term investment to further inflate a financial bubble — this one in corporate stocks and bonds — that, when it bursts, will send the economy into another recession.
Welcome to the Buyback Economy. Today’s economic boom is driven not by any great burst of innovation or growth in productivity. Rather, it is driven by another round of financial engineering that converts equity into debt. It sacrifices future growth for present consumption. And it redistributes even more of the nation’s wealth to corporate executives, wealthy investors and Wall Street financiers.”

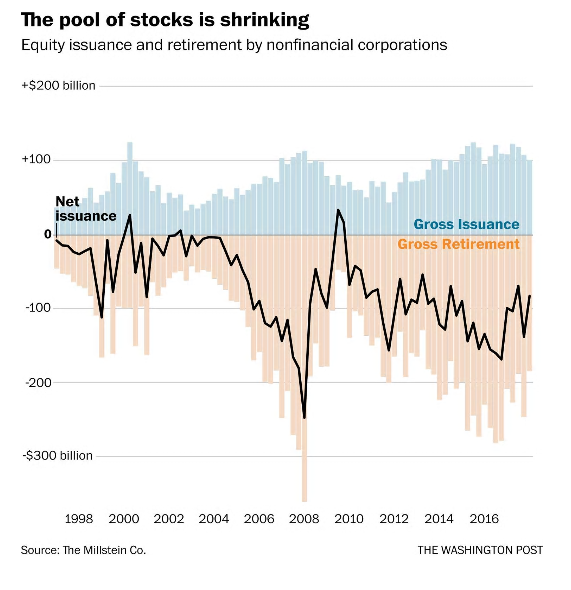
“As the accompanying chart indicates, over the past decade, net issuance of public stock — new issues minus buybacks — has been a negative $3 trillion. This reduction in the supply of public shares in American companies, coupled with an increased global demand for them, goes a long way toward explaining why stocks are now priced at 25 times earnings, well above their historical average.”
This is a problem that provides our biggest concern currently. As I noted last week:
“Rising interest rates are a ‘tax.’ When combined with a stronger dollar, which negatively impacts exporters (exports make up roughly 40% of total corporate profits), the catalysts are in place for a problem to emerge.
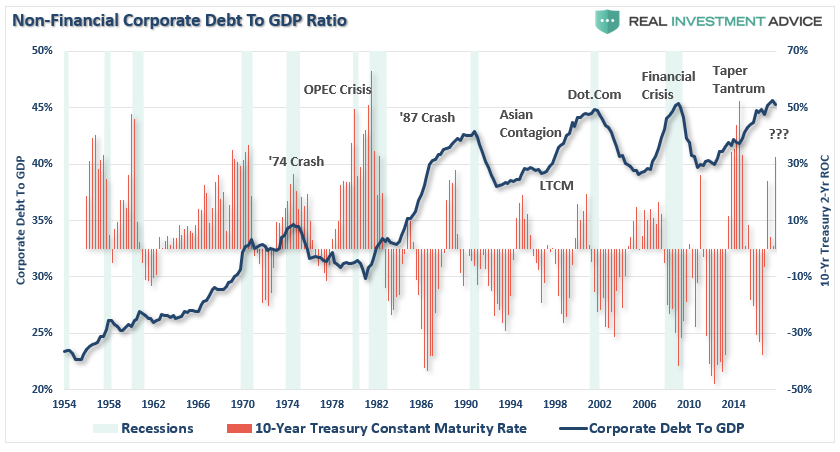
The chart below compares total non-financial corporate debt to GDP to the 2-year annual rate of change for the 10-year Treasury. As you can see sharply increasing rates have typically preceded either market or economic events. Of course, it is during those events which loan default rates rise, and leverage is reduced, generally not in the most ‘market-friendly’ way.

This is THE story we will most likely be discussing in the future even while the mainstream media suggests “no one could have seen it coming.”
It’s Confusing
This is where it gets confusing.
“Why are you increasing equity risk in portfolios, if you are certain the markets are going to break?”
It’s a great question from a reader over the weekend.
As portfolio managers we face two great challenges – making investments in the short-term to capitalize are market movements (or suffer career risk from underperformance) and managing long-term capital destruction risks which will occur from overvalued and extended bull markets.
Our investment discipline is designed to manage both ends of the spectrum. Our technical analysis, as we discuss each week, drives shorter-term portfolio actions (weeks to months), with fundamental analysis driving asset allocation and portfolio weighting decisions (months to years.)
Are we certain the markets are going to experience a severe “mean reverting event?”
Absolutely.
When?
We have no idea.
This is specifically why we don’t make absolute predictions about where markets are headed. We are not psychics, fortune-tellers, or imbibed with any prescient gifts. As such, we must we focus, and rely, on our assessment of the current possibilities versus probabilities based on an accumulation of evidence (hence our pathway analysis as shown above.)
We will make right “calls” and wrong ones. Such is the nature of investing. We just focus on trying to right more often than we are wrong.
This is why we share our analysis with you each week.
Writing forces us to consolidate our views, have an opinion, and make informed decisions. Having a record of our decision-making process forces us to be accountable to ourselves and our clients.
Even if you don’t publish your own views and ideas, we encourage you to write them down, review them on a regular basis, and compare them to your portfolio actions. A written record informs you of what you have done right, and wrong. It also keeps you honest about your assessment of risk, reduce emotional responses to short-term market volatility, and focus your investing behavior toward your goals.
You will be a better investor for it.
“Consensus is something everyone agrees to, but no one believes in.” – Margret Thatcher
