Summary
South Korea lowered rates 25 basis points to 1.25%. Like other central banks, they are concerned about the negative growth resulting from the US-China trade dispute. Here is how the bank described the domestic economy (emphasis added):
The Board judges that the pace of domestic economic growth has remained slow, as consumption growth has weakened, while the adjustment in construction investment and the sluggishness in exports and facilities investment have continued. Employment conditions have partially improved, with the increase in the number of persons employed having risen. Going forward the Board expects domestic economic growth to fall below the July projection, owing chiefly to the continued US-China trade dispute and the heightened geopolitical risks.
South Korea is the 4th largest economy in Asia, behind China, Japan, and India. South Korean annual GDP growth has slowed over the last four quarters. Between 3Q16 and 2Q18, it averaged 3%; over the last four quarters, it has dropped to 2.2%. The manufacturing PMI has shown a contraction in 10 of the last 12 quarters, causing industrial production to contract in 6 of the last 12 months (Y/Y). But, like other counties, unemployment is low: it's currently 3.4%. This is supporting household spending, which has increased in 10 of the last 12 months (Y/Y). (Data from Tradingeconomics.com)
St. Louis Federal Reserve Bullard gave a speech where he argued the downside risks to the economy are larger than most think. Here's a slide from his PowerPoint presentation that shows the risks he's concerned about:
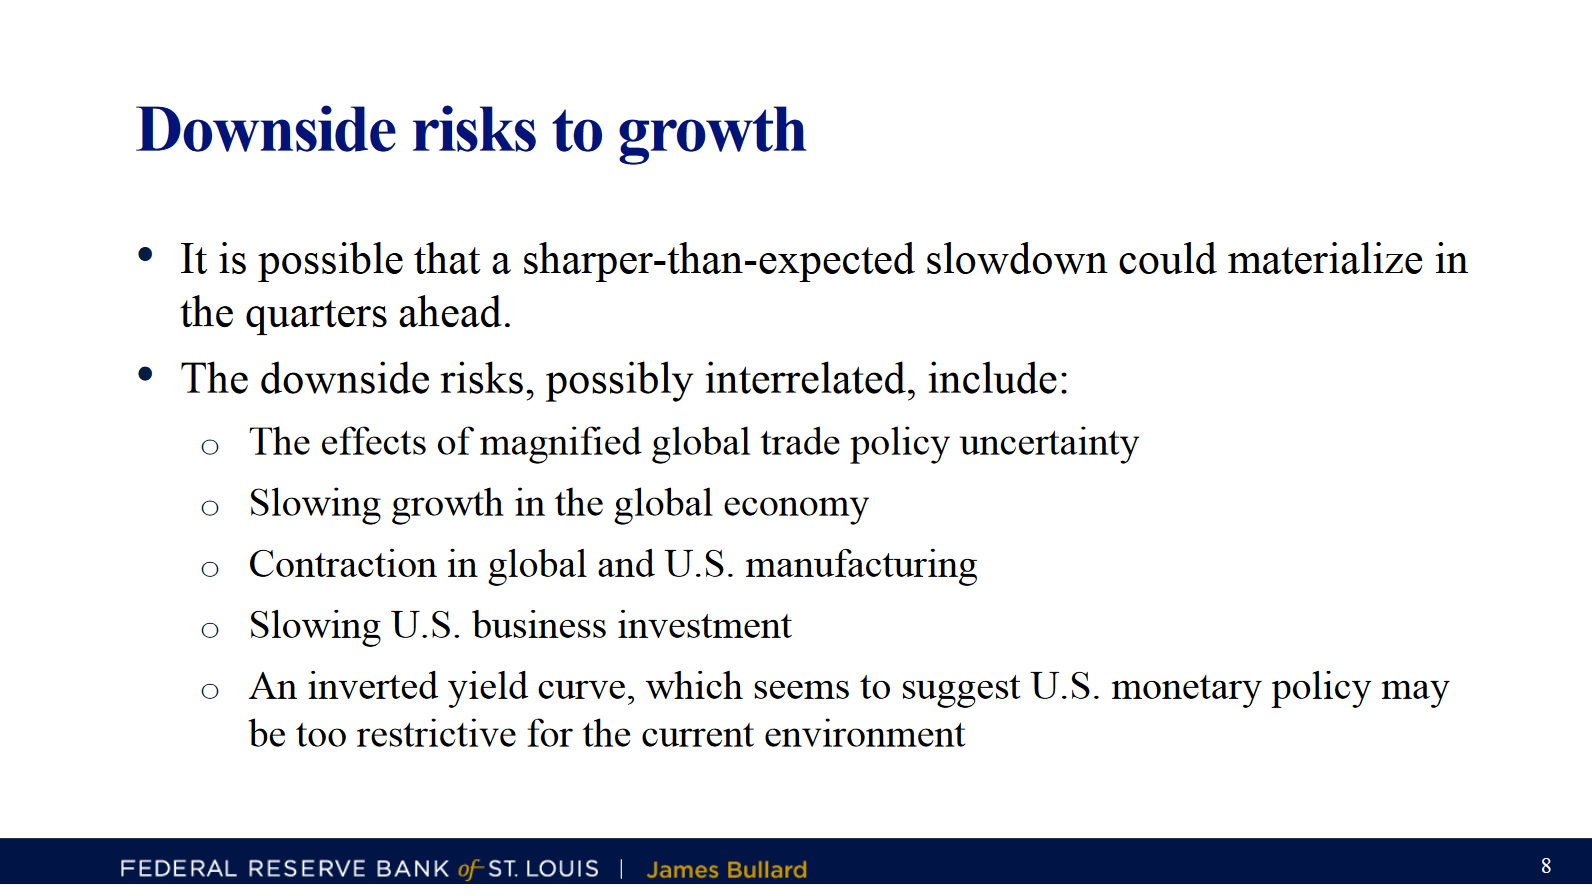
Bullard argued for a 50 basis point cut at the last Fed meeting and has been the most bearish president for some time. While he originally focused exclusively on inflation's underperformance, he's now concerned about the global manufacturing and trade slowdown seeping into the US economy, slowing domestic growth. To some extent, this is already happening: the ISM Manufacturing Index has contracted the last two months. Its employment, production, and new orders sub-indexes are also contracting. And the anecdotal comments specifically highlight trade tensions as the reason.
Brexit might not happen - or it might. From the NY Times (emphasis added):
Hopes for a breakthrough in the Brexit negotiations between Prime Minister Boris Johnson and the European Union have surged in recent days, but the positive mood music from diplomats masks a harder reality for Mr. Johnson: He may be forced into concessions that make his deal impossible to sell at home.
.....
The down-to-the-wire talks between British and European diplomats began on Tuesday morning, with some European officials predicting that the two sides would never close the divide. As the day wore on, however, the negotiators seemed to draw closer, and news of a potential deal trickled into the financial markets, where traders drove up the British pound.
The frantic, last-minute nature of the talks should have been expected as neither party wants to be seen as responsible for the economic shock of a no-deal Brexit. Time will tell if this works. Remember - we're two weeks and a day from October 31.
Today, I'll be looking at the weekly charts to place recent price movements into perspective.
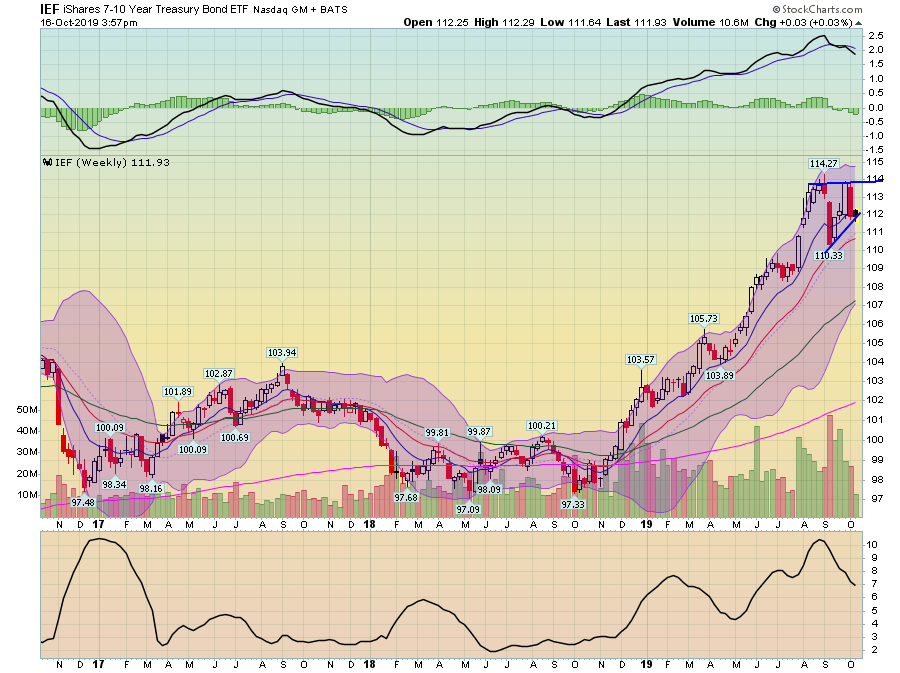
After rallying strongly between late 2018 and the early summer. Since then, the IEF has consolidated in a rising wedge pattern - which is a topping pattern. Notice that momentum is moving lower.
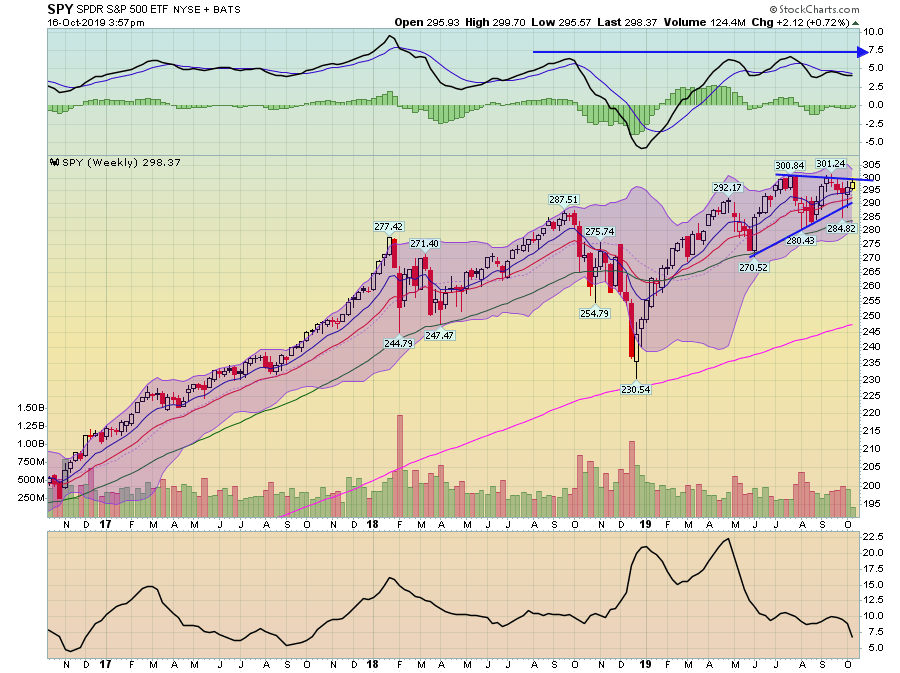
The SPY is still consolidating in a triangle pattern. Momentum is moving sideways. The SPY needs to move through the lower 300 price level to break out technically. The QQQ has printed a similar pattern.
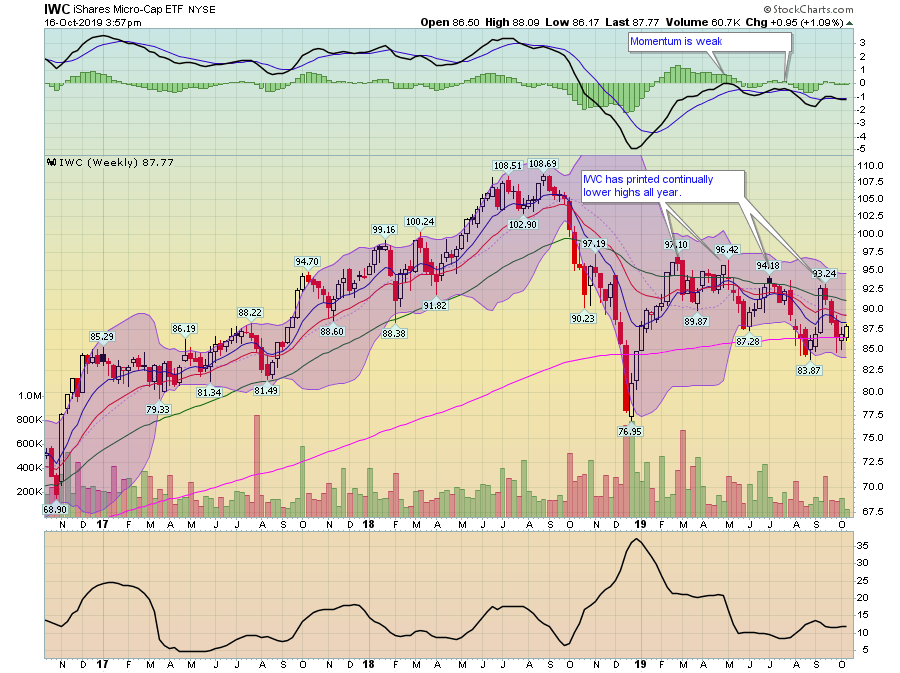
Micro-caps have printed a lower highs - a bearish development. Prices are sitting on the 200-week EMA for technical support.
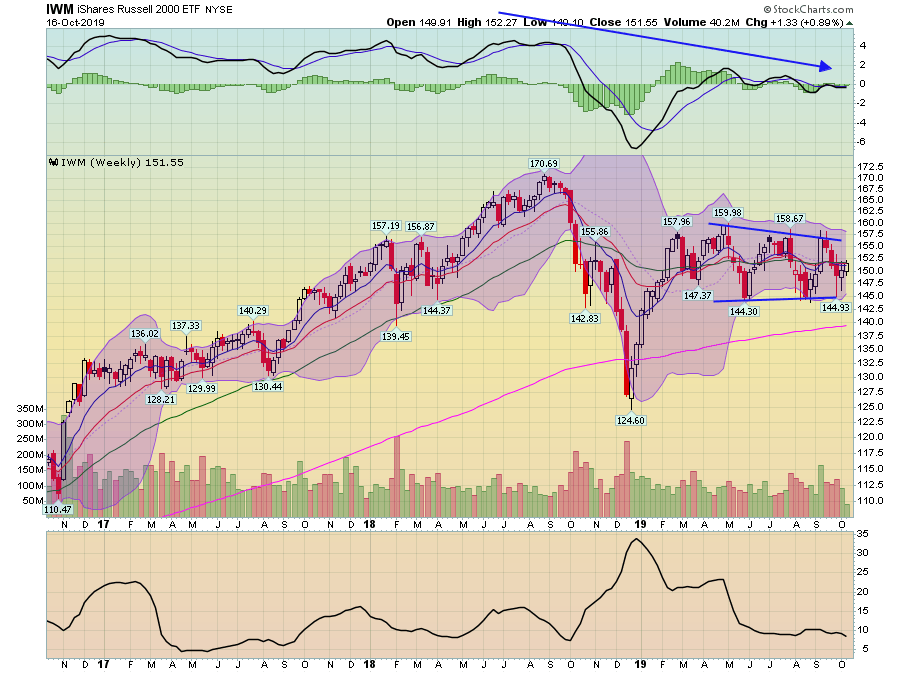
The IWM is trading sideways, fluctuating around the shorter EMAs. It has been consolidating for most of this year.
The above charts are standard for the end of a cycle. Treasuries are rallying, large-caps have a bid, and small-caps are languishing.
