Summary- International data -- especially trade-related statistics -- remains soft,.
- US data is holding up.
- The markets had a solid week.
International Data
EU/UK
- EU Composite PMI 51.5
- Manufacturing 46.4
- Service 53.4
- EU credit growth 2.2%
- EU consumer confidence at -.6%
EU Conclusion: the region still has serious problems. Manufacturing continues to weaken due to heightened international trade tensions and the resulting decline in economic activity. On the plus side, the service sector is still in good shape; it is more than strong enough to keep the economy afloat for now.
China/Japan/Asia/Australia
- Japan Composite PMI 51.2
- Manufacturing 49.6
- Service 52.3
- Leading indicator 94.9
- Coincidental indicator 103.4
Asia
- South Korean GDP increased 1.1% Q/Q
- Singapore Industrial Production decreased 6.9% Y/Y
- Singapore unemployment at 2.25
Australia
- Manufacturing PMI 51.4
- Service PMI 51.9
- Composite 51.8
China/Japan/Asia/Australiaconclusion: Asian data is still soft. Manufacturing PMIs continue to note weak orders, production and trade figures. On the plus side, South Korea's economy expanded in the 2Q, countering a modest 1Q contraction.
Canada/Mexico
Mexico
- Retail sales increase 2.8% Y/Y
- Balance of trade increases to $2.5 billion Y/Y
Key Central Bank Actions
The ECB kept rates at 0%. They also strongly hinted at additional action due to weak economic activity.
In this context, we have tasked the relevant Eurosystem Committees with examining options, including ways to reinforce our forward guidance on policy rates, mitigating measures, such as the design of a tiered system for reserve remuneration, and options for the size and composition of potential new net asset purchases.
The bank faces two problems. The first is weak inflation (emphasis added):
The Governing Council also underlined the need for a highly accommodative stance of monetary policy for a prolonged period of time, as inflation rates, both realised and projected, have been persistently below levels that are in line with its aim. Accordingly, if the medium-term inflation outlook continues to fall short of our aim, the Governing Council is determined to act, in line with its commitment to symmetry in the inflation aim.
The second is increased downside risks (emphasis added):
The risks surrounding the euro area growth outlook remain tilted to the downside, reflecting the prolonged presence of uncertainties, related to geopolitical factors, the rising threat of protectionism, and vulnerabilities in emerging markets.
Further forcing the bank's hand is EU fiscal policy, which prevents governments from running deficits above 3% in certain circumstances. This prevents any EU member from using a large, Keynes style stimulus measure to jump-start its economy.
US Data
Let's begin with the first report on 2Q18 GDP, which the BEA released on Friday:
Real gross domestic product (GDP) increased at an annual rate of 2.1 percent in the second quarter of 2019 (table 1), according to the "advance" estimate released by the Bureau of Economic Analysis. In the first quarter, real GDP increased 3.1 percent.
Here's the report's table showing the Q/Q percentage change:
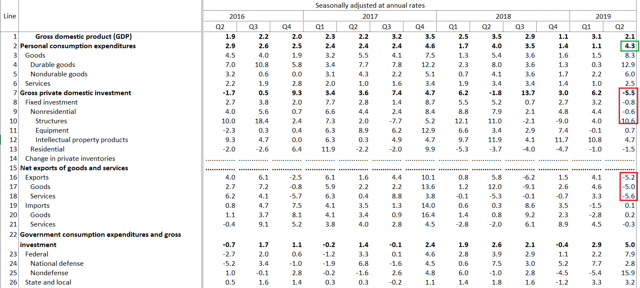
The market was happy with the report because it wasn't as bad as feared. But the internals aren't that encouraging. The main piece of good news was the large increase in PCEs, which rose 4.5% from the preceding quarter. And the 12.9% jump in durables spending was certainly welcome. But domestic investment dropped 5.5% thanks to very weak corporate activity: non-residential investment declined 10.6% and equipment spending rose a very modest .7%. The trade wars are clearly biting: exports declined 5.2% and imports were up the smallest increment possible -- 0.1%. If it wasn't for the 5% increase in government spending, growth would have been below 2%.
This week we received the latest housing market data. Remember that the economic backdrop for housing is positive: unemployment is low, 15 and 30-year rates have declined over 100 basis points since the end of 2018, and consumer confidence is high.
New home sales rose 7% M/M and 4.5% Y/Y. The chart of the data shows that the market is once-again range-bound:
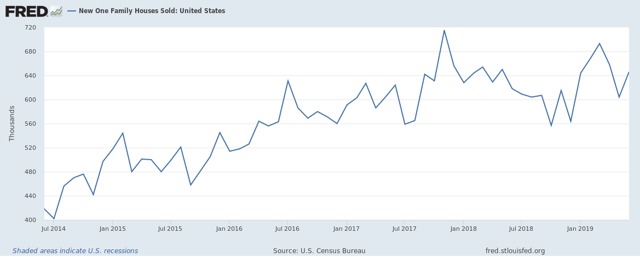
The pace of new home sales centered around the 640,000 level between 2H17-1H18. It dropped to 560,000-600,000 in 2H17 and is now back to the 640,000 level. This far smaller section of the housing market appears to have returned to a status quo pace.
Existing home sales (which account for 90% of all housing sales) declined 1.7% M/M and 2.2% Y/Y. Here's a chart of the data from Calculated Risk:
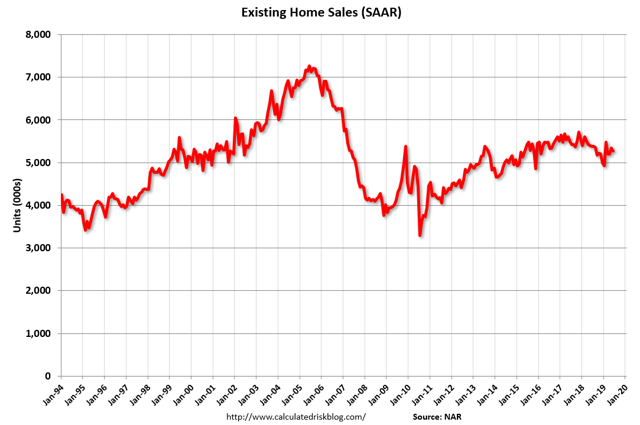
After trending lower in 2018, the sales pace increased modestly at the beginning of this year but still hasn't returned to the highs of late 2017 and late 2018. Still, the data is stable, indicating a fair amount of demand.
Finally, on Thursday the Census released the latest durable goods numbers, which were up 2% overall and 1.2% ex-transports. Here's a chart of the data:
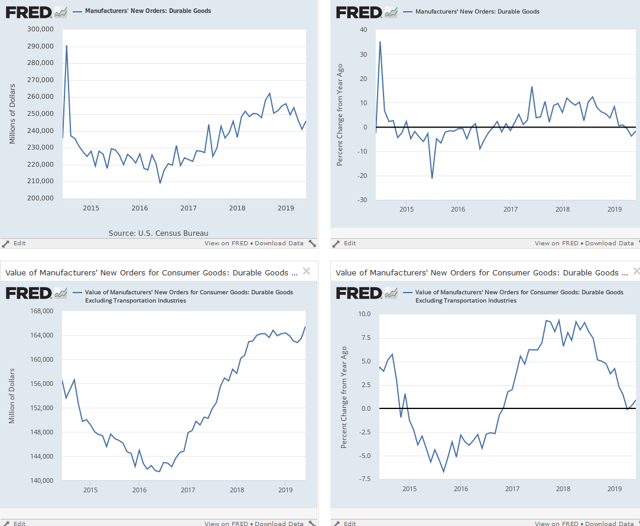
The top left chart shows the overall number, which declined at the beginning of 2019 while the Y/Y rate (right chart) shows a negative rate. The bottom charts are the ex-transport numbers. The left chart shows the absolute number, which printed an expansion high. The Y/Y rate, however, just pulled up from going negative.
US Conclusion: the overall economy is still in decent shape: it's growing, the housing market is stable, and the durable goods report shows a decent amount of business demand. The GDP report, however, shows that consumer and government spending are the sole drivers of growth. The contraction in exports indicates the trade war is clearly biting. Should consumer sentiment drop, I'd expect growth to take a serious hit.
US Market Performance
Let's start with this week's performance table:
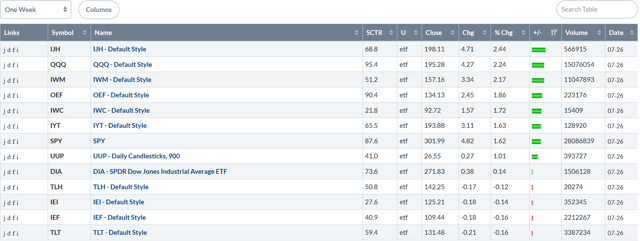
This was a solid week for the markets. Best of all, the small-cap indexes were in the top five slots: mid-caps were first, small-caps were third, and micro-caps were fifth. The Treasury market sold off modestly. Overall, this is a bullish table.
Let's turn to the charts, starting with today's:
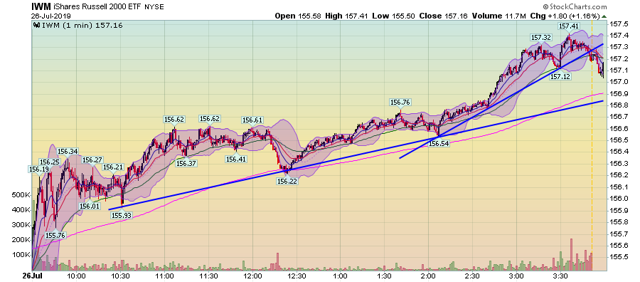
Small-caps had a solid run higher, with a strong uptrend that lasted the entire day -- notice the upward sloping 200-minute trend line in pink.
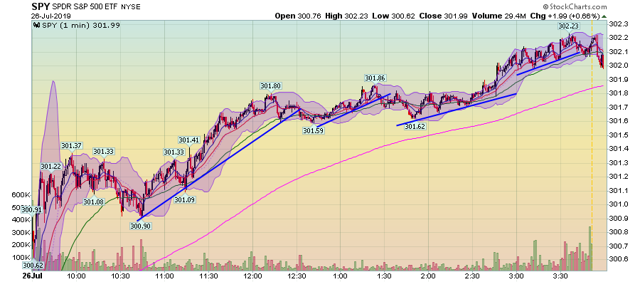
SPYs also had a strong move higher, although the chart is dominated by a number of shorter upward trends.
Let's take a look at this week's charts:
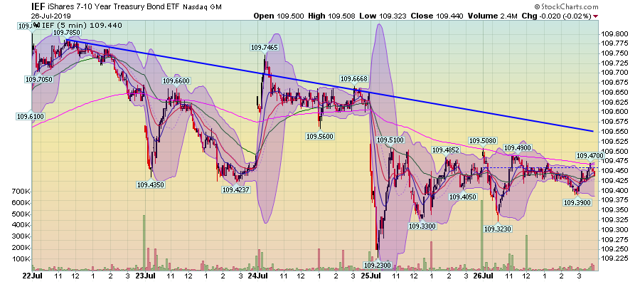
The IEF (the 7-10 year Treasury market ETF) had a modestly lower trend ...
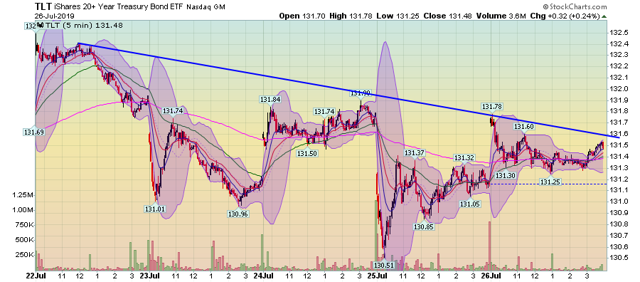
... as did the long-end of the Treasury market.
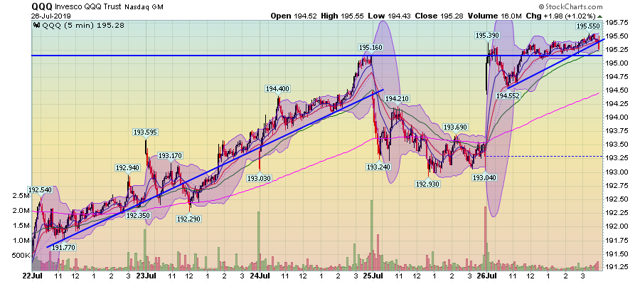
The equity market ETFs were higher on the week:
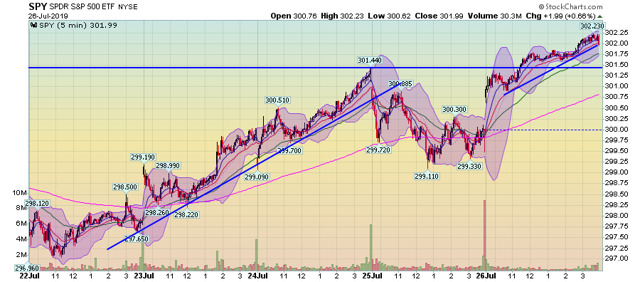
Both the QQQ (top chart) and the SPY (bottom chart) have similar charts. Each rallied on Monday-Wednesday, sold off on Thursday, and rallied to a near-weekly high on Friday.
The small-cap indexes, however, are still a bit weaker:
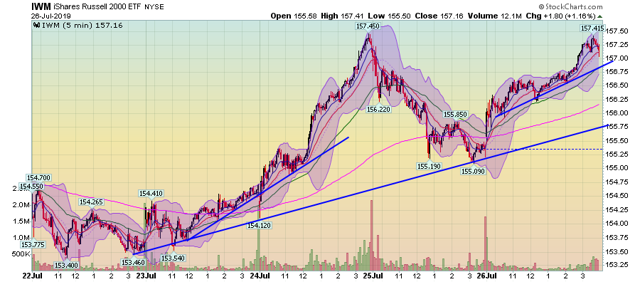
The IWM came just shy of making a new high on Friday, but fell a touch short ...
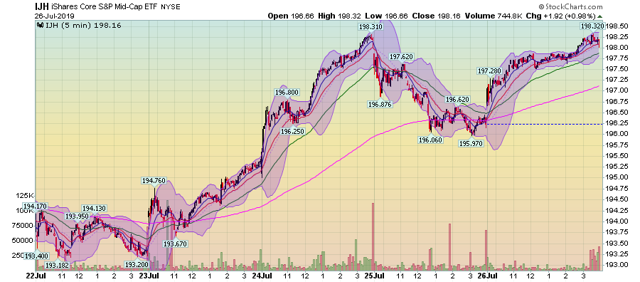
... as did the IJH.
As for the 30-day charts, there is another divergence in trend.
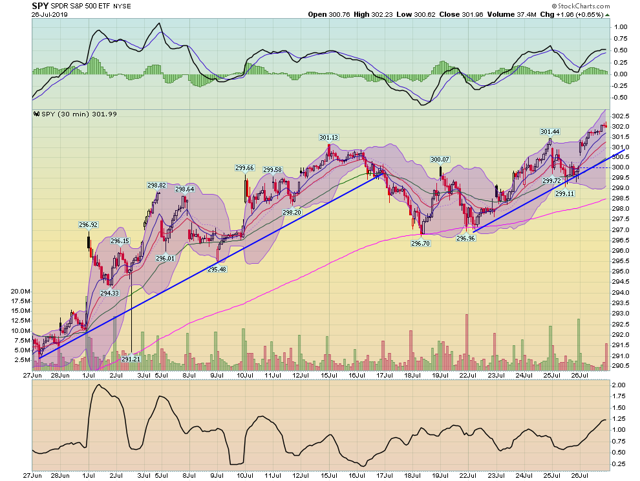
The SPY (above) and the QQQ (not shown) are in strong uptrends with two distinct moves higher.
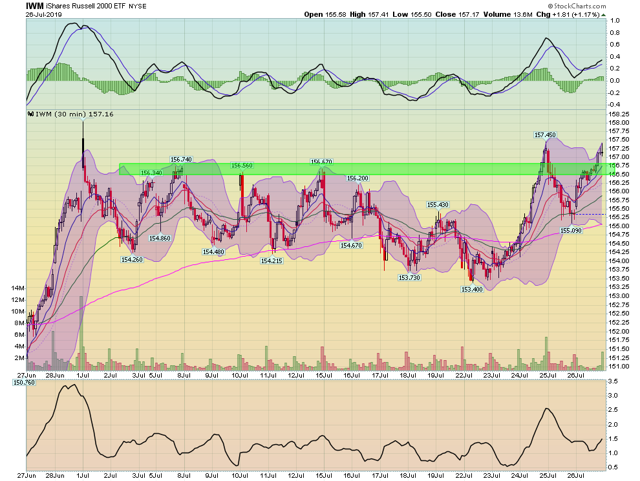
Meanwhile, the smaller-cap indexes have charts that are closer to double-top formations.
So -- where does that leave us as we head into the weekend? I'm still short-term (1-2 week) bullish. Today's GDP news showed the US economy was still chugging along, despite no support from business investment and exports. Housing is in good shape as well. While the GDP news probably took the Fed off its rate-cutting for now, that is in the market's back pocket.
However, the underlying weakness in the GDP report -- the lack of business spending and contraction in exports -- plays into a longer-term bearish conclusion. It's pretty obvious that the trade wars have seriously dented business sentiment, which means the investment is probably going to be weak in the third quarter. With no let-up in the trade war in sight, it's hard to see third-quarter growth being much better. And with the continued drum-beat of bearish international news, it's hard to not only see weak growth but increased downside risk.

