Summary- The coincidental economic numbers are in good shape.
- St. Louis Fed President Bullard continues to reside on the dovish side of policy.
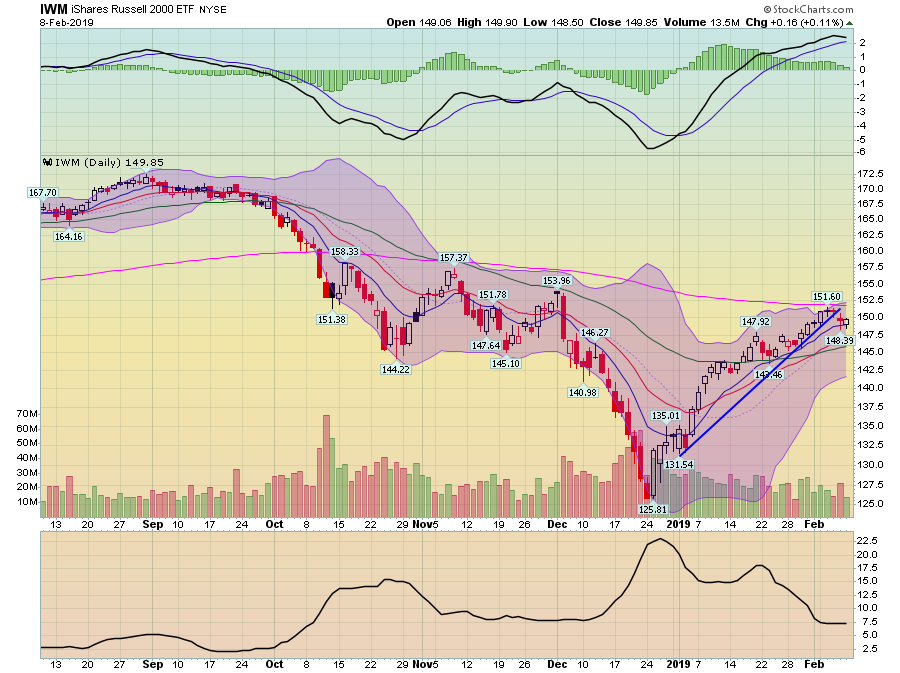
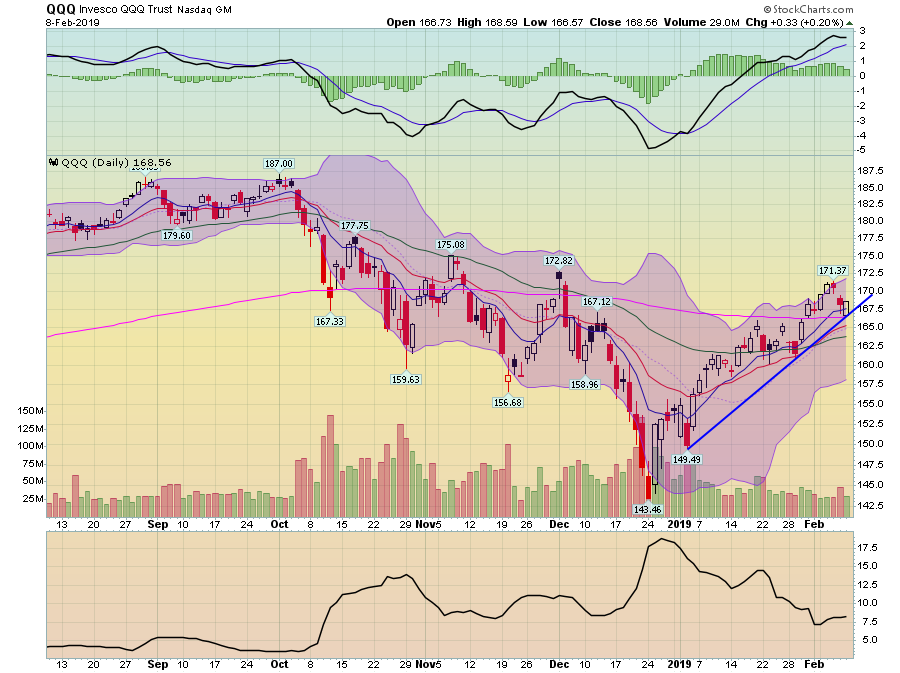
- Equity markets have broken short-term uptrends on the daily charts, meaning a consolidation right around the 200-day EMA is in order.
Let's review some of the major economic numbers and central bank activity this week:
- The Census reported that durables goods orders declined .6%. The ex-transportation numbers have been weak for the last three months (.3%, .2%, -1.2%). The report also contained a sharp 2.5% decline in consumer goods orders.
- The Bank of England released the latest Inflation Report which contained a sharp decline in projected UK growth.
- The Bank of Russia maintained rates at 7.75%.
- The RBA kept Australian rates at 1.5%. In a speech later in the week, RBA Governor Lane said that the future policy direction was evenly balanced between rate increases and decreases.
- The auto industry continues to weaken. From the latest Markit Economics industry survey:
- The downturn in the global output of automobiles and parts seen during the final quarter of 2018 continued at the start of 2019. The rate of contraction gathered pace to the strongest since August 2015. Moreover, new orders in the sector fell at the fastest rate in nearly six years.
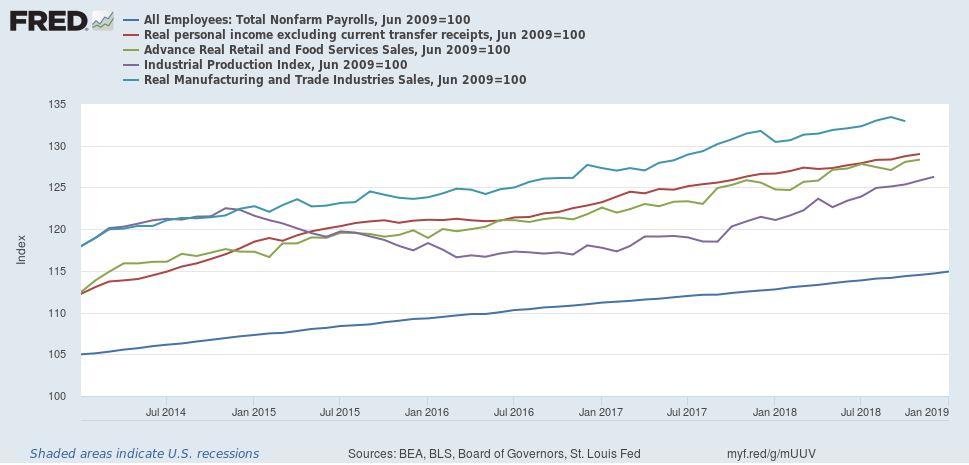
The coincidental indicators are still in good shape:
I've converted all five to a base 100 and used the end of the last recession as the starting point. All are still in solid uptrends. While there is some weakness in the leading indicators (primarily from the yield curve), that has not bled into the coincidental numbers yet.
St. Louis Fed President Bullard on monetary policy (emphasis added):
Market-based signals such as low market-based inflation expectations and a threatening yield curve inversion suggest that the FOMC needs to tread carefully going forward," Bullard said. "Through its normalization program, the FOMC has already been sufficiently pre-emptive over the last two years to contain upside inflation risk.
Bullard has been one of the more dovish Fed members for some time. In fact, I can't think of him being anything but dovish during this expansion. Bullard's speech continues the move to a more dovish stance from Fed President since the beginning of the year.
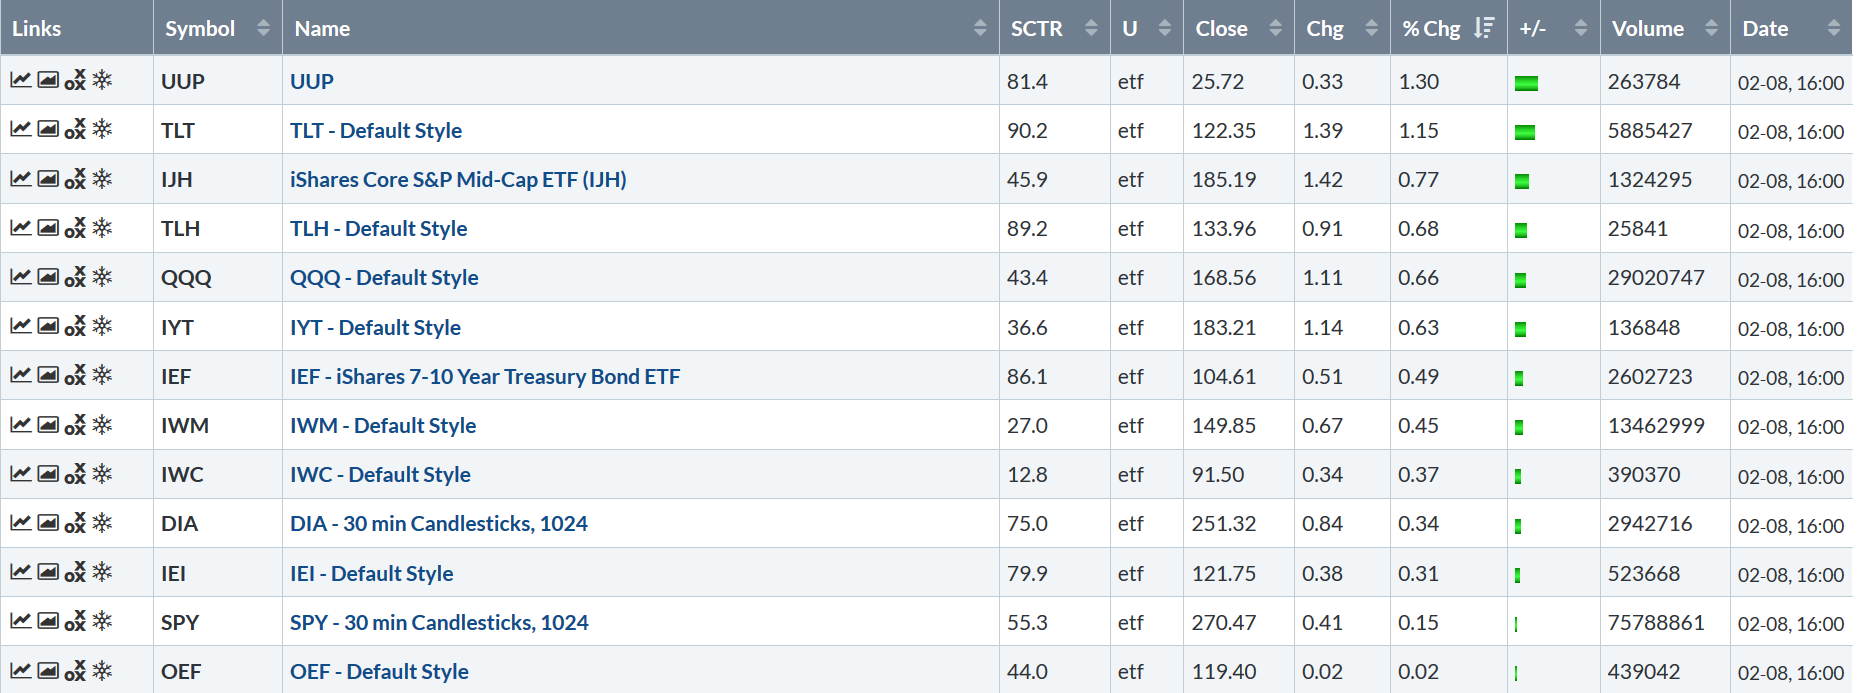
Let's turn to the markets, starting with this week's performance table:
Despite this week's negative headlines, the markets were modestly higher. But that statement belies the very messy weekly data. The dollar was the best mover this week, followed by the long-end of the Treasury market. The mid-caps were the third-best performer, followed by the 10-20 section of the curve. If long-bonds are out-rallying most equity markets, you're in a defensive situation. Most of the indexes were only marginally higher. Most importantly, the charts show a less than stellar situation:
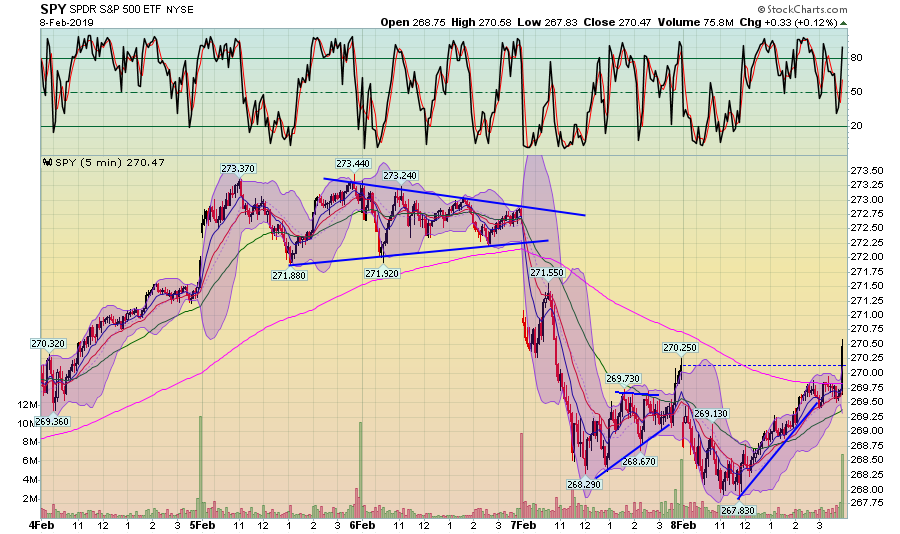
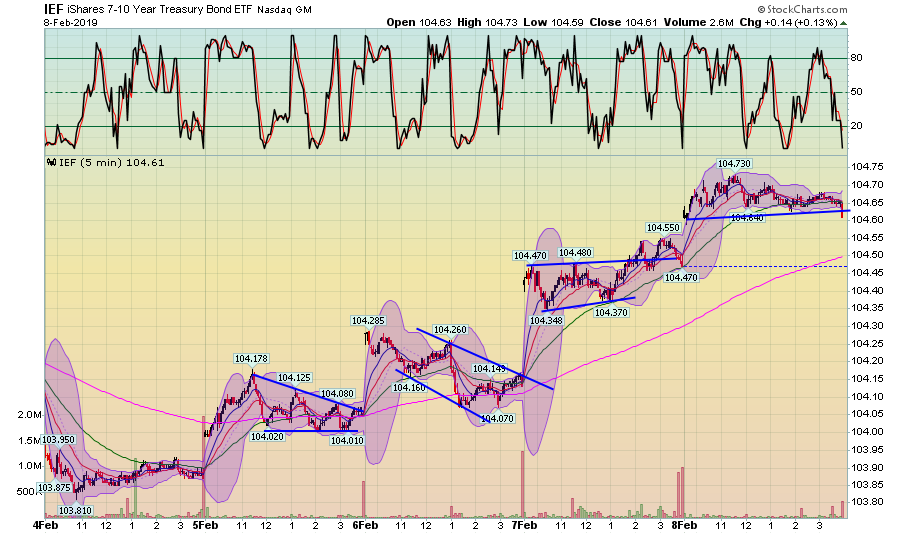
The 5-minute SPY chart shows that the index was technically higher, but only because of a large spike at the end of trading on Friday. Prices consolidated in a triangle pattern on Tuesday and Wednesday then gapped lower on Thursday. The market found a bid in the upper-267/lower-268 level on Thursday and Friday. Both days also saw an end-of-session spike, indicating some level of confidence going into the next session. However, this chart is not bullish, which is supported by IEF's weekly five-minute chart:
The Treasury market continued to rise throughout the week, gapping higher at the beginning of each trading session. Prices drifted lower on Wednesday, but on all other days, they maintained their opening level. And the overall trend of the chart is clearly upward.
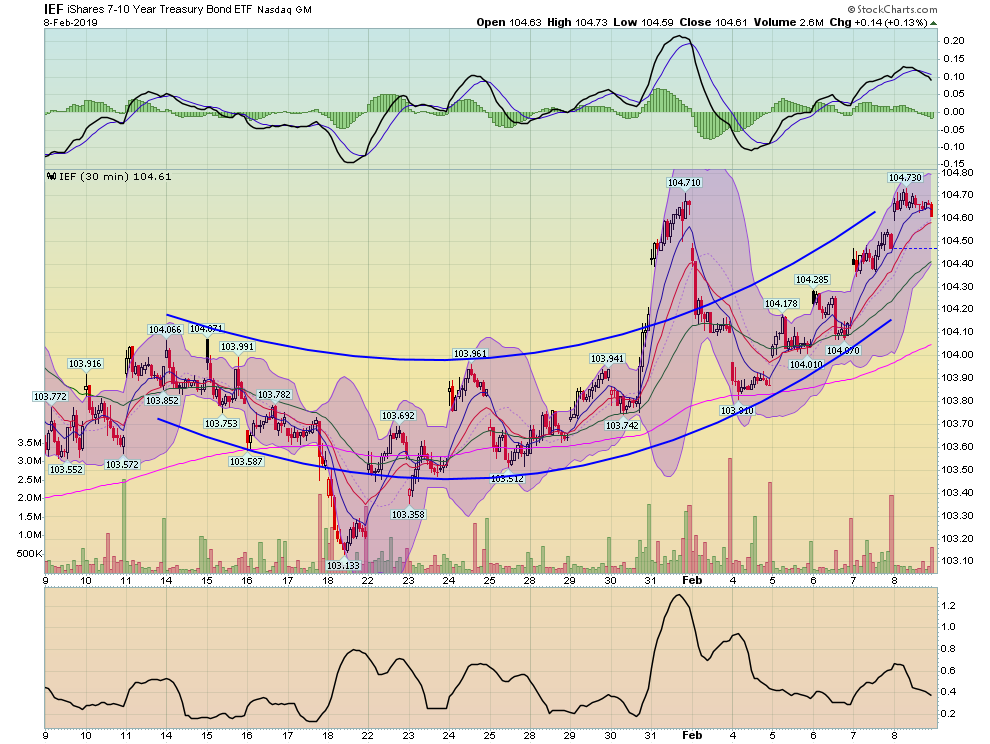
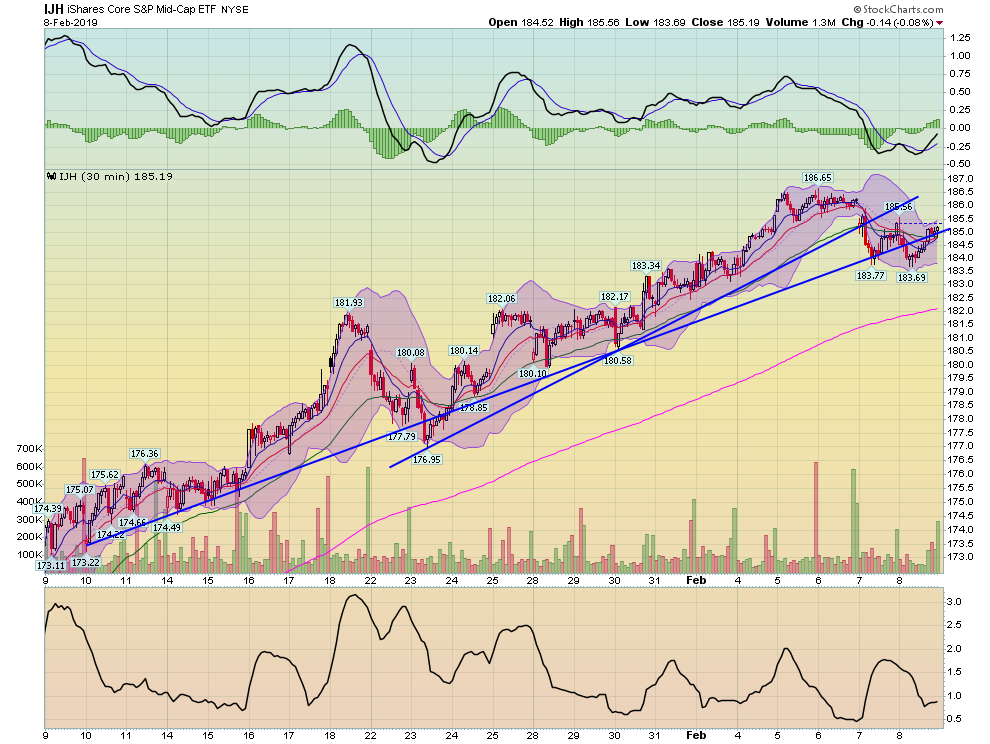
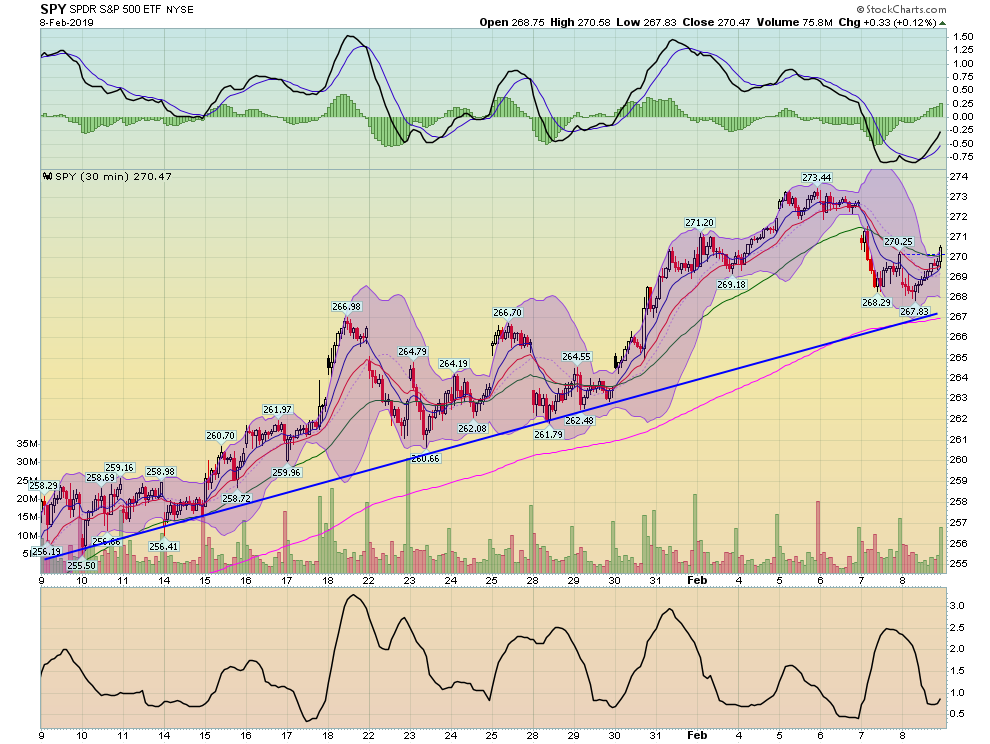
We're starting to see some weakness on the 30-day charts as well. Let's start with the Treasury market:
While there is no clear trendline, the overall movement is the best seen in the moving averages. This tells us that trading is taking on a modestly defensive tone.
While the mid-caps are clearly moving higher, there isn't a good trend line connecting multiple lows. Thursday and Friday took the index either below a short-term trend line or right to longer support.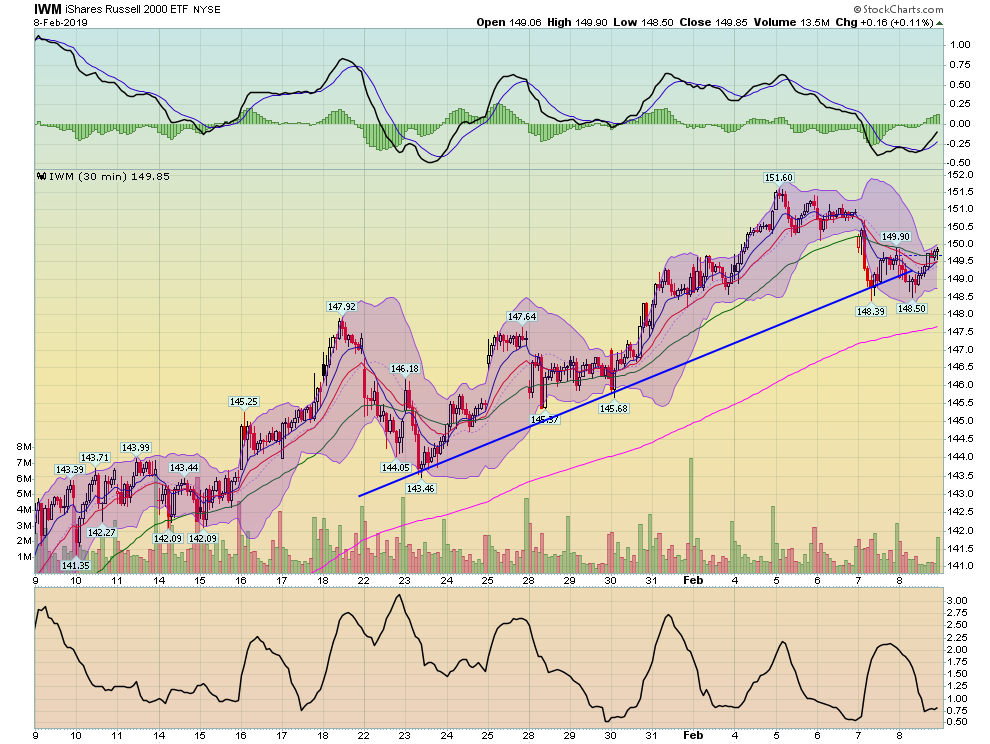
IWM is also right at short-term support. It moved below its trend line twice in the last two trading sessions.
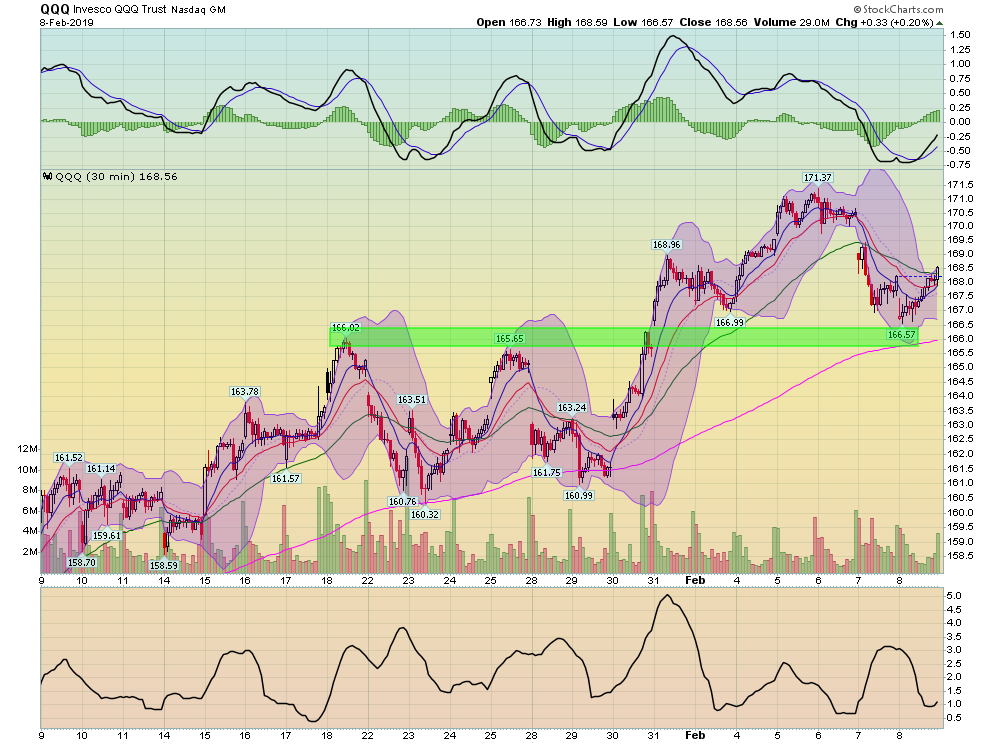
Despite its strong advance over the last month, QQQ really don't have a solid uptrend. Prices have fallen to the 166-167 level where there is a fair amount of short-term support.
SPY is still in an uptrend. But there is definitely a short-term weakness.
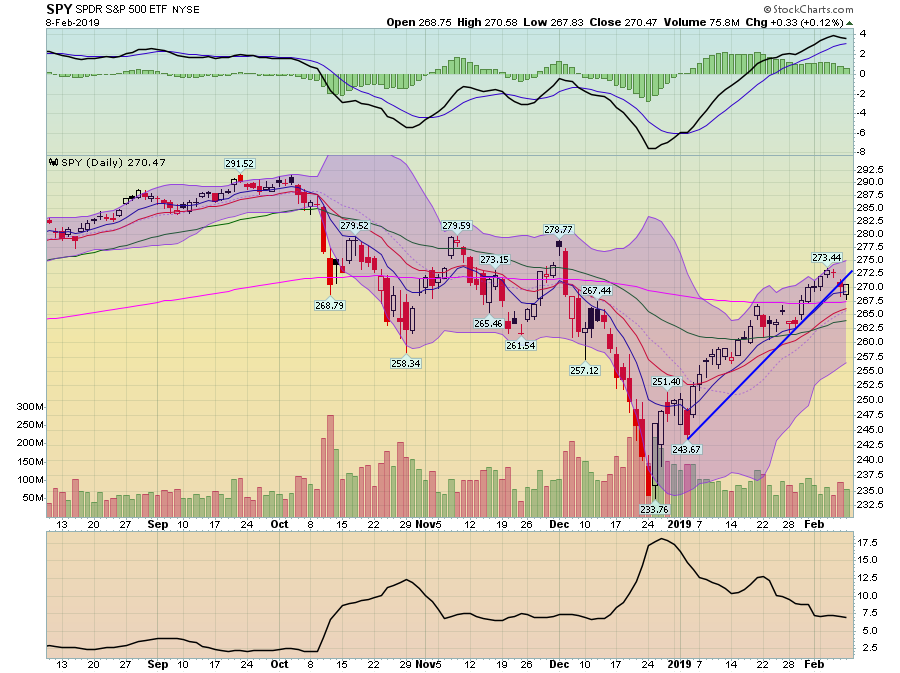
And there are clearly trend-breaks on the daily charts:
SPY broke its uptrend on Thursday. Now the likely target is the 200-day EMA.
IWM broke with Thursday's well-off as well. Prices now sit at the 10-day EMA.
QQQ is right at support.
So - what does all this mean? Prices are now above the 200-day EMA on the daily charts, which means it's not surprising that we'd see a trend break and a test of the 200-day EMA before an additional move higher. At least, that's the technical picture. But the fundamental data is murkier. While the coincidental numbers are still very strong, the leading indicators have been a bit weaker for the last 5-6 months. While the yield curve's overall flattening is the primary reason, there's been diminished housing activity followed by this week's weak print of consumer purchases. Add to that the government shutdown along with contentious global trade talks and a consolidating pause seems in order.
Disclosure: I/we have no positions in any stocks mentioned, and no plans to initiate any positions within the next 72 hours. I wrote this article myself, and it expresses my own opinions. I am not receiving compensation for it (other than from Seeking Alpha). I have no business relationship with any company whose stock is mentioned in this article.

