Technically Speaking For The Week Of February 18-22Summary
- The news has been disproportionately bad over the last few weeks.
- Global equity markets are higher over the last few months, as is the U.S. Treasury market.
- The indexes were modestly higher this week.
My commentary has had a bearish tone over the last few weeks. But, there's a reason for that - the news has been bad. Consider this tweet from David Rosenberg:
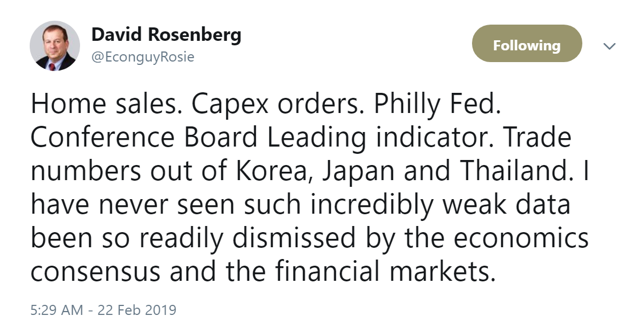
Housing is sluggish while new orders for non-transportation goods have declined in four of the last five months. A Chinese slowdown sent Japanese export numbers down sharply in the latest report. Retail sales and industrial production - two of five coincident indicators - declined in the latest releases. The yield curve is still narrow and parts of the belly of the curve have inverted. This represents a wide swath of negative data that should concern everybody.
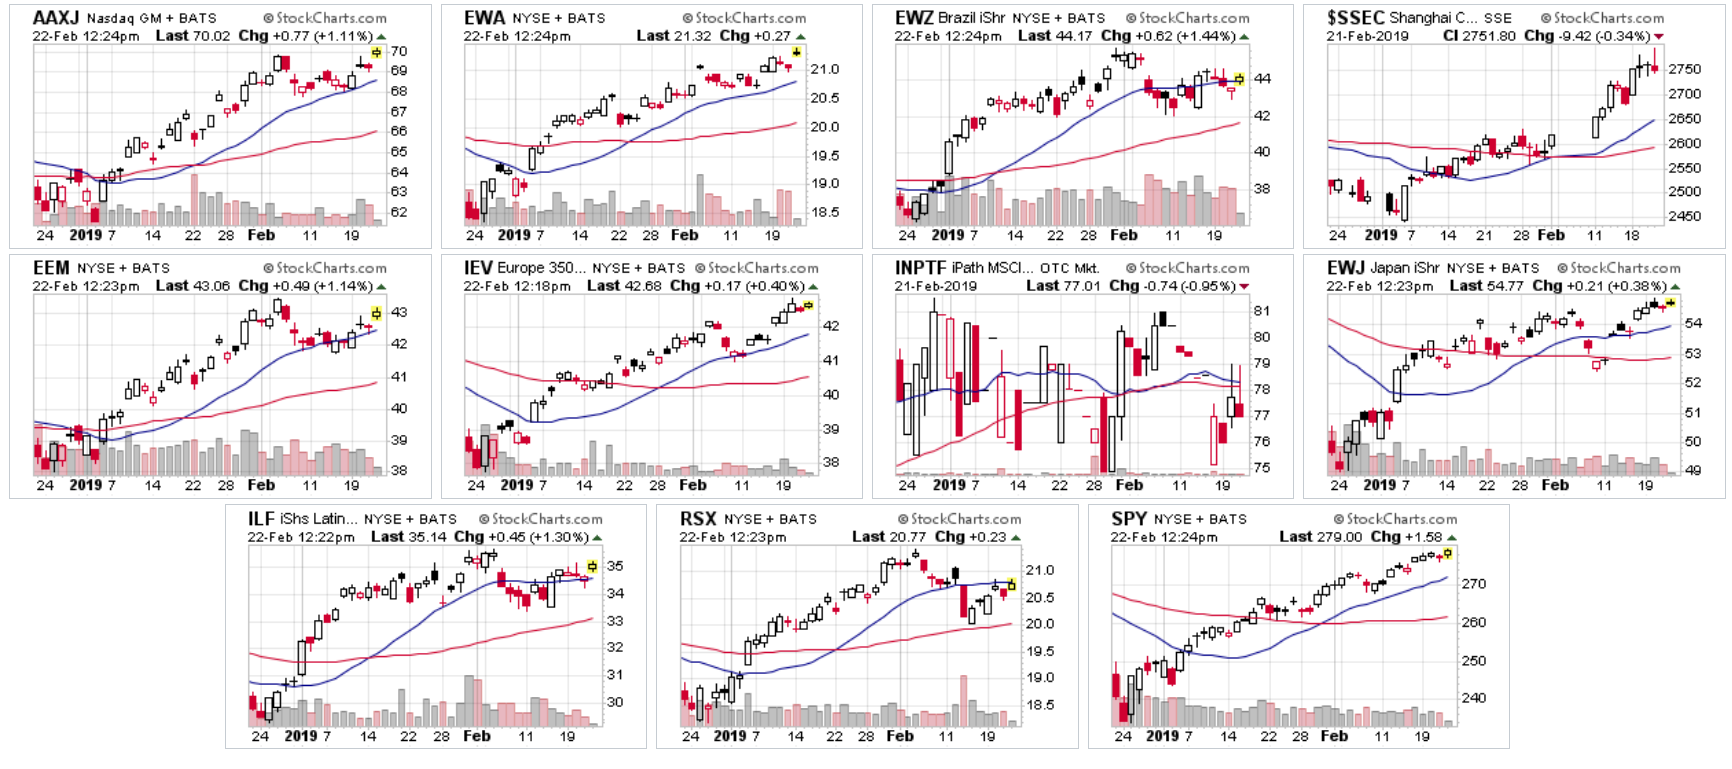
Despite the weak data, global markets are up over the last two months:
Above are two-month charts of ETFs that track the major global equity indexes. All are up over that time period, with the exception of the Latin American ETF. Markets are leading indicators, which means traders may be thinking that the recent spake of weak data is a temporary development.
The Treasury market is also higher over the last six months:
ETFs that track the entire yield curve started to rally in early November. All are now near 6-month highs. While the Treasury and equity markets aren't supposed to be perfectly inversely correlated, a level of inverse trading is to be expected. When these markets move in tandem, it usually ends up with one of them losing.
The indexes were up this week. Micros rose 1.51% while the Russell 2000 increased 1.27%. Treasuries were off modestly. Utilities were the top performing industry, gaining 2.39%. Basic materials and tech rounded out the top three, gaining 2.35% and 1.41%, respectively.
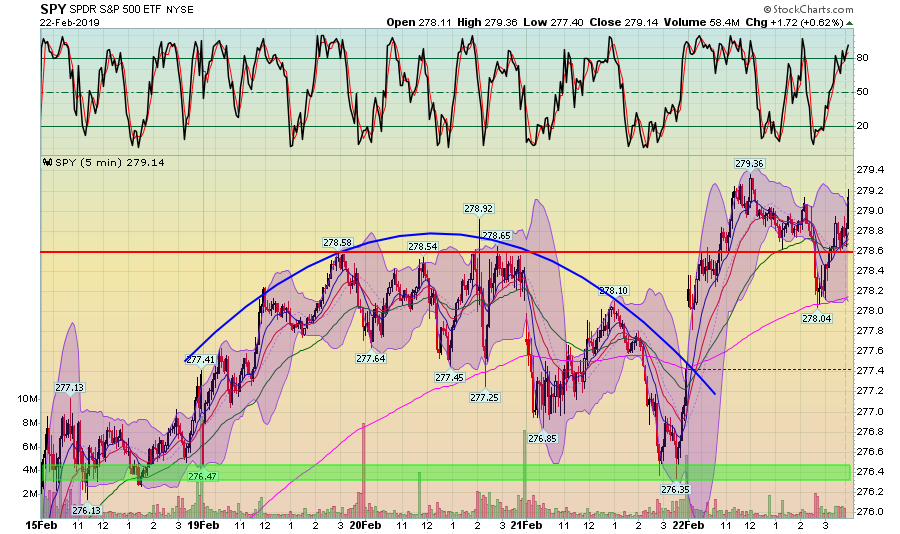
Let's start by looking at the charts for this week, starting with the SPY:
This isn't the strongest of charts. Prices went sideways on Monday and then did a round-trip mid-week. Prices gapped higher at the open on Friday then spent the rest of the day trading around the 278 level which was a prominent high mid-week. Yes, prices gained. But the rally is pretty ugly; there's a fair amount of downtrend on the chart as well.
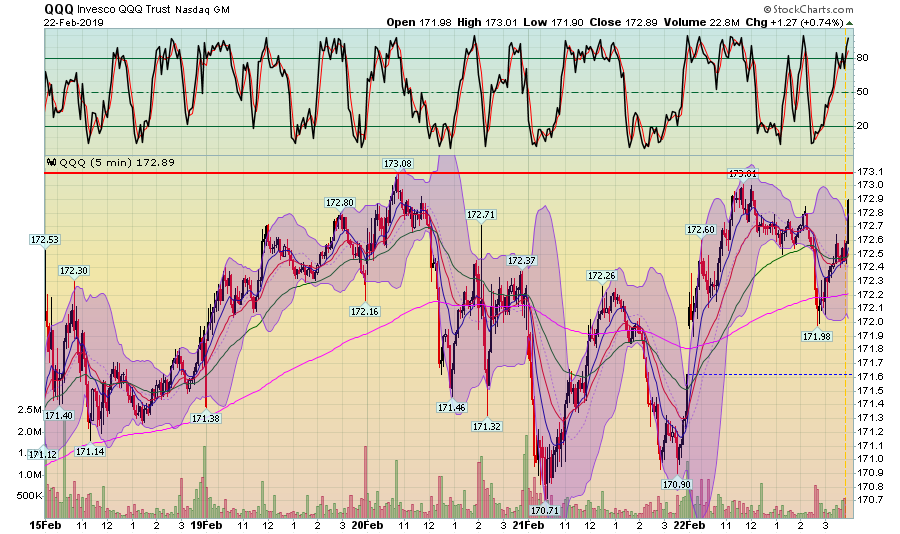
The QQQ chart adds to the concern. Again, prices are higher on the week. But, after falling on Wednesday and Thursday they couldn't get beyond highs from earlier in the week. Ultimately, this is more of a sideways than rally pattern
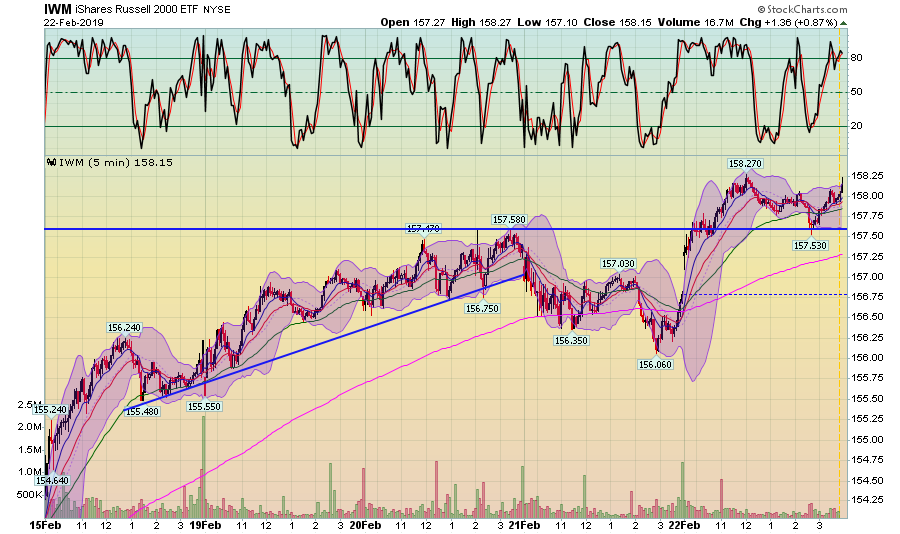
The IWM is the only solidly bullish chart of the three. Prices rallied solidly through Wednesday's close. They sold-off on Thursday but came back on Friday, ending the week solidly higher.
The 30-day charts reveal a somewhat brighter picture.
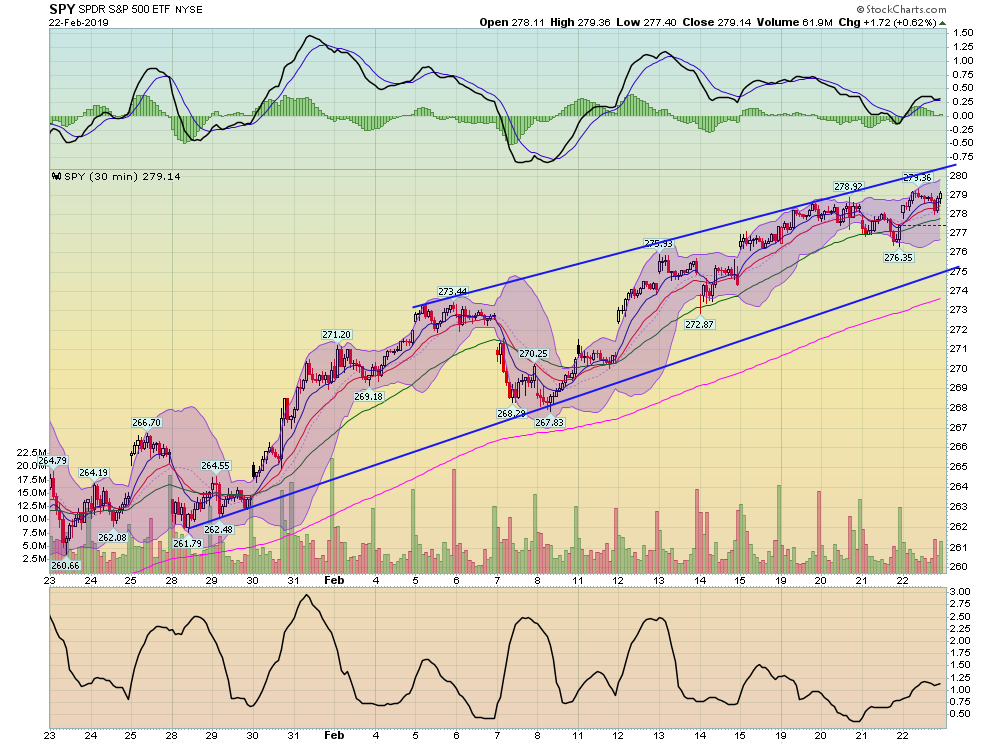
The SPY remains in a solid uptrend with prices trading near the top of its channel.
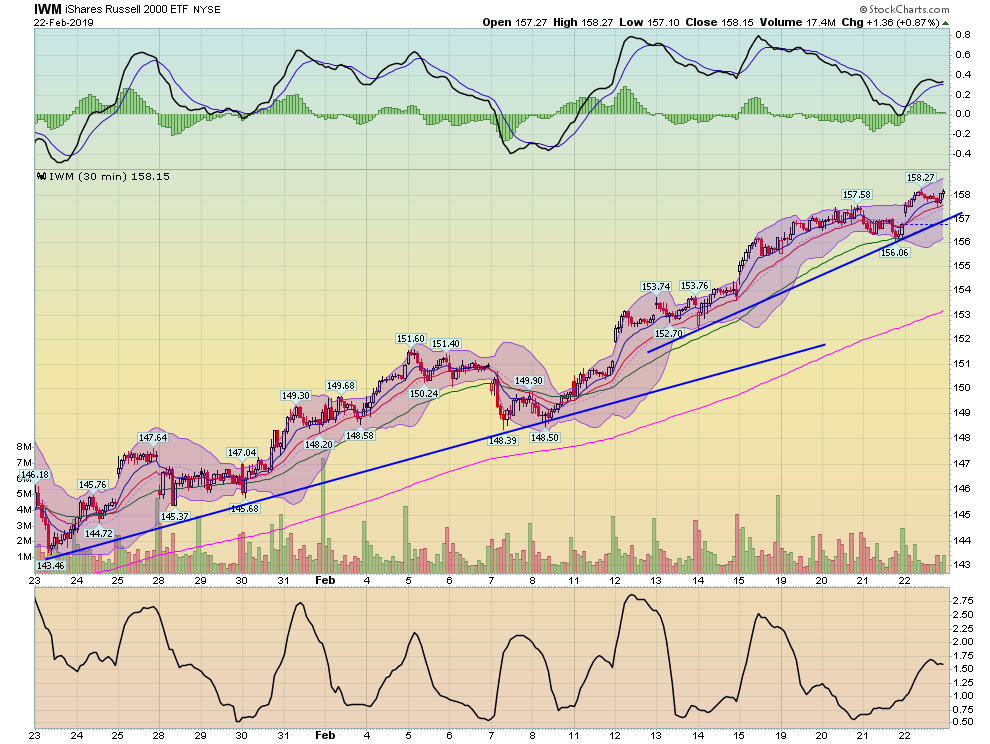
And the IWM is also in a solid uptrend.
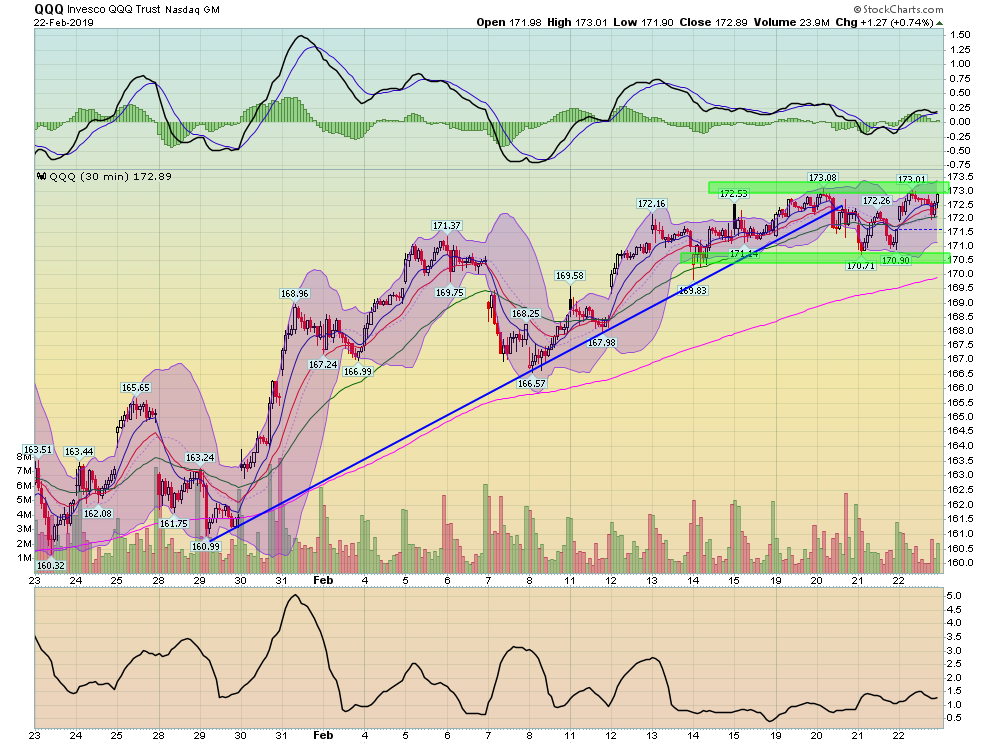
Once again, the QQQ is the problem child. Prices rallied from late January to mid-February. But they broke the trend this week and are now trading sideways between 170-173. This could be a simple consolidation. But considering tech's performance this week (it was the third best performing ETF), you'd think the QQQ would have risen a bit more.
Ultimately, the markets are still in good shape. Two of the major indexes are in solid rallies which means the third could simply be consolidating gains while it awaits a cue from the other two indexes.
Until Monday, have a safe weekend.
Disclosure: I/we have no positions in any stocks mentioned, and no plans to initiate any positions within the next 72 hours. I wrote this article myself, and it expresses my own opinions. I am not receiving compensation for it (other than from Seeking Alpha). I have no business relationship with any company whose stock is mentioned in this article.

