Summary
- Chicago Fed President Evans is now in the "wait and see" camp.
- Oil is bouncing back.
- Prices ended the week on a modestly positive note.
Count Chicago Fed President Evans among the "wait and see" crowd (emphasis added):
If the downside risks dissipate and the fundamentals continue to be strong, I expect that eventually the fed funds rate will rise a touch above its neutral level—say, up to a range between 3 and 3-1/4 percent. This range is higher than the 2-3/4 percent long-run neutral level in the median forecast of the FOMC’s December Summary of Economic Projections.
That’s eventually. What about the timing? Because inflation is not showing any meaningful sign of heading above 2 percent in a way that would be inconsistent with our symmetric inflation objective, I feel we have good capacity to wait and carefully take stock of the incoming data and other developments. If they warrant meaningful adjustments to my modal outlook or the balance of risks to the economy, then I would change my views of the appropriate path of policy accordingly.
The last batch of Fed speeches have all expressed a unanimous sentiment: wait. The rationale may be different. Some governors have focused on lowered inflation while others have highlighted increased volatility and international economic uncertainty. But regardless of the underlying reason, the Fed now appears unified in pausing.
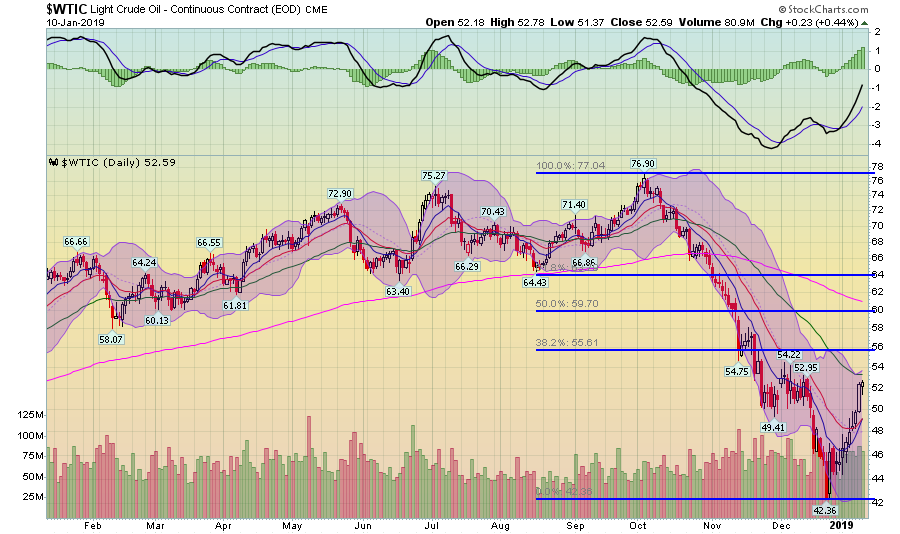
Oil is bouncing back:
Prices have rallied from an absolute low of 42.36 to 52.59 (yesterday's close) for a 21% rally. On the bullish side, prices have moved through the 10 and 20-day EMA on rising momentum. On the bearish side, there's a cluster of recent technical traffic in the lower to mid-50s while two key technical levels -- the 50-day EMA and 38.2% Fibonacci level -- await the current rally. The long-term trend (as represented by the 200-day EMA) is lower. While OPEC production cuts are decreasing supply, weaker global growth is lowering overall demand. Given the sum total of factors, it's difficult seeing prices rally to previous levels in the upper 60s and above.
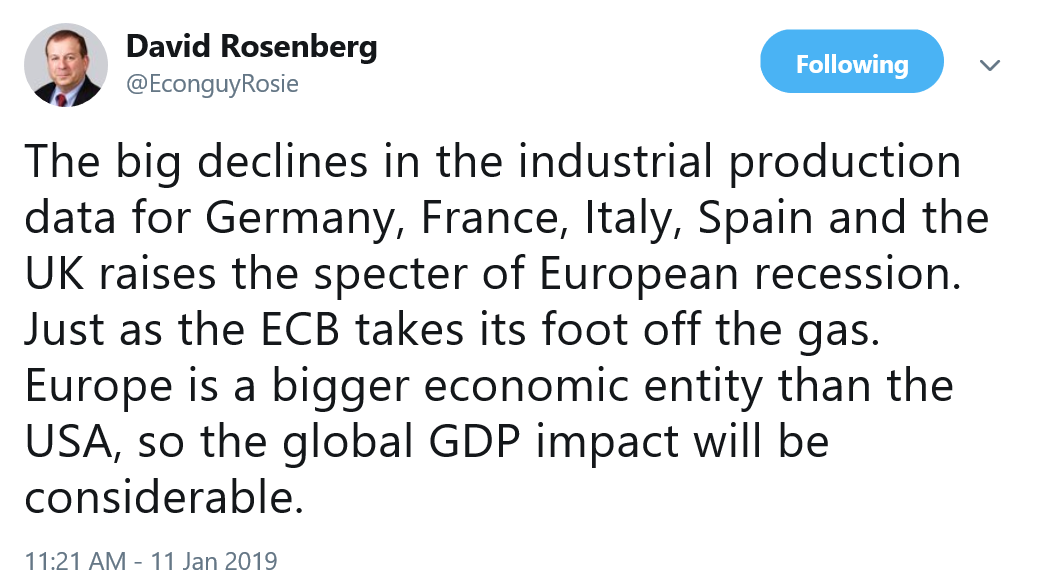
From my Twitter Feed:
French industrial production has declined for the last three months; it was down 2.1% (Y/Y) in the latest report. Italian industrial production dropped by 2.6% (Y/Y); Spain's dropped by a similar amount (Y/Y). Germany's was down 4.7% (Y/Y). These are not good numbers and, as Rosenberg notes, they could well indicate a recession.
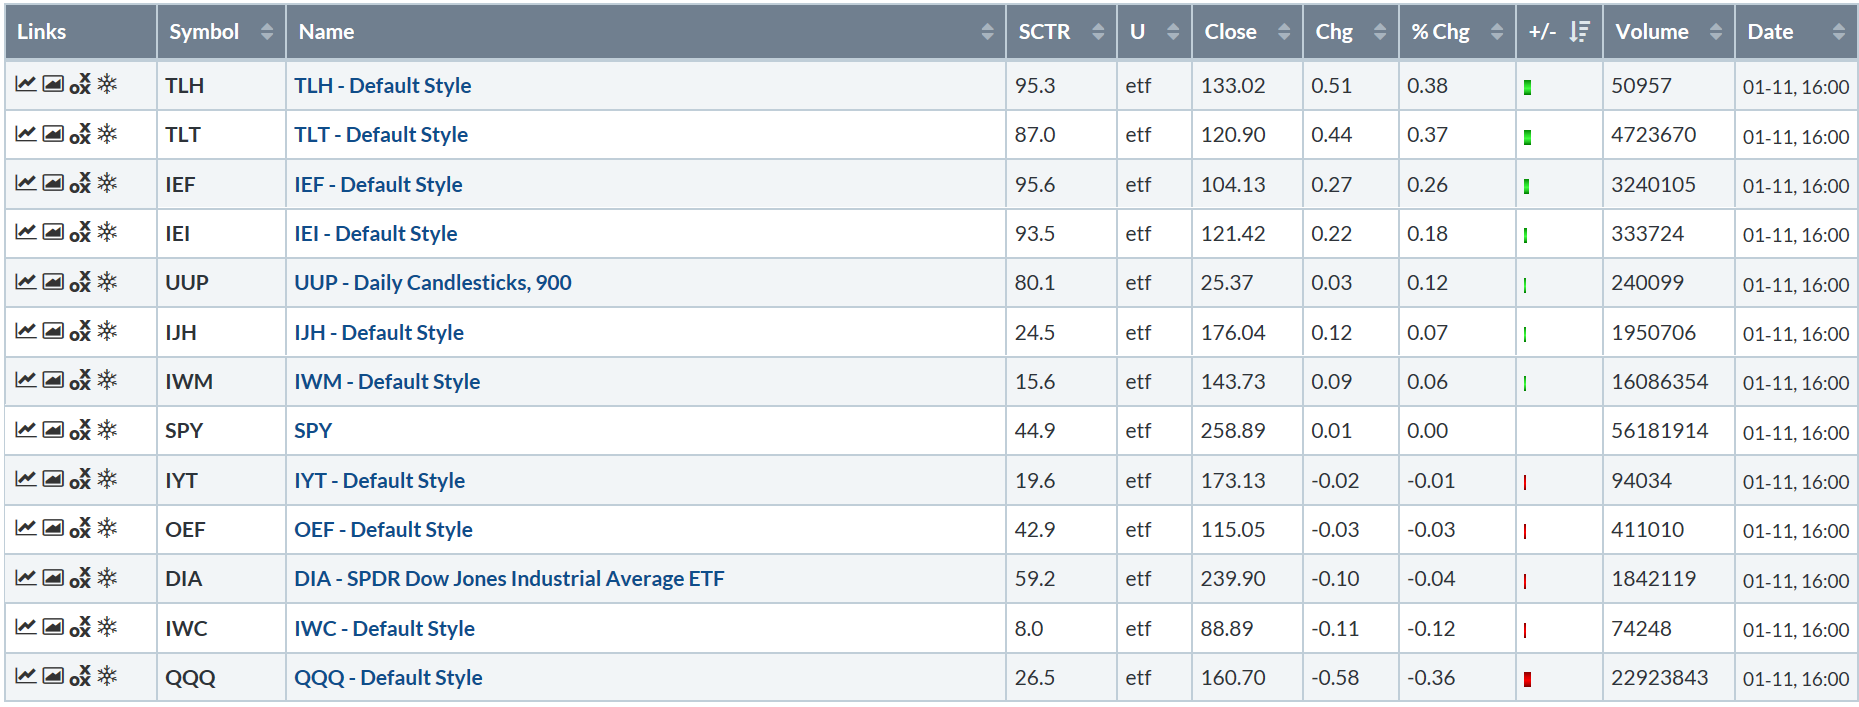
Let's move to today's performance table:
As down days go, I'll take it. Yes, the indexes were lower, but only modestly. Six indexes had a percentage gain right around 0%. Considering some of the major down days we've had over the last few months, this isn't bad at all. Treasuries were up modestly.  For the second day in a row, the industry performance table was defensive, with healthcare, real estate, and staples leading the pack. The energy sector was the worst performer, which is a bit odd considering the oil market has been on a tear these last two weeks.
There remains a lot to like in the charts:
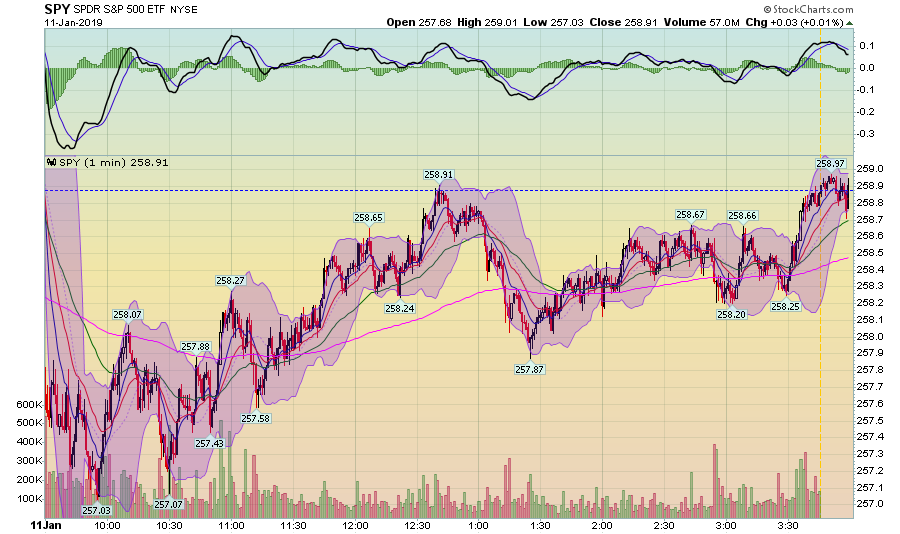
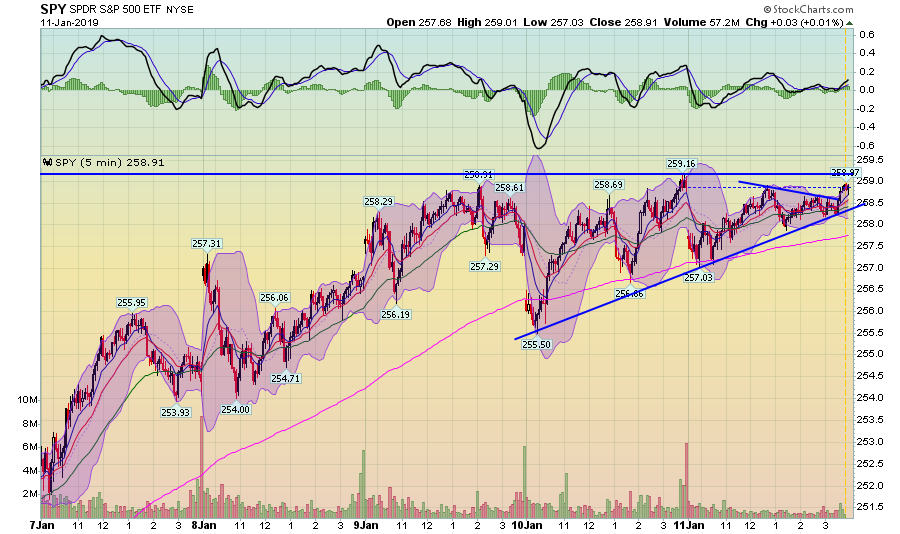
Today's trading range was only a few points; which, considering the higher volatility we've seen lately, is a plus. Prices gapped lower at the open but spent the morning moving higher, hitting resistance at yesterday's close. They sold-off to the 50% retracement area and rallied again, closing near daily highs. There are two solid rallies on today's chart. And the bulls stepped in after an opening gap lower.
The 259 level has provided resistance three times this week. Prices are pulling back to higher and higher levels before making another run at resistance. There's an upward sloping trend line connecting lows from the last two days. At the end of today's trading, prices broke through resistance. The 200-minute EMA is still on an uptrend. There's a lot of bullishness here.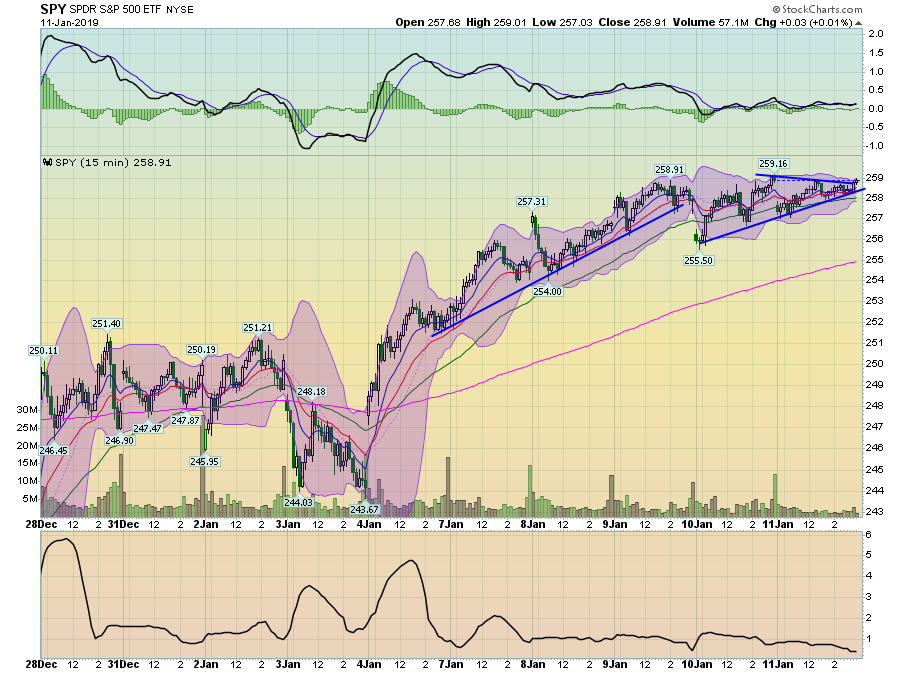
The 2-week chart really places the consolidation pattern into clearer perspective. Prices have been rallying since January 4. Their pace of increase has decreased. Now they're consolidating gains.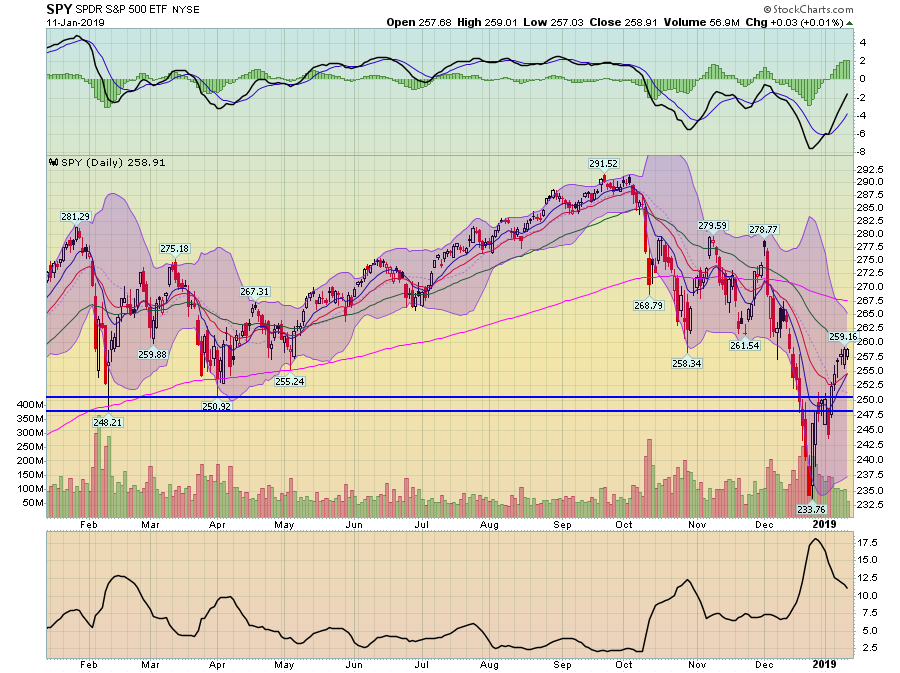
On the daily chart, we've had three prints with a 257.5-258 locus. Prices are right below the 50-day EMA. The shorter EMAs are moving higher and the 10 is about to pull above the 20. While momentum is still negative, it is rising.
This isn't a bad place to end the week. After gapping lower at the open, prices rallied to the point where they were more or less unchanged on the day. Prices are consolidating gains in a few time frames. Momentum is slowly shifting on the daily chart. Given what we've had over the last few months, I'll take it.
Disclosure: I/we have no positions in any stocks mentioned, and no plans to initiate any positions within the next 72 hours. I wrote this article myself, and it expresses my own opinions. I am not receiving compensation for it (other than from Seeking Alpha). I have no business relationship with any company whose stock is mentioned in this article.

