Summary
Believe it or not, Greece isn't doing that badly. Annual GDP growth turned positive in 3Q16 and has been consistently positive since 2Q17. The unemployment rate has declined from 27% in 2014 to 17% in the latest report. The Manufacturing PMI has been above 50 for the last 12 months, which has supported positive industrial production growth on a Y/Y basis in eight of the last twelve months. Only retail sales are still showing weakness; they have declined on a Y/Y basis in seven of the last twelve months. Obviously, the country still has a long way to go as evidenced by its still-high unemployment rate. But all-in-all, the economy is clearly on the right track. (Data from tradingmarkets.com)
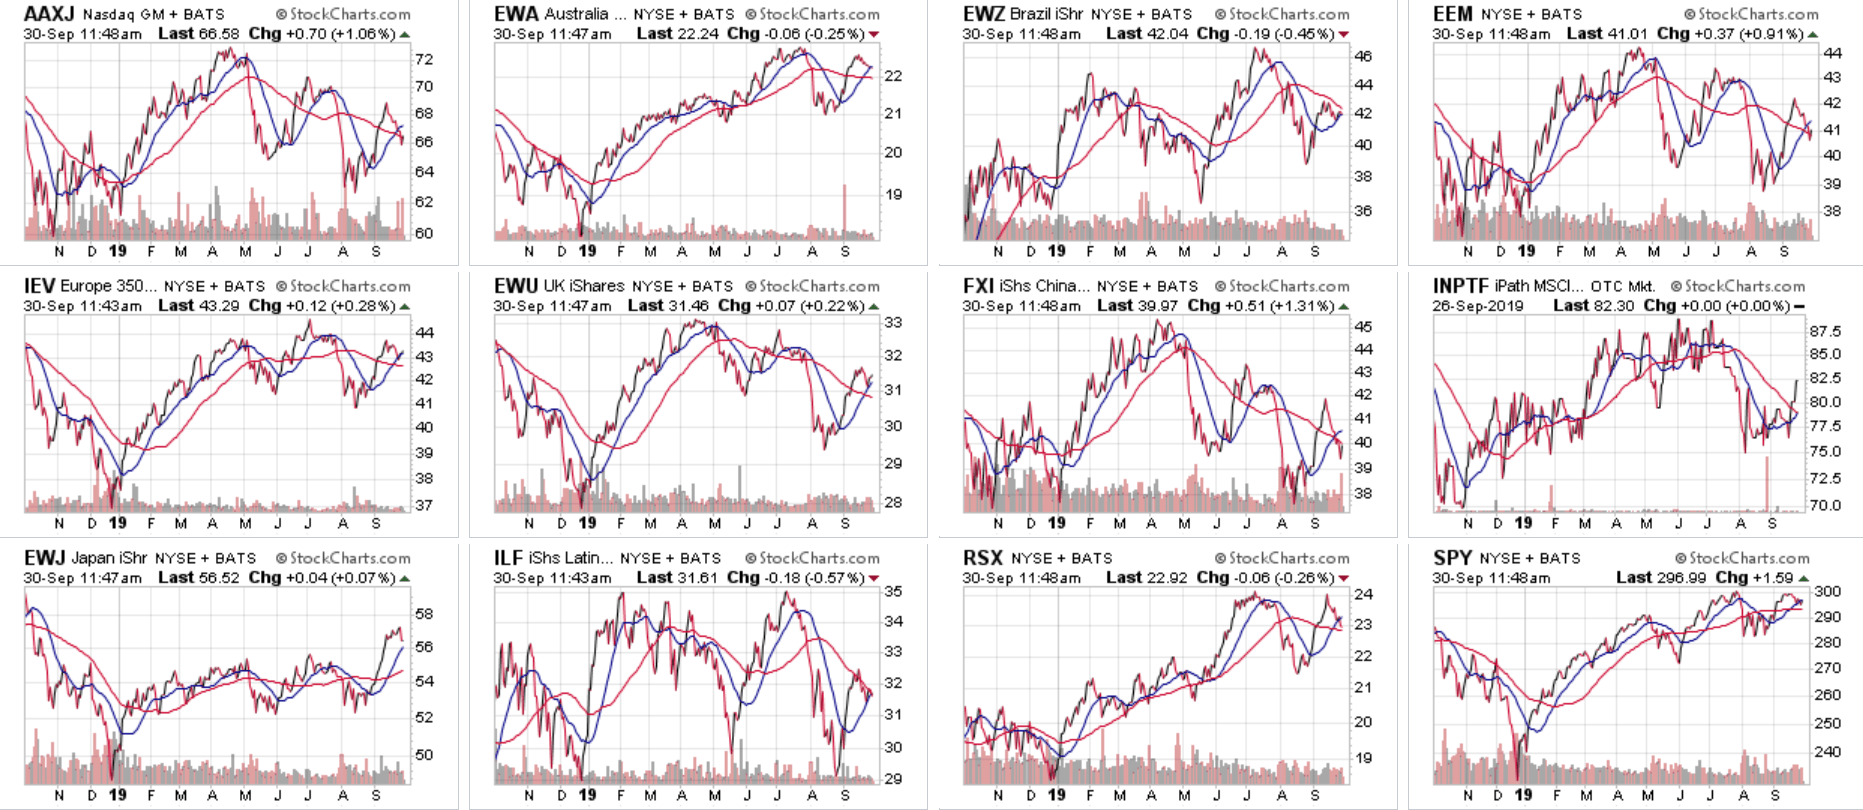
Global equity markets -- which are a leading economic indicator -- are in fair shape:
Above are 12 ETFs that track a majority of the globe's stock markets. Several (All Asia less Japan in the upper left; emerging markets on the upper right; China which is second from the right on the middle row;) are trending lower but in a managed manner. Latin America (lower row, second from the left) has had the hardest time. But Europe (middle row, far left) is still holding up despite weakening economic fundamentals while Japan (lower row, far left) has recently increased. Overall, things could be much worse, especially considering the continued weakening of global trade.
With the employment report coming out on Friday, it seems appropriate to spend some time this week looking at various measures of this most important coincidental economic indicator. Let's start with two points from the household survey: the employment/population ratio and the participation rate:
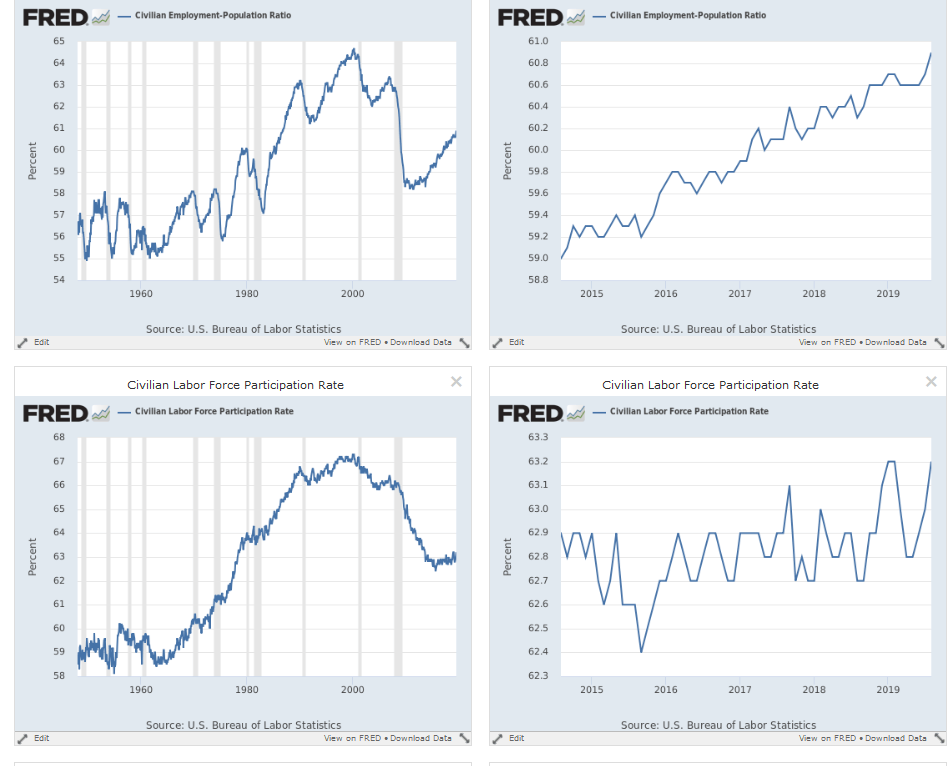
The top two charts show the employment/population ratio; the left chart places the data into historical context while the right chart shows the last five years of data. Although the number is still low by historical measures (left chart) it continues to make consistent gains (right chart) indicating people continue to come from the sidelines back into the labor market. However, the labor force participation rate is just starting to make upward headway (see chart on the right).
Let's turn to today's performance table:
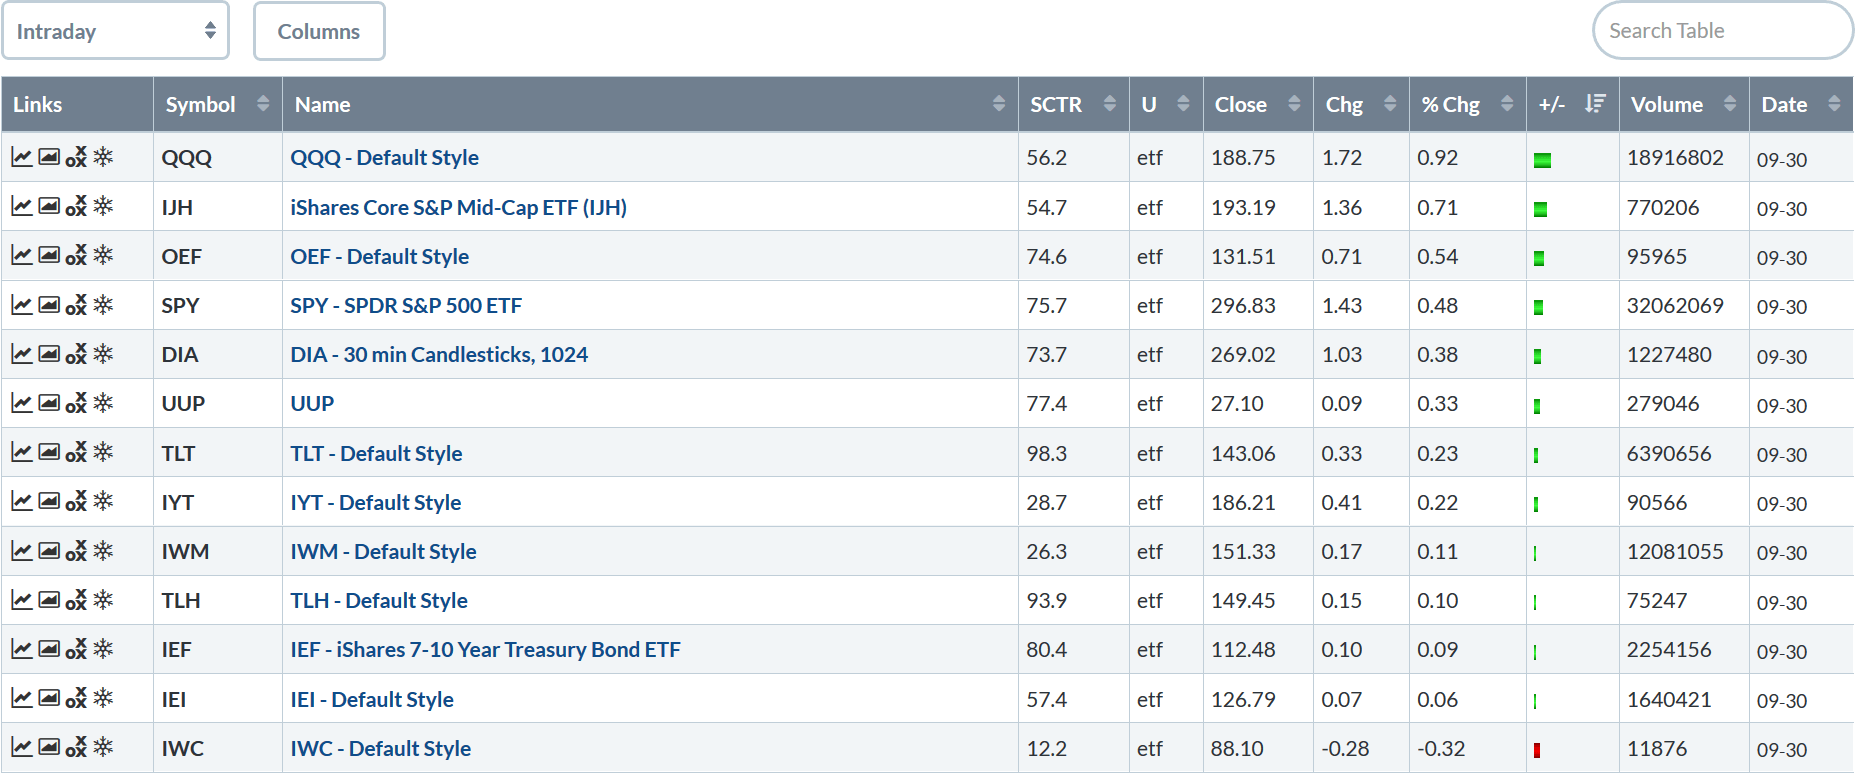
The above table is a bit deceptive. The Invesco QQQ Trust (NASDAQ:QQQ) was up nearly 1% -- an obvious overall plus. But the performance of the other equity markets drops off after that: the IJH rose 0.71%, the OEF gained 0.5% which was followed by the SPY (NYSE:SPY) and DIA. To make the interpretation a bit more confusing, the Treasury market also rose, taking away some of the meaning behind the equity indexes gain. The table isn't bad, but it's not great either.
Yesterday, I noted that the markets continued to fade from recent highs. What we're looking for right now is to see if the shorter time frame charts are showing an overall continuation of that patter or a reversal back to challenge recent highs.
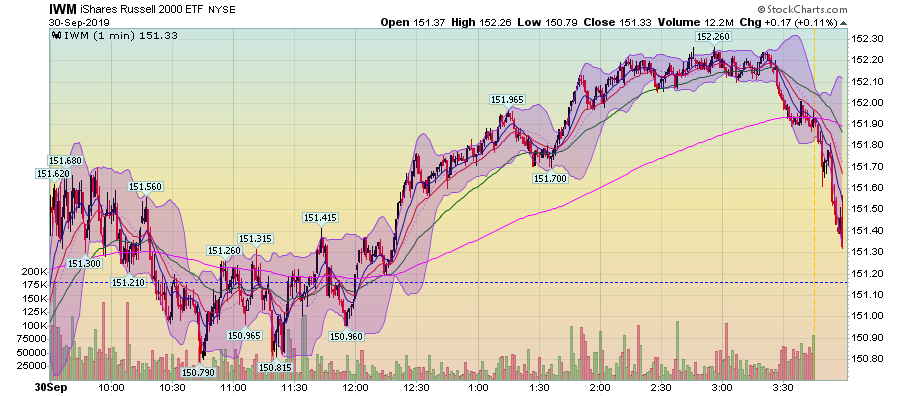
Let's start with today's charts. I'll break the markets down between large-cap (the SPY (NYSE:SPY)) and small-cap (the IWM).
The IWM was performing well through the afternoon. But about an hour before the close, traders started to sell. While the market was still up for the day, the magnitude of the end-of-the-day selloff indicates a high level of concern.
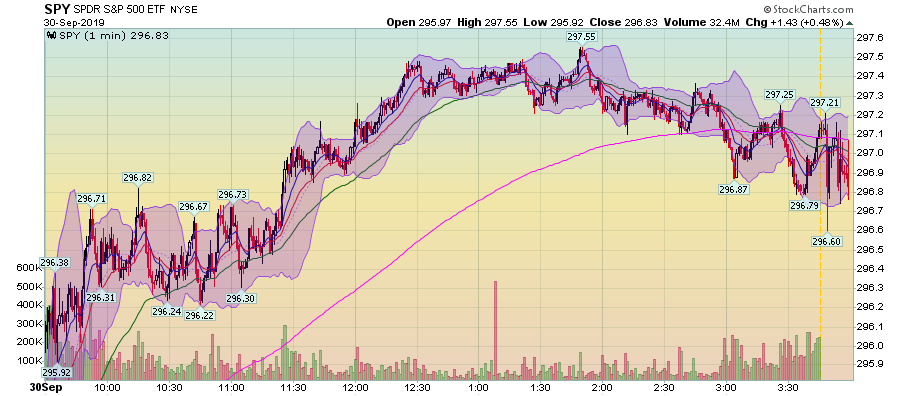
The SPY's chart was a bit different. It gained in the late morning but started to move lower for the remainder of the session. The decline was modest and very controlled.
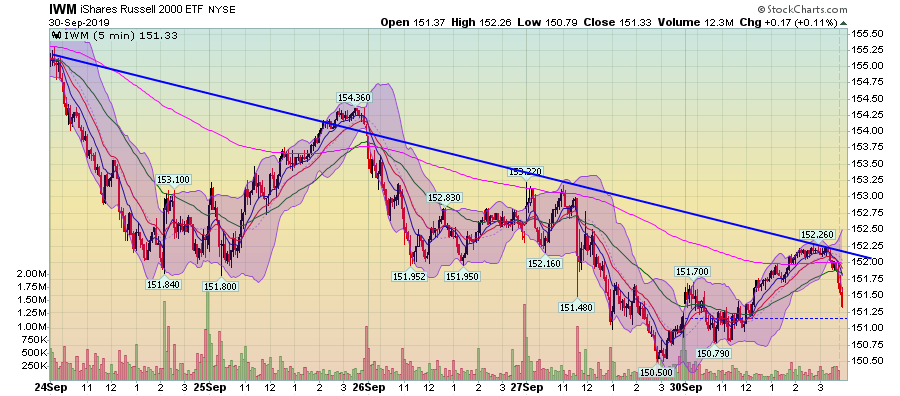
On the 5-day chart, the iShares Russell 2000 (NYSE:IWM) is continuing to move lower, printing a series of lower lows and lower highs.
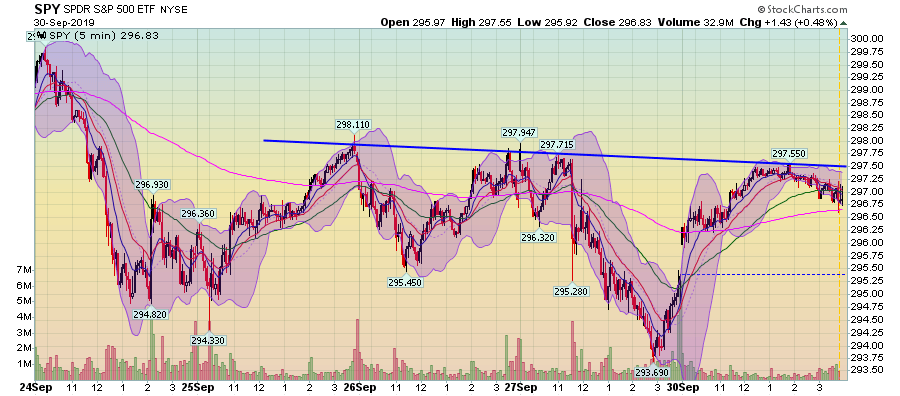
The SPYs are more likely to catch a bid. They've rallied three times during the last five days, continuing to hit resistance in the upper 290s.
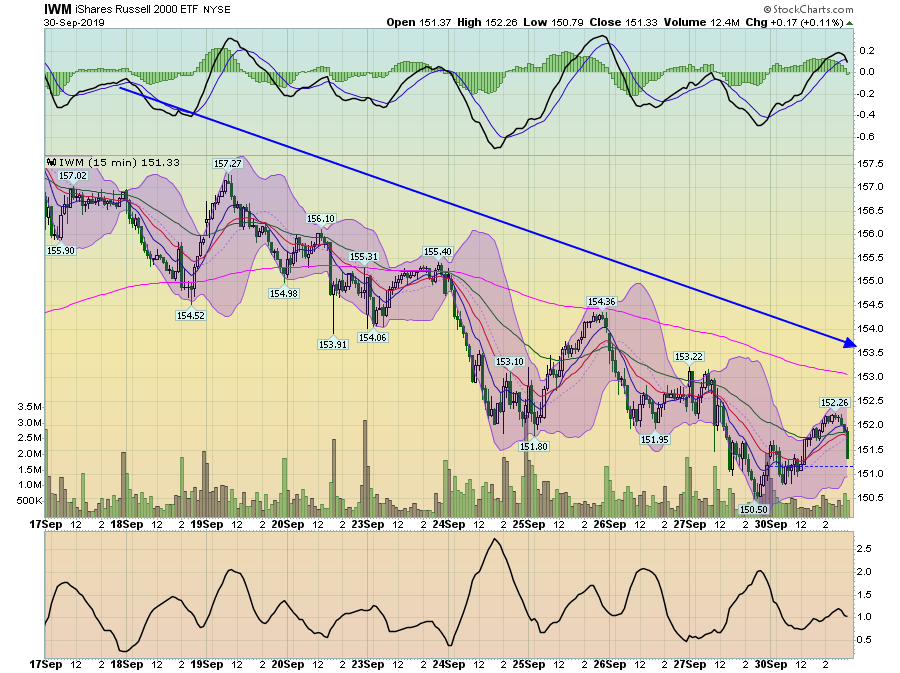
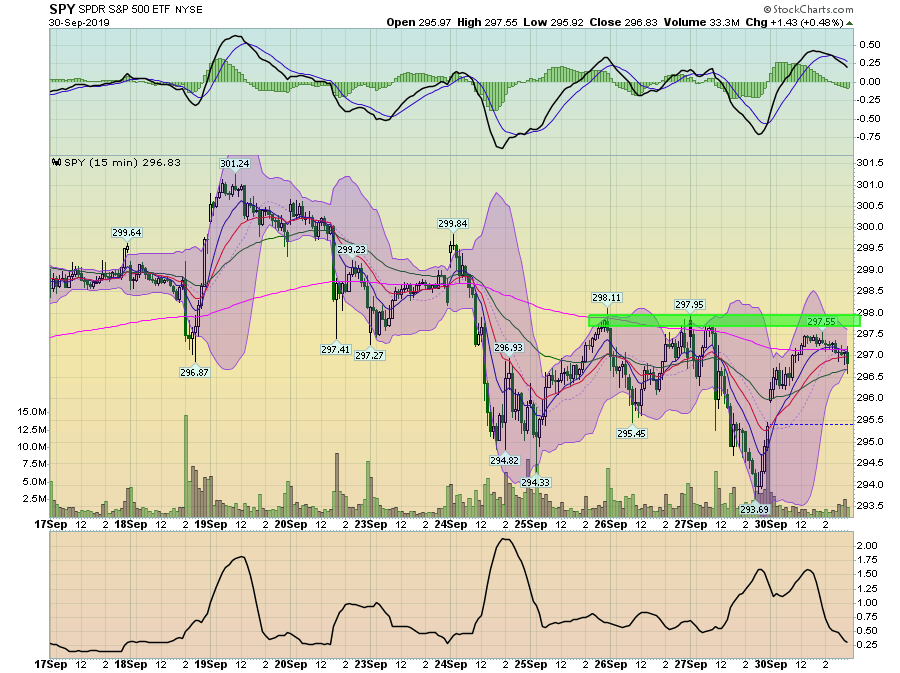
The IWM has continued to decline over the last two weeks, printing a series of lower lows and lower highs.
The SPY (NYSE:SPY) is attempting to stabilize, trading between the mid and upper 290s.
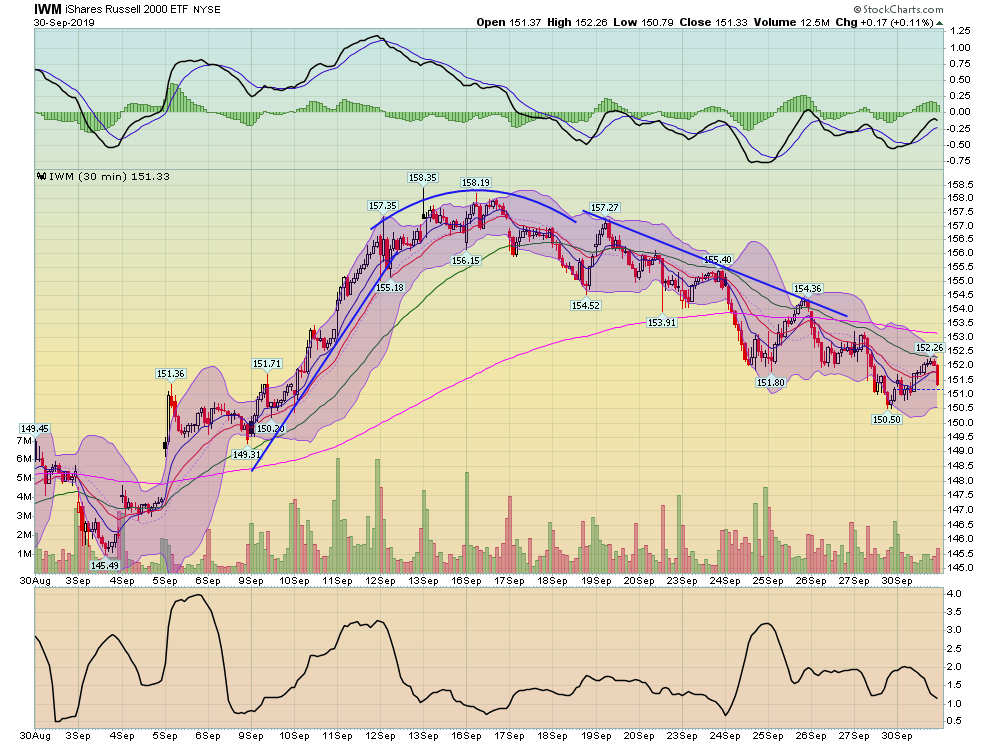
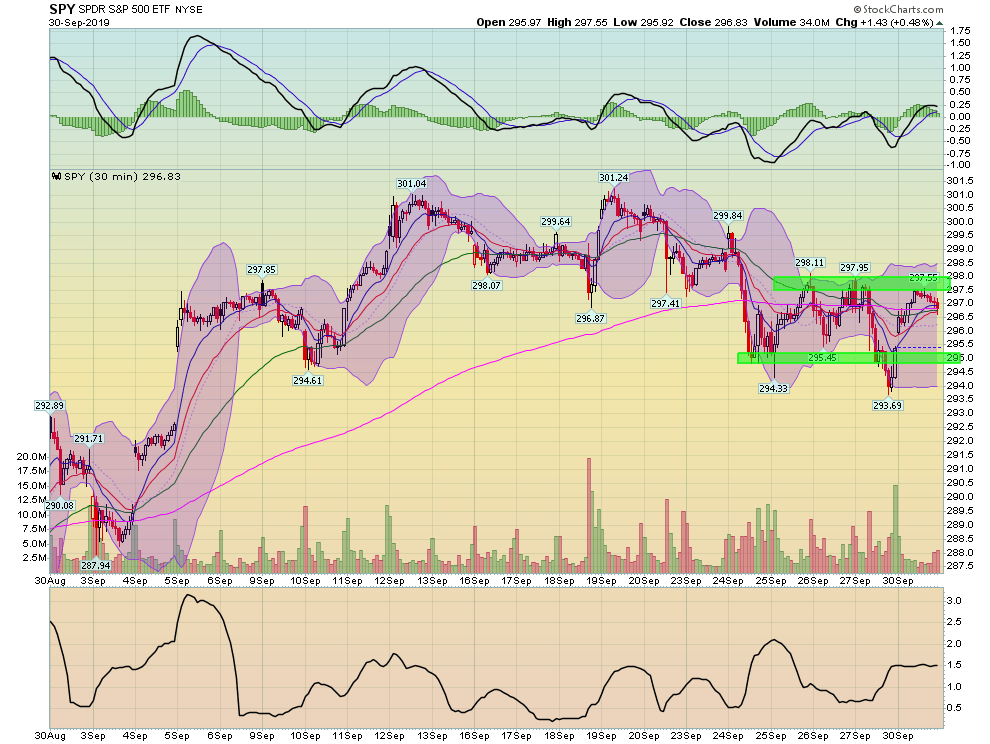
On the 30-day chart, the IWM's decline is clear. Prices have continued to move lower.
The SPY (NYSE:SPY), meanwhile, appears to have stabilized.
What does this tell us about the markets? There is clearly a risk-off attitude, as evidenced by the IWM's continual decline. The drop isn't fatal; in fact, the overall drop is very contained and disciplined. However, it also means that the possibility of an attempt to retake recent highs is diminishing.
