Breaking News
Get 45% Off 0
💰 With a 129% YTD gain in the bag, these are our AI’s top global picks for March
Read now

Technically Speaking For October 29

By Hale StewartETFsOct 30, 2018 01:26AM ET
www.investing.com/analysis/technically-speaking-for-october-29-200351737
Technically Speaking For October 29
By Hale Stewart   |  Oct 30, 2018 01:26AM ET
Saved. See Saved Items.
This article has already been saved in your Saved Items
 
 
US2000
-1.64%
Add to/Remove from Watchlist
Add to Watchlist
Add Position

Position added successfully to:

Please name your holdings portfolio
 
IWM
-1.53%
Add to/Remove from Watchlist
Add to Watchlist
Add Position

Position added successfully to:

Please name your holdings portfolio
 

Summary

The rapid and radical changes to global politics continues.

An increase in government spending was a big reason for the stronger economic numbers in the 3Q.

Despite gapping higher at the open, prices couldn't maintain upward momentum.

The sea-change in global politics continues. Brazil elected a far-right political candidate whose style and method of communication (he primarily used social media) mirrors Trump's. The country has experienced a modest economic malaise for the last five years:

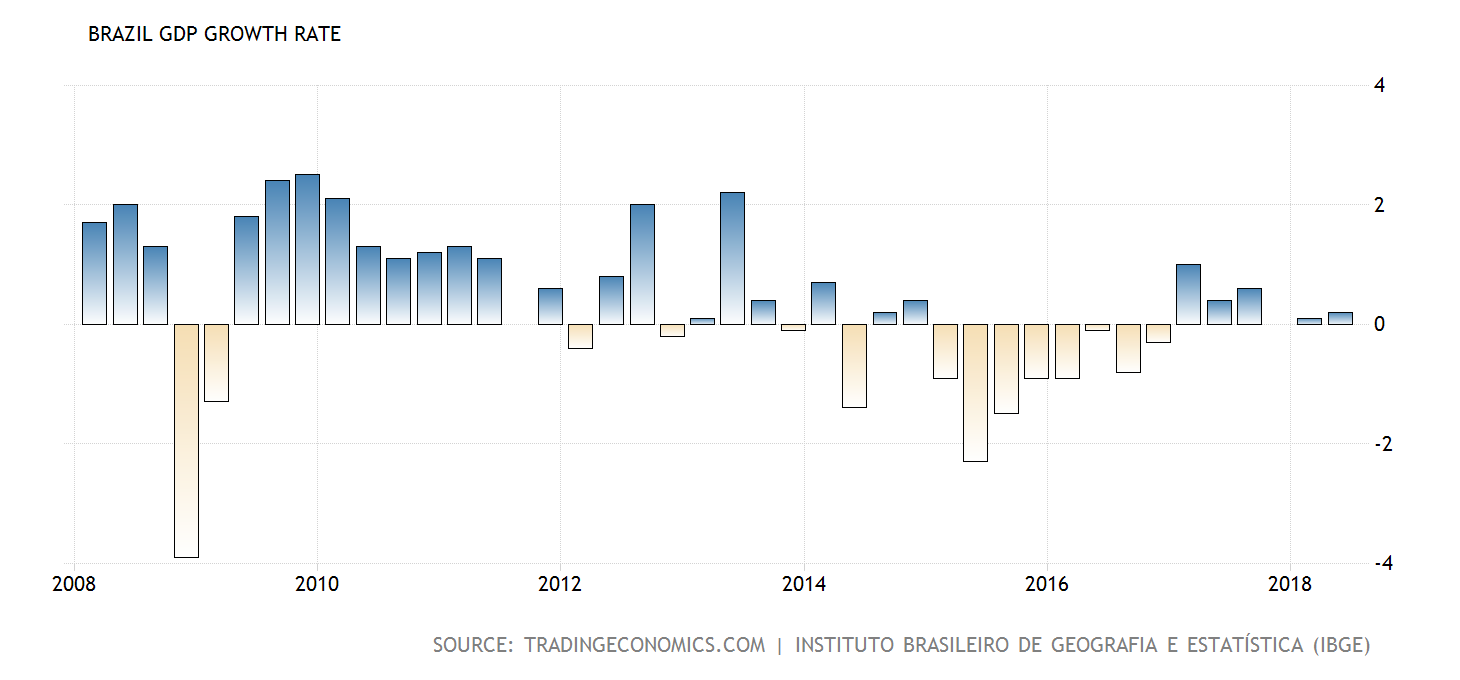
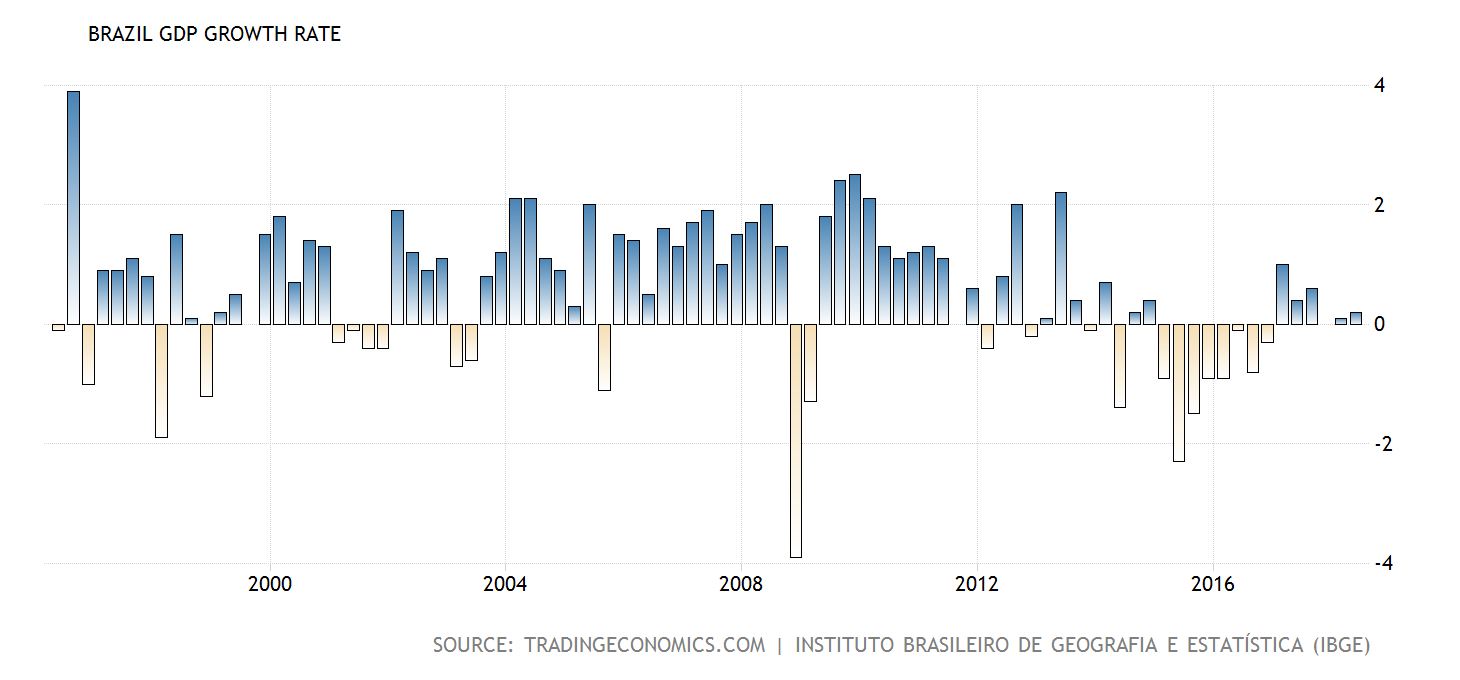
This stands in stark contrast to Brazil's economic heyday from the mid-1990s to the GFC when growth was strong.

In the EU, Angela Merkel has announced that she will step down as leader of the CDU when her term expires in a few years. Merkel has been a driving force in EU politics for a number of years, which was supported by Germany's economic prominence. The global move away from international coalitions such as GATT and trade treaties will most likely continue (I've recently seen the word "re-nationalization" to describe this change).

I made this point in my weekly Turning Points newsletter, but it bears repeating. There is often a huge debate between the political right and left and the stimulative effect of government spending on the economy. The latest BEA GDP report should put some of that debate to rest:

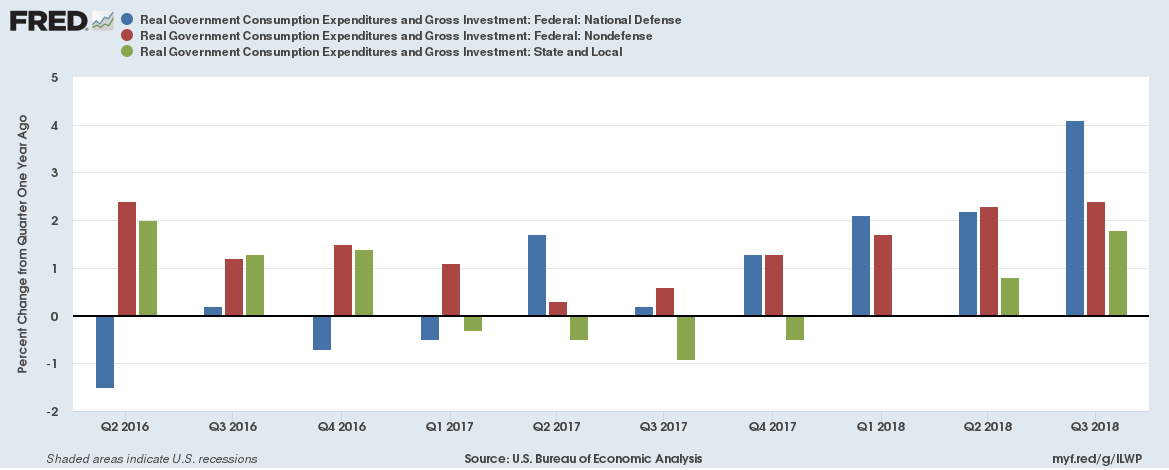
The type of preferred spending is different: the blue bar represents national defense spending, a key component of the political right's beliefs. A left-leaning political spending pattern would have shown an increase in social program expenditures. Regardless, this noticeable increase in government expenditures undoubtedly contributed to growth in the second and third quarter.

Consumer sentiment remains at high levels:

From the University of Michigan [edited and with emphasis added]:

The Consumer Sentiment Index has been higher thus far in 2018 (98.5) than in any prior year since 2000, which was the last year of the longest expansion since the mid-1800s. Importantly, stock price declines, rising inflation and interest rates, and the negative mid-term election campaigns, have not acted to undermine consumer confidence. Needless to say, consumers are not immune to these negative factors. The data only indicate that the tipping point toward escalating pessimism has not been reached. This resilience was primarily due to the prevailing belief that the economy would produce robust job growth during the year ahead, even if overall wage growth remained dismal. Consumers now place a higher value on job security compared with wage growth due to job losses in the Great Recession as well as the aging of the labor force.

Here is the accompanying chart:

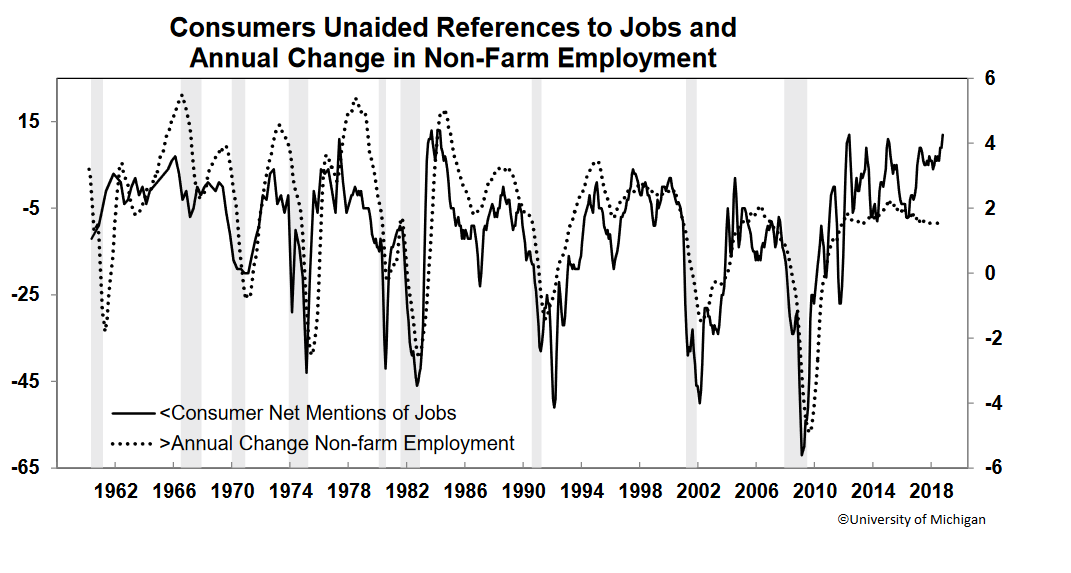
What's most interesting is the observation that the GFC has tamped-down the desire for wage hikes; instead, consumers want their job to be around. That's a very important development that goes a fairly long way to explaining why weak wage growth hasn't been countered yet.

Turning to the markets, here is today's performance table:

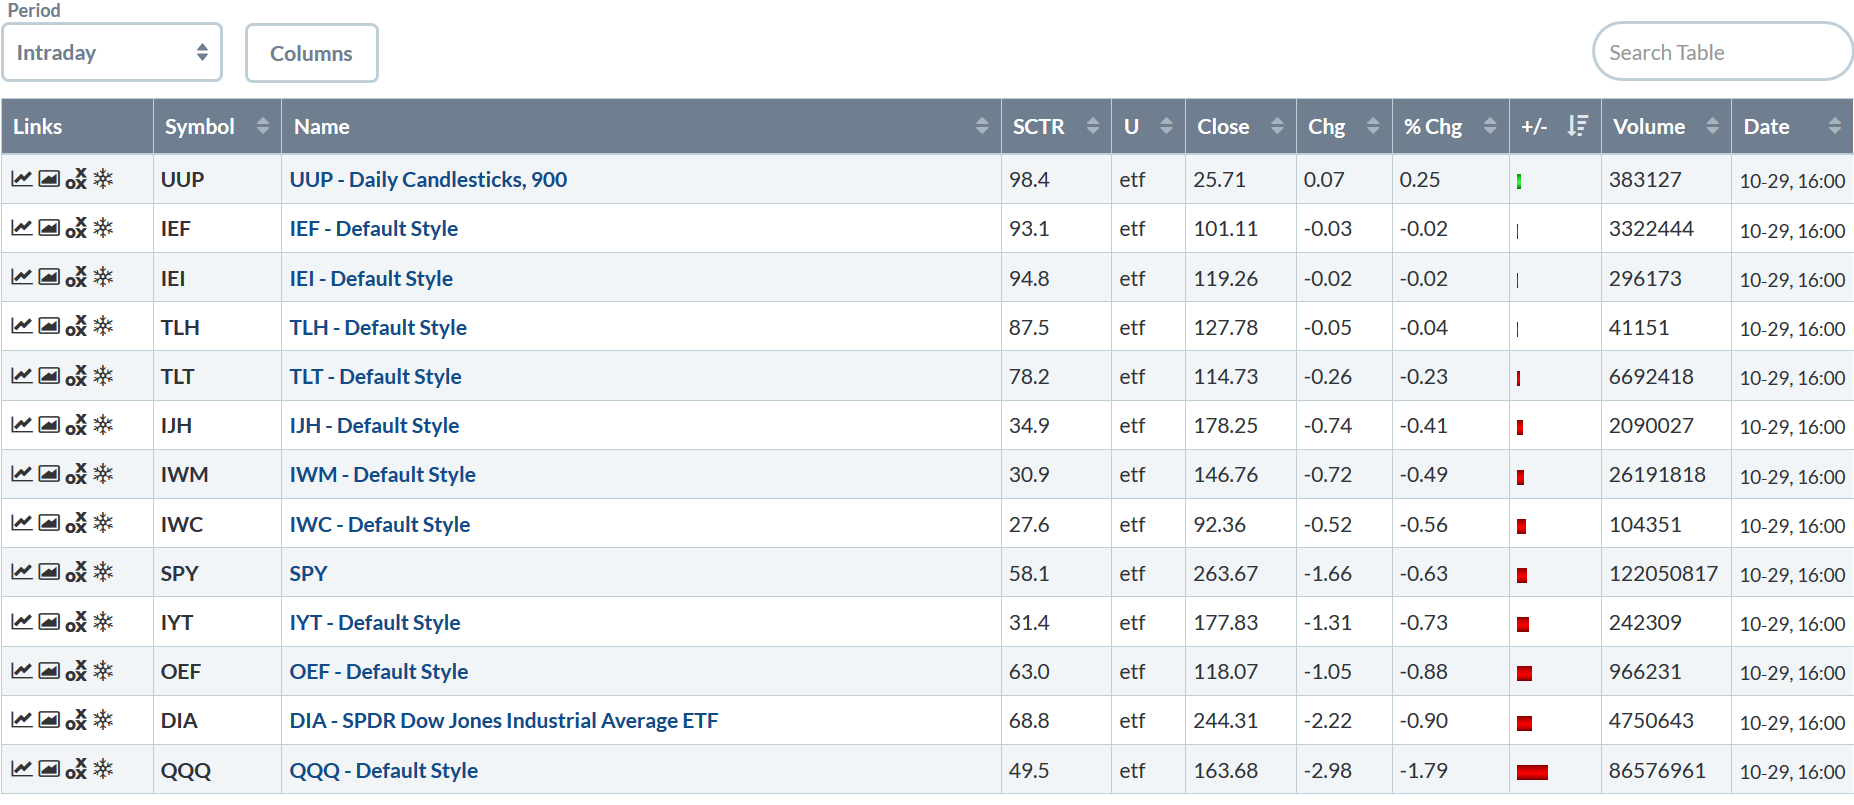
This is a classic bearish table: treasuries are up, equities are down. However, the charts tell a less than happy tale:

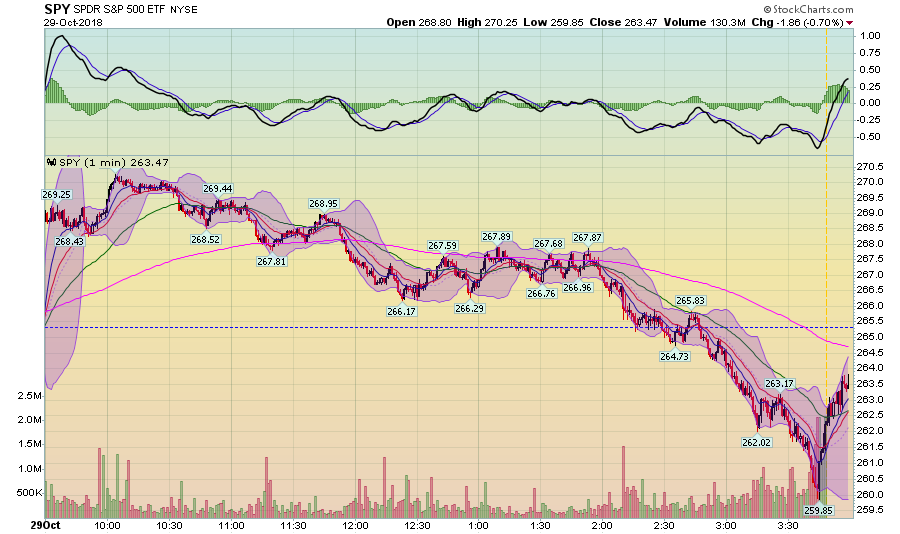
Prices gapped higher at the open. Then, they trended modestly lower throughout the trading session but remained around Friday's close until the last few hours of trading, when they sold-off. There was a decent buying surge at the end, but it was insufficient to rally the market above Friday's close.

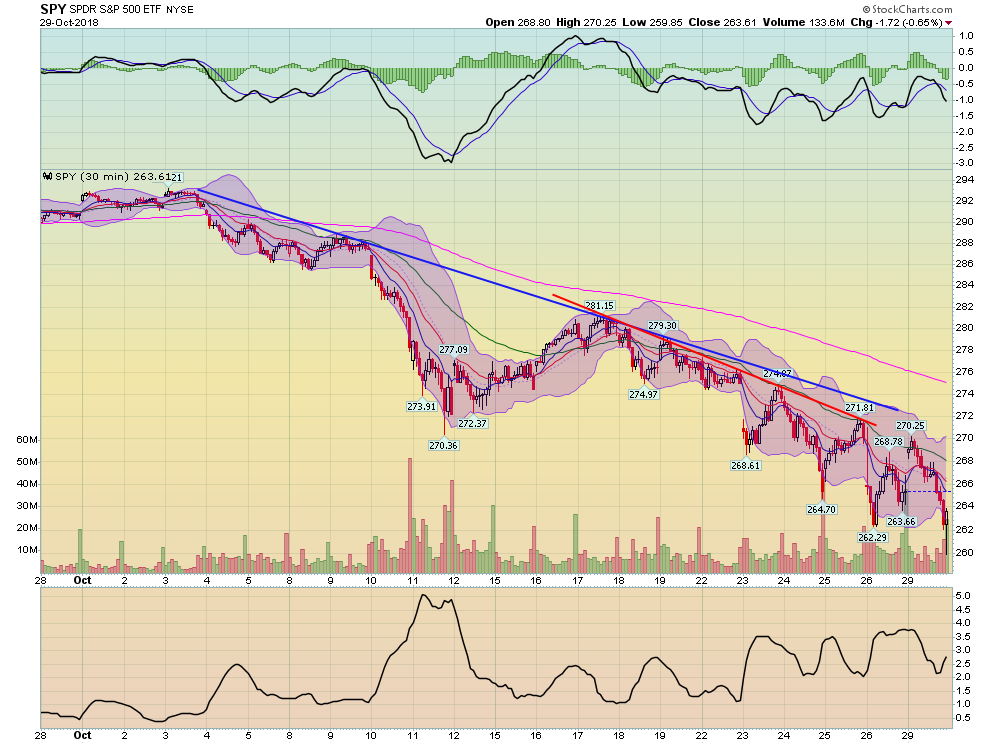
And the bearishness continues on the weekly 5-minute chart and the monthly 30-minute chart:

Sometime last week, I noted that the iShares Russell 2000 (NYSE:IWM) was the most important chart of the major indexes. It had already moved through most of its key support levels and was next looking to make a complete "round-trip," targeting its 52-week low.

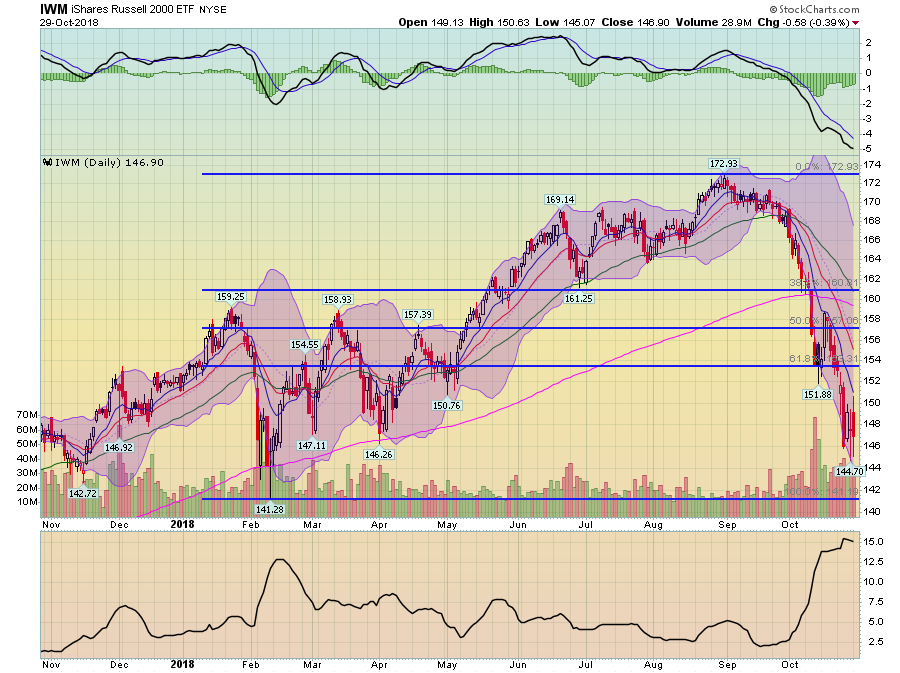
It is still a very bearish chart. Prices are sitting in the mid-140s, where the index printed a few lows in early 2018. These are technically weak levels that hold little sway over current prices. There is still a large amount of downward pull on this chart; prices really want to move to the lower 140s. Don't be surprised if we hit that level in the near-future.

Disclosure: I/we have no positions in any stocks mentioned, and no plans to initiate any positions within the next 72 hours.

I wrote this article myself, and it expresses my own opinions. I am not receiving compensation for it (other than from Seeking Alpha). I have no business relationship with any company whose stock is mentioned in this article.

Original post

Technically Speaking For October 29
 

Related Articles

Technically Speaking For October 29

Add a Comment

Comment Guidelines

We encourage you to use comments to engage with other users, share your perspective and ask questions of authors and each other. However, in order to maintain the high level of discourse we’ve all come to value and expect, please keep the following criteria in mind:  

  •            Enrich the conversation, don’t trash it.

  •           Stay focused and on track. Only post material that’s relevant to the topic being discussed. 

  •           Be respectful. Even negative opinions can be framed positively and diplomatically. Avoid profanity, slander or personal attacks directed at an author or another user. Racism, sexism and other forms of discrimination will not be tolerated.

  • Use standard writing style. Include punctuation and upper and lower cases. Comments that are written in all caps and contain excessive use of symbols will be removed.
  • NOTE: Spam and/or promotional messages and comments containing links will be removed. Phone numbers, email addresses, links to personal or business websites, Skype/Telegram/WhatsApp etc. addresses (including links to groups) will also be removed; self-promotional material or business-related solicitations or PR (ie, contact me for signals/advice etc.), and/or any other comment that contains personal contact specifcs or advertising will be removed as well. In addition, any of the above-mentioned violations may result in suspension of your account.
  • Doxxing. We do not allow any sharing of private or personal contact or other information about any individual or organization. This will result in immediate suspension of the commentor and his or her account.
  • Don’t monopolize the conversation. We appreciate passion and conviction, but we also strongly believe in giving everyone a chance to air their point of view. Therefore, in addition to civil interaction, we expect commenters to offer their opinions succinctly and thoughtfully, but not so repeatedly that others are annoyed or offended. If we receive complaints about individuals who take over a thread or forum, we reserve the right to ban them from the site, without recourse.
  • Only English comments will be allowed.
  • Any comment you publish, together with your investing.com profile, will be public on investing.com and may be indexed and available through third party search engines, such as Google.

Perpetrators of spam or abuse will be deleted from the site and prohibited from future registration at Investing.com’s discretion.

Write your thoughts here
 
Are you sure you want to delete this chart?
 
Post
Post also to:
 
Replace the attached chart with a new chart ?
1000
Your ability to comment is currently suspended due to negative user reports. Your status will be reviewed by our moderators.
Please wait a minute before you try to comment again.
Thanks for your comment. Please note that all comments are pending until approved by our moderators. It may therefore take some time before it appears on our website.
 
Are you sure you want to delete this chart?
 
Post
 
Replace the attached chart with a new chart ?
1000
Your ability to comment is currently suspended due to negative user reports. Your status will be reviewed by our moderators.
Please wait a minute before you try to comment again.
Add Chart to Comment
Confirm Block

Are you sure you want to block %USER_NAME%?

By doing so, you and %USER_NAME% will not be able to see any of each other's Investing.com's posts.

%USER_NAME% was successfully added to your Block List

Since you’ve just unblocked this person, you must wait 48 hours before renewing the block.

Report this comment

I feel that this comment is:

Comment flagged

Thank You!

Your report has been sent to our moderators for review
Continue with Apple
Continue with Google
or
Sign up with Email