Why the U.S. dollar still reigns supreme
Technically Speaking For May 14
Summary
- The equity market sell-off is global.
- Low-interest rates are probably here to stay.
- The markets rebounded today, but longer-term problems remain.
The equity sell-off is global in scope:
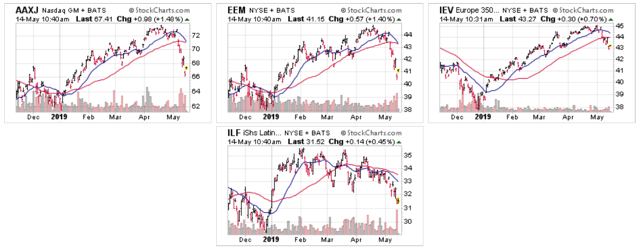
Upper left is the All Asia except Japan (NASDAQ:AAXJ) ETF; it started to drop at the beginning of last week when Trump said he'd increase tariffs on Chinese imports. It's dropped by about 8%. Emerging markets (middle) started to drop at the same time and are off about 7%. Europe is down, but less. While Latin American (bottom) is also off, it's been trending lower since the start of the year. Remember that global trade is down; a fact not helped by the escalating U.S.-Chinese tensions.
Are low-interest rates here to stay? Yes, according to NY Fed President Williams. In a recent speech, he noted that OECD countries are experiencing lower population grown weaker productivity growth. These developments have two profound effects on rates (emphasis added):
These global shifts in demographics and productivity have two important implications for the future of our economies and for monetary policy. First, slower population and productivity growth translate directly into slower trend economic growth.
Second, these trends have contributed to dramatic declines in the longer-term normal or “neutral” real rate of interest, or r-star. Slower trend growth reduces the demand for investment, while longer life expectancy tends to increase household saving. This combination of lower demand for and higher supply of savings, along with other factors, has pushed down r-star. With open capital markets, these global changes in supply and demand affect r-star globally.
This will greatly change what central banks can do for the economy.
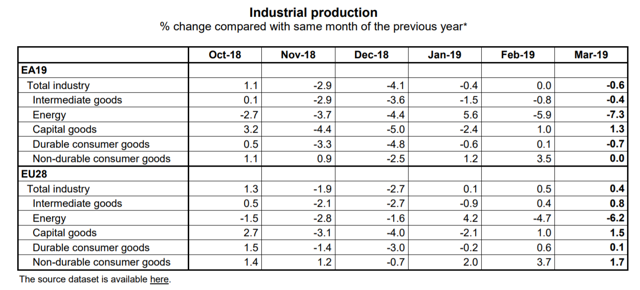
EU data is still concerning: the following table shows the Y/Y percentage change in industrial production:
Production has declined in five of the last six months. The only positive news in the above table are the consistent increases in non-durable production, which has increased in four of the last six months. All other sectors are weak.
Turning to the markets, today was an up day:
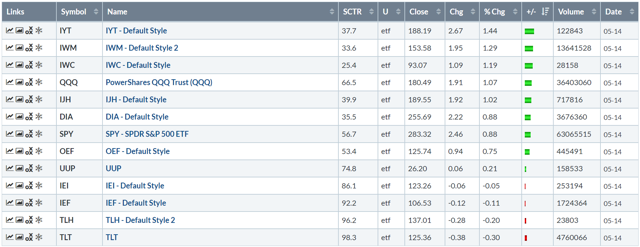
The transports led the pack, rising 1.44%. The best news from a technical perspective is the rallies by the small and micro-caps, which were the numbers two and three performers, respectively. Most other averages were up; there was a modest sell-off in the treasury market.
So -- is this a reversal of the trend? No. Let's start with today's chart:
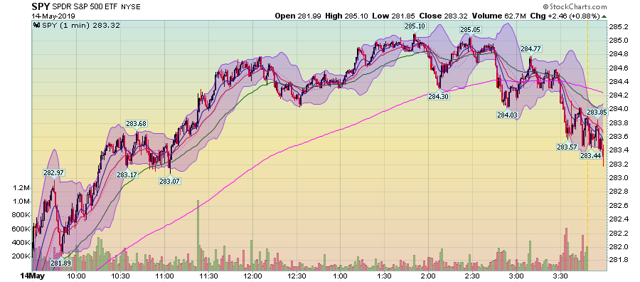
Prices gapped higher at the open and continued rallying until 2. Then they started to sell-off, eventually falling below the 200-minute EMA. Notice the increasing volume at the end of the session; traders were looking to sell at the end of the session.
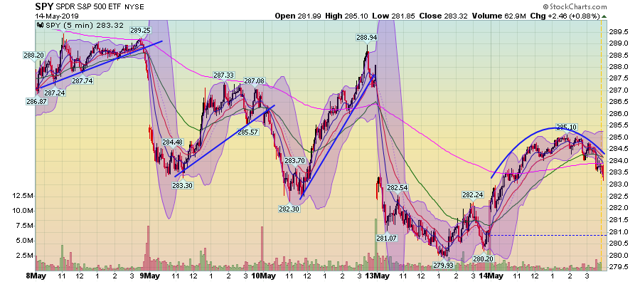
The 5-day chart shows that today's price action was rounding top -- which is "topping' formation.
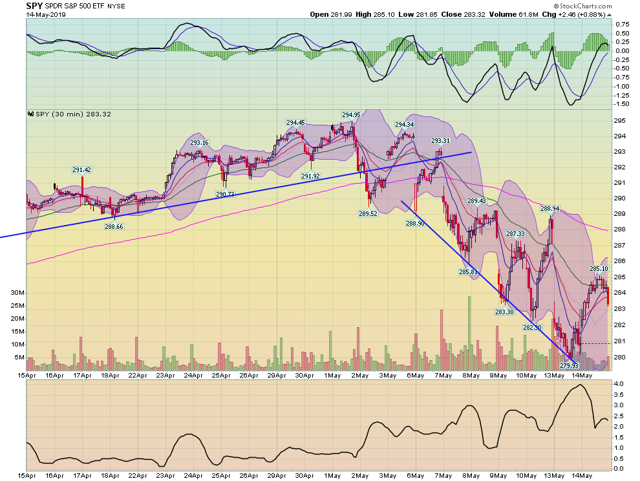
And the 30-day chart shows we're still in a lower bottom, lower top sell-off pattern with negative momentum.
And then we have the daily charts:
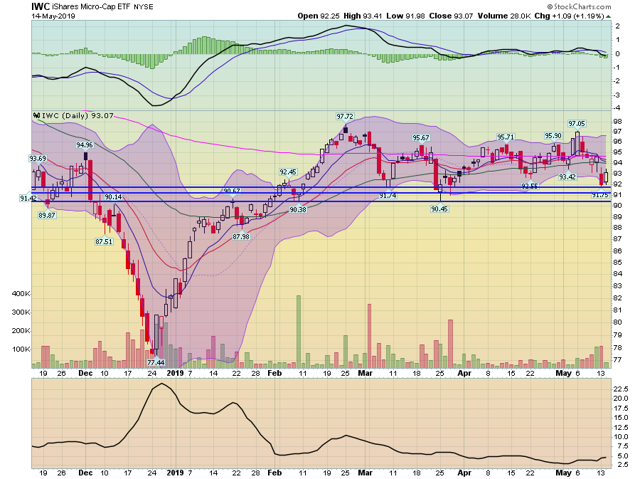
Micro-caps are right above long-term support. Prices are right below the 200-day EMA with the shorter EMAs below the longer. Volume has picked-up (except today, which was weak relatively speaking) and momentum is weak.
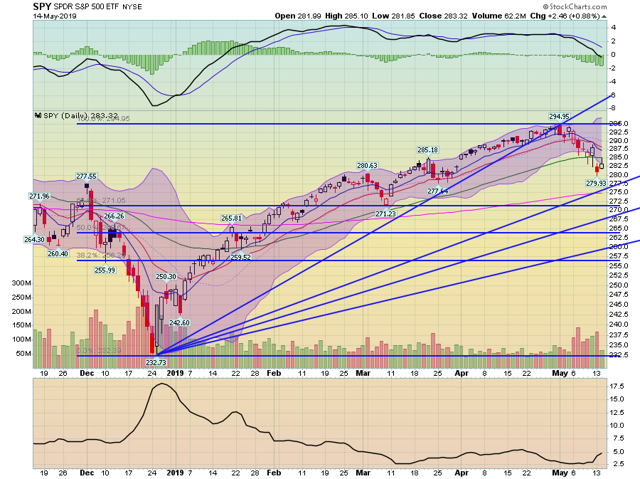
SPY prices are now below the 50-day EMA; the 10-day EMA has crossed below the 20-day EMA. Today's volume -- the supposed "up" day '' is weak and momentum is moving lower.
Today's very weak volume total is all you need to know about today's rebound. It wasn't a real turnaround, but instead a bump higher. For the market to rebound, we need a far more convincing move higher on stronger volume.
Disclosure: I/we have no positions in any stocks mentioned, and no plans to initiate any positions within the next 72 hours. I wrote this article myself, and it expresses my own opinions. I am not receiving compensation for it (other than from Seeking Alpha). I have no business relationship with any company whose stock is mentioned in this article.

