Technically Speaking For May 13-17
Summary
- International data is positive, but there was softness this week in China and the EU.
- US data was mixed.
- This rally is still suspect.
International Economic Data of Note
- China/Japan/Australia
- Japan
- LEI: 96.3; CEI 99.6: these have trended lower over the last 12 months
- Exports -.8% M/M
- China
- Service sector growth 7.4%
- Industrial Production +5.4%
- Retail sales +7.2%
- Fixed Asset Investment +6.1%
- Australia
- Unemployment at 5.1%
- Japan
Asia/Australia conclusion: this week's news was disappointing. Chinese retail sales hit a multi-year low while industrial production fell back after a strong advance the previous month. This could simply be a natural fall-back after a strong month. Japanese news is fair, but there's an underlying softness that is concerning. Australia remains in decent shape.
- EU/UK/Canada
- EU
- Industrial production -.3% M/M
- GDP +.4%
- Employment + .3%
- Zew Economic Sentiment -1.6%
- EU Exports up 3.1% Y/Y
- Construction production down .3% M/M
- Inflation up 1.7%
- UK
- Unemployment at 3.8%
- Wage growth at 3.3%
- Canada
- CPI at 2%
- EU
EU/UK/Canada conclusion: EU news is still soft. While GDP is growing, it's doing so at a snail's pace. Economic sentiment is weak and construction was off. Growth is just this side of positive, which means a negative shock (like higher U.S. tariffs on EU auto exports) could send the region into a mild recession.
- Emerging
- Indian inflation at 3.07
- Turkish retail sales -3.8%
- Turkish unemployment 14.7%
US Data Of Note
The Census reported that retail sales were off modestly (emphasis added):
Advance estimates of U.S. retail and food services sales for April 2019, adjusted for seasonal variation and holiday and trading-day differences, but not for price changes, were $513.4 billion, a decrease of 0.2 percent (±0.5 percent)* from the previous month, but 3.1 percent (±0.7 percent) above April 2018. Total sales for the February 2019 through April 2019 period were up 3.0 percent (±0.7 percent) from the same period a year ago. The February 2019 to March 2019 percent change was revised from up 1.6 percent (±0.5 percent) to up 1.7 percent (±0.2 percent).
The data charts are still pretty good: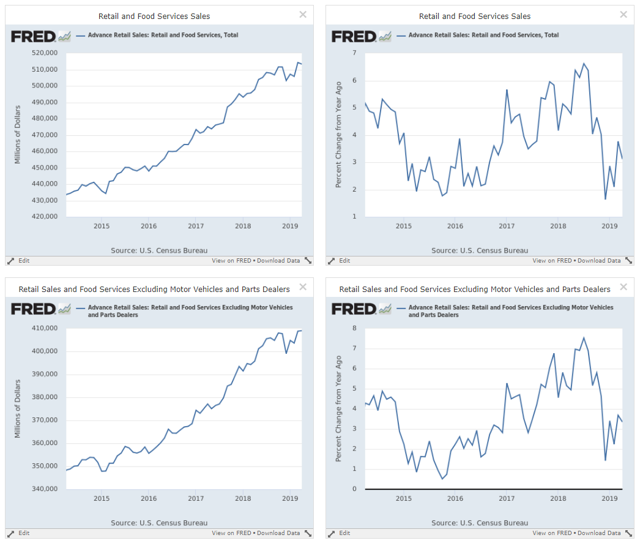 The top right chart shows total sales; the top left chart shows the Y/Y percentage increase. Sales dropped sharply in December, due to the then negative news (a swooning stock market and government shutdown). Total sales are now just shy of an expansion high. The bottom two charts show total sales ex-auto; this series was up modestly last month. Both series Y/Y percentage changes are still are fairly decent levels.
The Federal Reserve reported that industrial production was down .5%. Here's a table of the data from the release: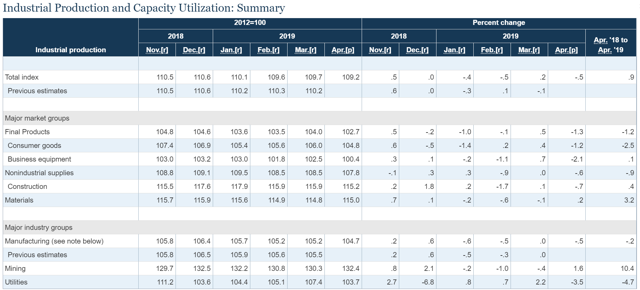 Industrial production declined .5%, its third decline in the last four months. Industry group performance is weak: manufacturing and mining are down in three of the last four months. And the performance numbers for major market groups has been weak for the last four months.
The chart is starting to raise concerns: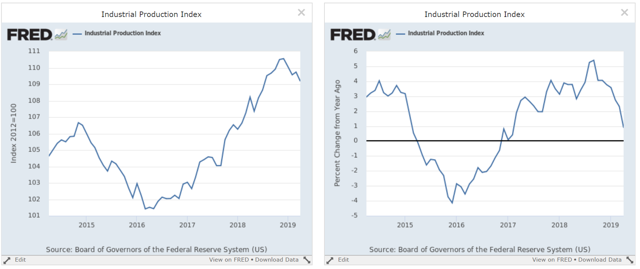
The total number is now in a downtrend (left chart) while the Y/Y number is also moving lower (right chart).
The Census reported that permits for 1-unit housing starts continued to decline (emphasis added):
Privately‐owned housing units authorized by building permits in April were at a seasonally adjusted annual rate of 1,296,000. This is 0.6 percent (±2.6 percent)* above the revised March rate of 1,288,000, but is 5.0 percent (±1.4 percent) below the April 2018 rate of 1,364,000. Single‐family authorizations in April were at a rate of 782,000; this is 4.2 percent (±1.2 percent) below the revised March figure of 816,000. Authorizations of units in buildings with five units or more were at a rate of 467,000 in April.
Here's a chart of the data:
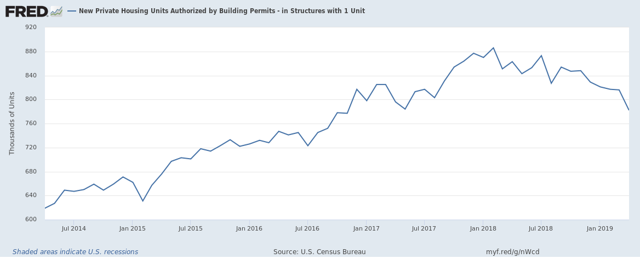 Last month's decline is fairly steep and continues the downward trend that started at the beginning of last year. What's interesting is this is occurring while builder's sentiment is increasing and interests rates are declining. A slowdown of the trend is warranted in that situation.
US conclusion: this week's data was soft. Retail sales weakness can be explained as a natural pullback after a few months of increases. But industrial production is now clearly in a decline as are building permits.
Central Bank Action of Note
None this week.
U.S. Markets On the Week
Let's start with this week's performance table: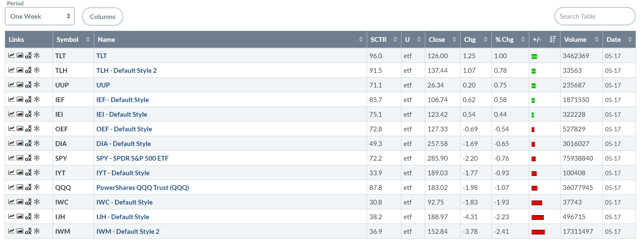 Treasuries were the only gainers. The long-end of the curve was up 1%; the belly of the curve advanced .58. At the other end of the table are the small, micro, and mid-caps, all of which were down. This is not a bullish market table.
There are several reasons why I remain suspicious of this "rally's" staying power. First of all, the market is turning more defensive which consumer staples and utilities out-performing more aggressive areas like technology and consumer discretionary. As I mentioned in my mid-week sector review, defensive sectors aren't a large enough portion of the market to propel it higher.
Second, this week's SPY (NYSE:SPY) chart isn't very bullish: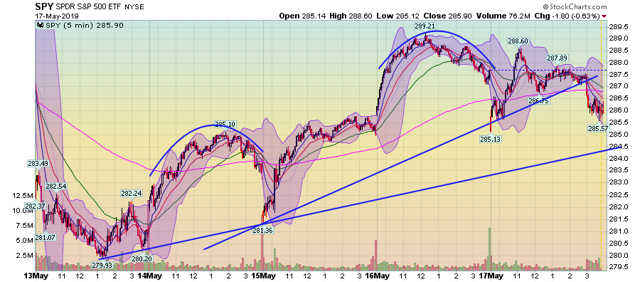
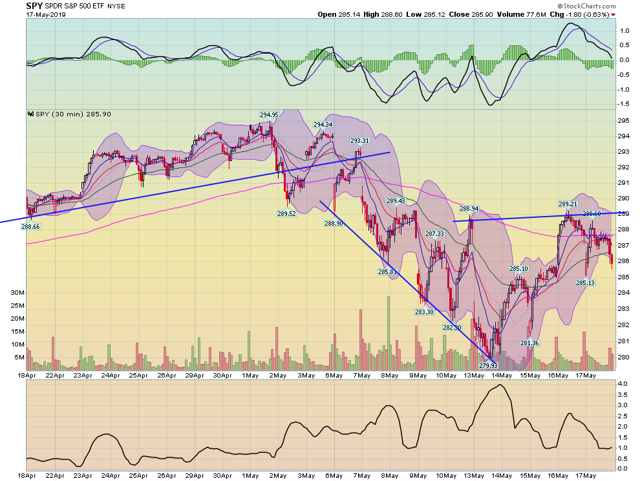
The week started on a gap lower. Prices rallied a bit but formed a rounding top (a topping pattern) on Tuesday. They gapped lower on Wednesday AM (a bearish move) but then rallied into the close. There was a second rounding top on Thursday followed by a gap lower on Friday AM. Finally, the market sold-off on Friday as the close approached. In the last five day, the chart has printed three gaps lower and two rounding tops. In other words, the market really wants to top-out here.
Let's now look at the 30-day time frame, starting with the IEF -- the 7-10 year treasury ETF:
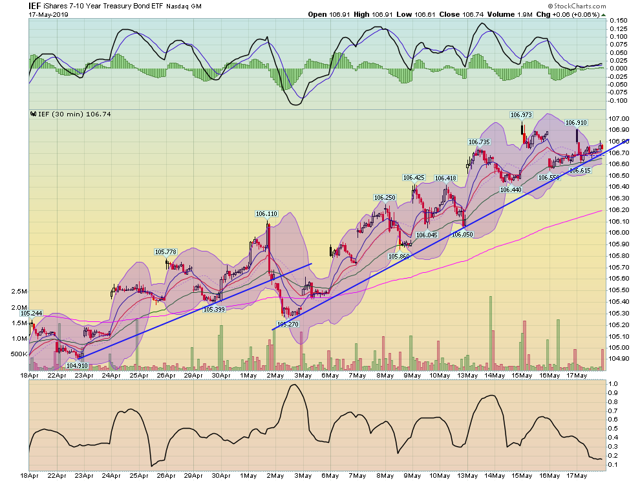 This chart is in a solid and confirmed uptrend, as is ...
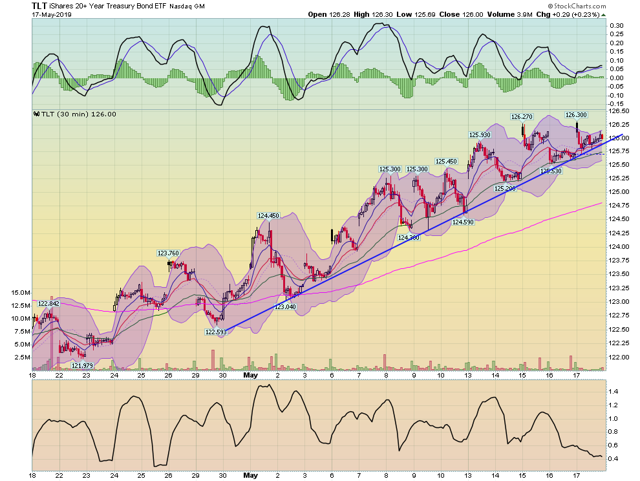
the long-end of the curve, the TLT.
In contrast is the 30-day chart for the equity market ETFs: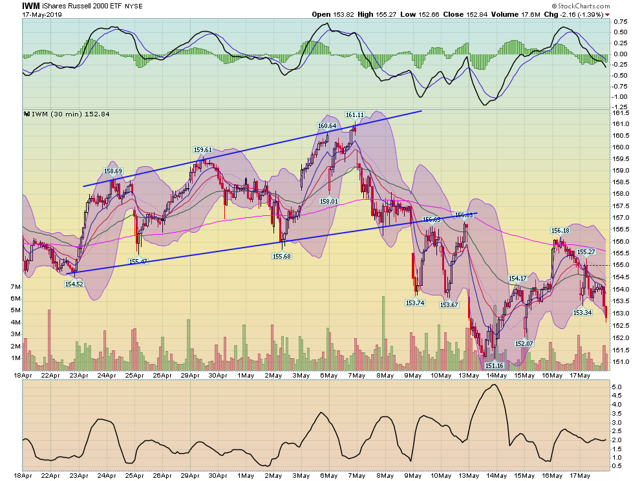
The IWM was in an upward sloping channel until it broke trend on May 9. Since then, it was tried to rally above 157 and failed. The tops of the last two trading days has formed a clear downward trend.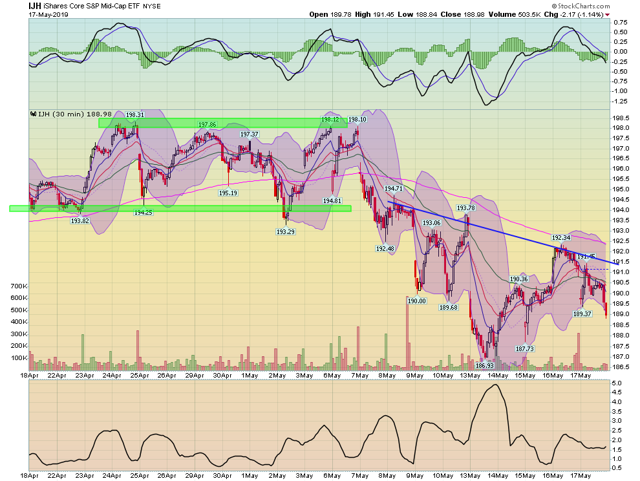 Mid-caps were in a sideways consolidation trend until May 7, when they broke below the 193 level. Prices are now in a downward trend.
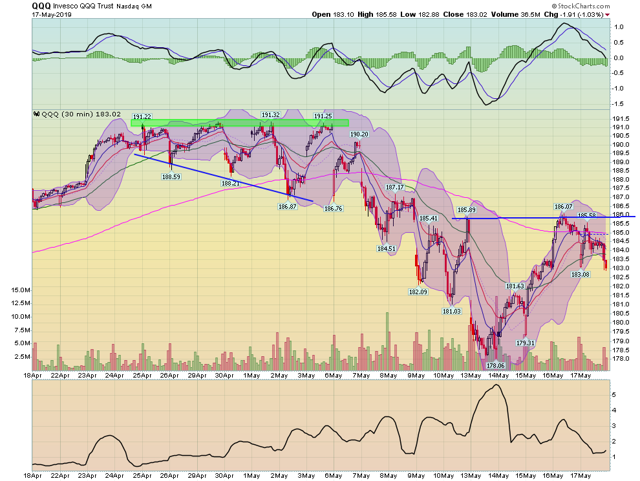 The QQQs bottom fell out between April 25 and May 6. Prices have been unable to get above the 185 level since.
The SPY was in a solid downward trend at the beginning of May. It is now below the 200-minute EMA after failing to get about the 289 price level.
For most of this Spring, the large caps rallied at the expense of the small caps. Now the sector rotation is turning defensive and the treasury market is rallying. This is not setting up for a bullish run.
Have a happy and safe weekend.
Disclosure: I/we have no positions in any stocks mentioned, and no plans to initiate any positions within the next 72 hours. I wrote this article myself, and it expresses my own opinions. I am not receiving compensation for it (other than from Seeking Alpha). I have no business relationship with any company whose stock is mentioned in this article.

