Technically Speaking For May 13
Summary
- China sharply escalated trade tensions today.
- Oil prices remain contained.
- The markets sold-off sharply today, setting a bearish tone for the week.
China announced it will retaliate against the U.S.'s tariff increase (emphasis added):
But China showed it planned to counter his adversarial approach with its own penalties against U.S. companies. The Chinese government said it would impose tariffs on U.S. imports starting on June 1, with the steepest penalties hitting textile products, certain kinds of beef and coffee, and technology like microwave ovens, printers and solar batteries. The tariffs would range from 5 percent to 25 percent.
China is now one of the world's largest economies; it has also been increasingly flexing its diplomatic and military muscle over the last 5-10 years - which means this move shouldn't surprise anyone. While the tariff's impact on the U.S. economy will be low, they do increase the overall level of risk. As explained by one economist:
...but he points to "spillover effects," including newly turbulent financial markets that could in turn rattle business confidence, slowing new investment. "The economy's fundamentals overall are solid, and the odds of a recession are low. The risk is we talk ourselves into one."
Oil Price update: This morning, the Financial Times reported that two Saudi oil tankers were damaged near the UAE - which reported similar damage to their tankers over the last few days. This is occurring against the backdrop of escalating U.S.-Iran tensions. These started when the U.S. declared the Iranian Revolutionary Guard was a terrorist organization; rumors that Iran was planning to target U.S. interests in the Middle East followed. Despite this news, oil prices are contained:
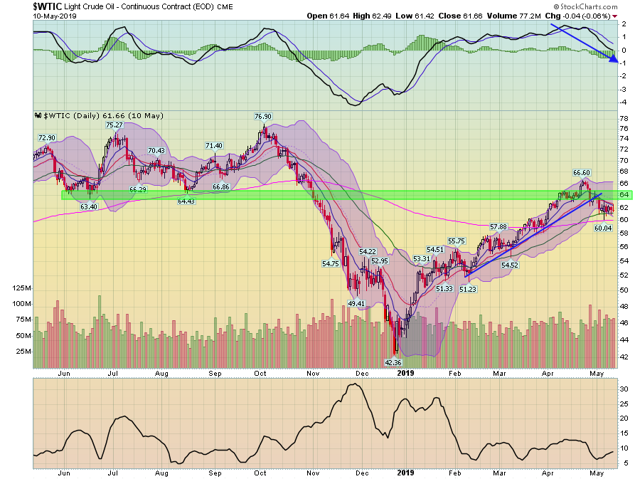
Oil prices started to rally at the end of last year, rising from an absolute low of 42.36 in late December to 66.6 at the end of April. Since then, prices have moved lower, targeting the 200-day EMA.
After the U.S. government's loss to Microsoft (NASDAQ:MSFT) in the 1990s, anti-trust enforcement slowed to a crawl. However, there's been a noticeable uptick in the number of Democratic presidential candidates talking about using the Sherman Antitrust Act. Just this week, a former Facebook (NASDAQ:FB) executive argued in a NY Times editorial to break-up the company. And now, in a move that caught me off-guard, the Supreme Court ruled against Apple (NASDAQ:AAPL) in an anti-trust case.
The vote was 5 to 4, and it featured an unusual alignment of justices, with President Trump's two appointees on opposite sides. Justice Brett M. Kavanaugh, who joined the court in October, wrote the majority opinion, which was also signed by the court's four more liberal justices. Justice Neil M. Gorsuch, who joined the court in 2017, wrote the dissent.
Of all the justices who would write the majority opinion, I'd have Kavanaugh near the bottom of the list.
My general investment thesis for the last few months is that the markets were taking a clearly end-of-the-economic-cycle position. Large caps rallied while small caps languished. Treasuries caught a strong bid as well. The combined reading of these developments is that traders thought growth would be weak.
Last week's news that Trump was increasing tariffs on Chinese goods was the selling catalyst that the markets needed, sending the large caps lower. Today's Chinese retaliation simply exacerbated the trend.
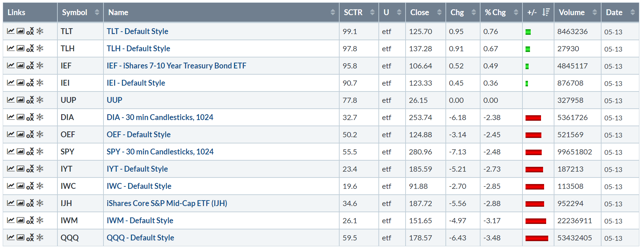
This is not the way you want to start the week (unless you're shorting). The Treasuries led the way, posting decent advances for bonds. At the other end of the table are the equity indexes; the QQQ was off 3.5%, the IWMs was down 3.17, and the IJHs dropped 2.88. This sets an obviously bearish tone for the week.
More importantly, a bearish tone is accelerating in the charts:
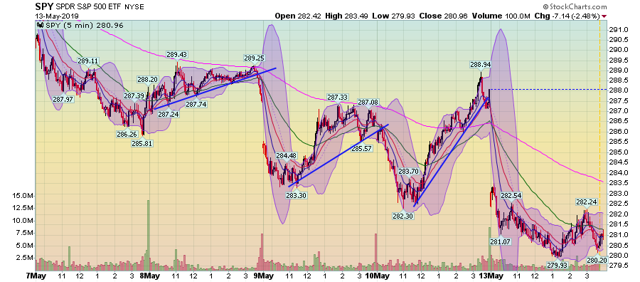
Last week, there was a fair amount of bullishness in the charts. Several times when the market gapped lower or sold-off, the index caught a bid. That didn't happen today. Prices gapped lower and then headed down. The SPY tried to stage a rally in the afternoon but quickly sold-off.
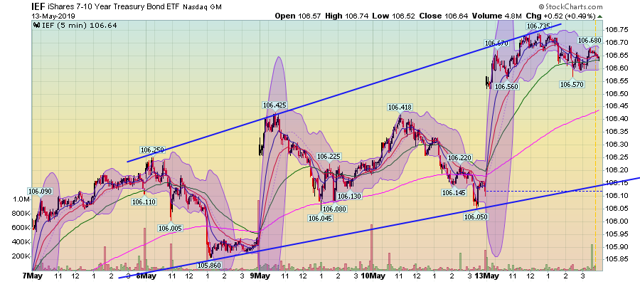
The IEF stands in contrast to that SPY chart; the IEF is in a modest uptrend. Prices are near the top of their 5-day trading range.
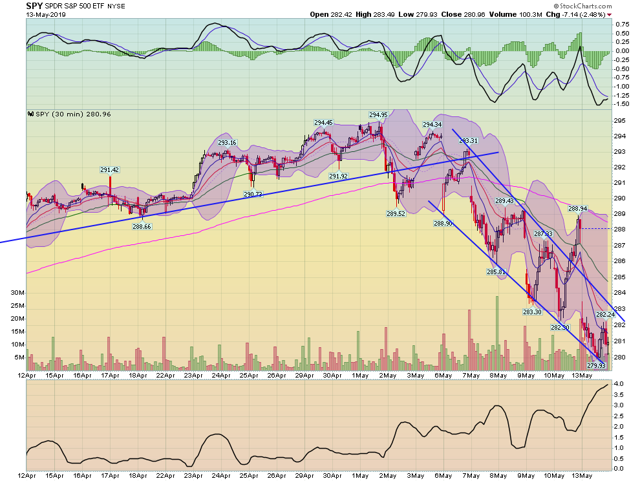
The SPY's 30-day chart shows that prices have clearly broken the trend and are firmly in the middle of a downward sloping channel. Prices are near their lows for the month.
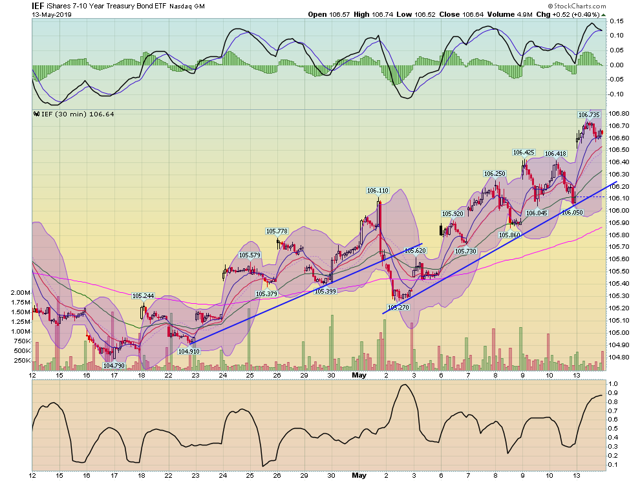
The IEF stands in contrast; it's moved higher in two stages and has clearly caught a strong bid.
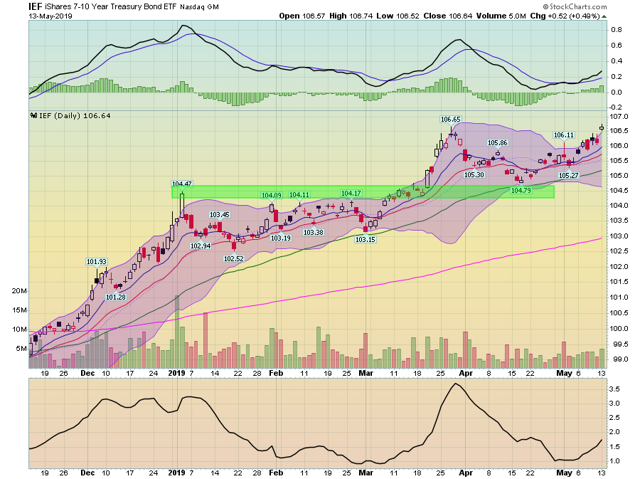
On the daily chart, the IEF is at a 6-month high.
In contrast, the equity market charts are breaking down:
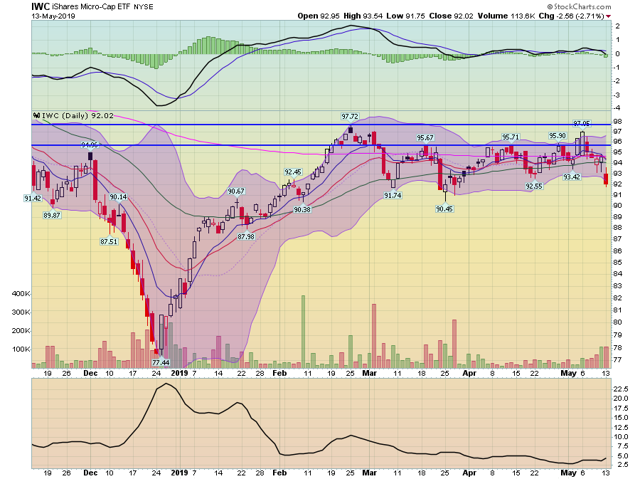
Micro caps are already through their 200-day EMA. Volume is picking up on the downside.
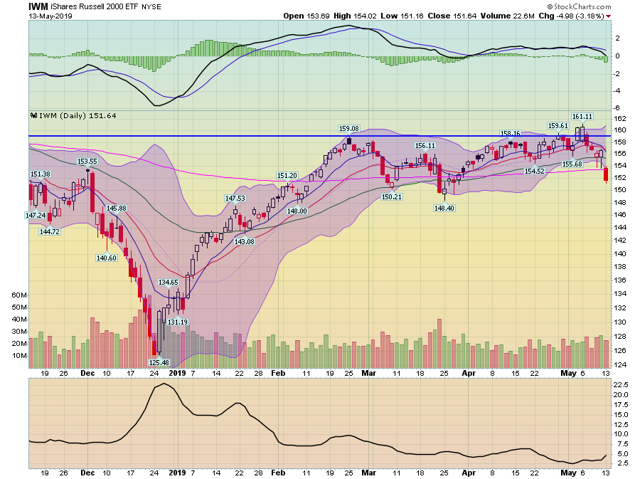
The small caps fell through their 200-day EMA today.
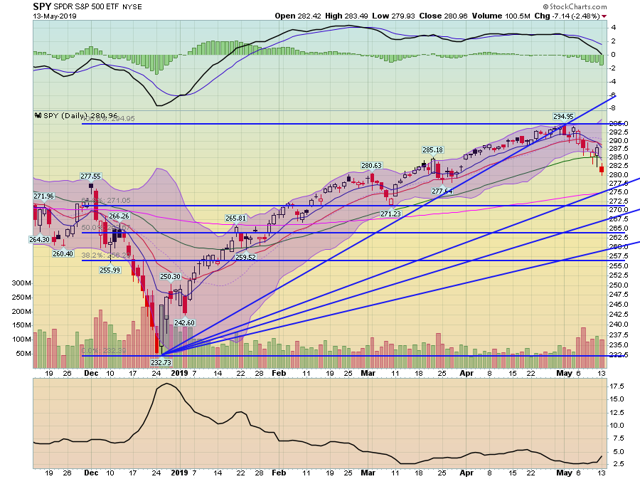
Finally, the SPY has dropped below the 50-day EMA. The 10-day EMA has moved through the 20-day EMA with both of the shorter EMAs moving lower. Volume has also picked up.
At this point, a move lower is a foregone conclusion, barring fundamental catalyst to reverse the trend.
Disclosure: I/we have no positions in any stocks mentioned, and no plans to initiate any positions within the next 72 hours. I wrote this article myself, and it expresses my own opinions. I am not receiving compensation for it (other than from Seeking Alpha). I have no business relationship with any company whose stock is mentioned in this article.
