Technically Speaking For March 6 Summary
- The Beige Book was modestly positive.
- Q1 2019 GDP projections are weak.
- The markets continued their move lower.
From today's Beige Book:
Once again, the adjective "moderate" describes most economic activity. The shutdown's impact was far broader than reported; it affected half the districts. This was the first time I've seen a report that weather kept consumer activity low. Political uncertainty is also hurting business demand.
Q1 2019 GDP growth projections are weak. The Atlanta Fed's GDP Now forecast is .5%; the NY Fed's is .88%. Other reports (collated by the Capital Spectator website) are equally pessimistic.
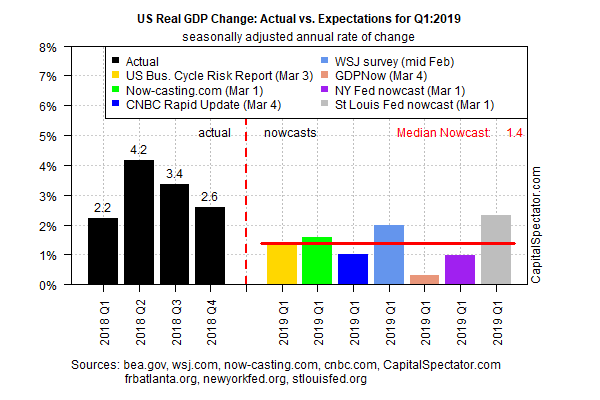
A few caveats are in order. First, the U.S. economy has consistently printed weak first quarter numbers during this expansion. I have yet to see a good explanation for this phenomena. Second, we have very little first quarter data from which to extrapolate projections. In other words, it's early in the cycle.
Boston Federal Reserve President Rosengren gave his latest assessment of the U.S. economy and Fed policy. Here's the key paragraph (emphasis added):
“However, many of the underlying global growth issues that generated the recent spate of financial-market concerns are as yet unresolved,” Rosengren observed. These issues include slowing growth in China and Europe, constraints on international trade, the potential for Brexit-generated challenges, and problems at some European banks.
Rosengren perfectly frames the last six months of financial market developments. In the fall, stocks fell and Treasuries rose because traders believed growth was at risk. Recent data has eased growth concerns, which supports the recent rally in equity markets. But large potential issues remain. Until those issues are resolved, the higher-than-average downside risk to economic growth supports the Fed's pause in rate hikes.
Today, the downtrend accelerated. The long-end of the curve advanced modestly, with the TLT up .36% and the TLH advancing .33%. The micro caps led the way lower, falling 2.43%. The small and mid-caps followed, dropping 1.93% and 1.31%, respectively. Industry performance was defensive, with utilities and staples the number two and three performers.
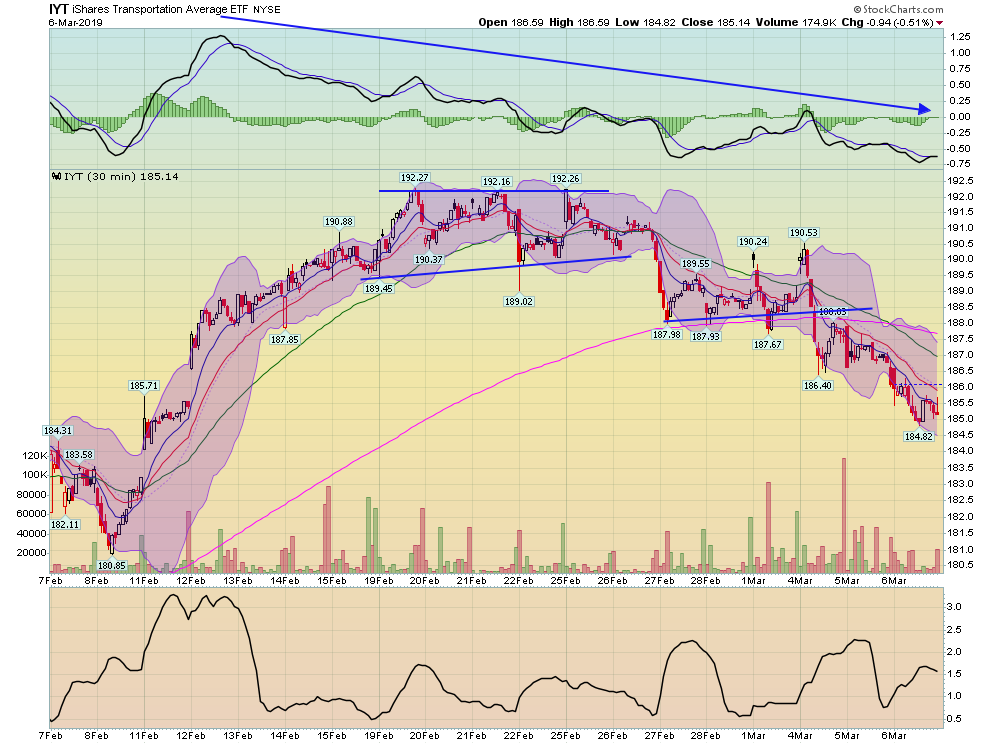
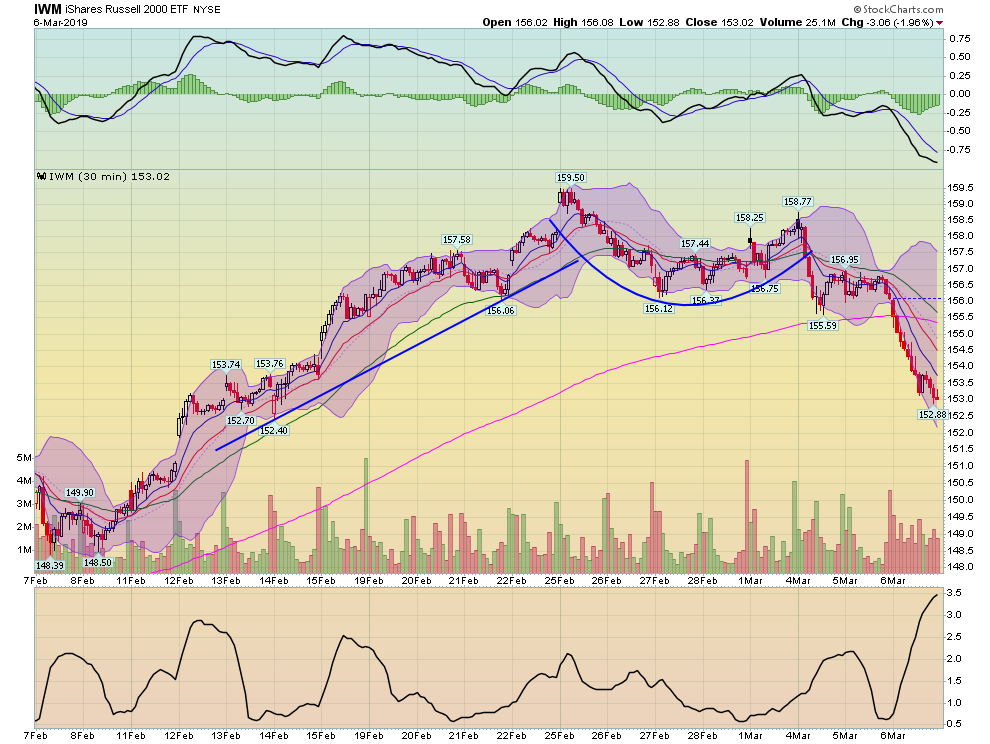
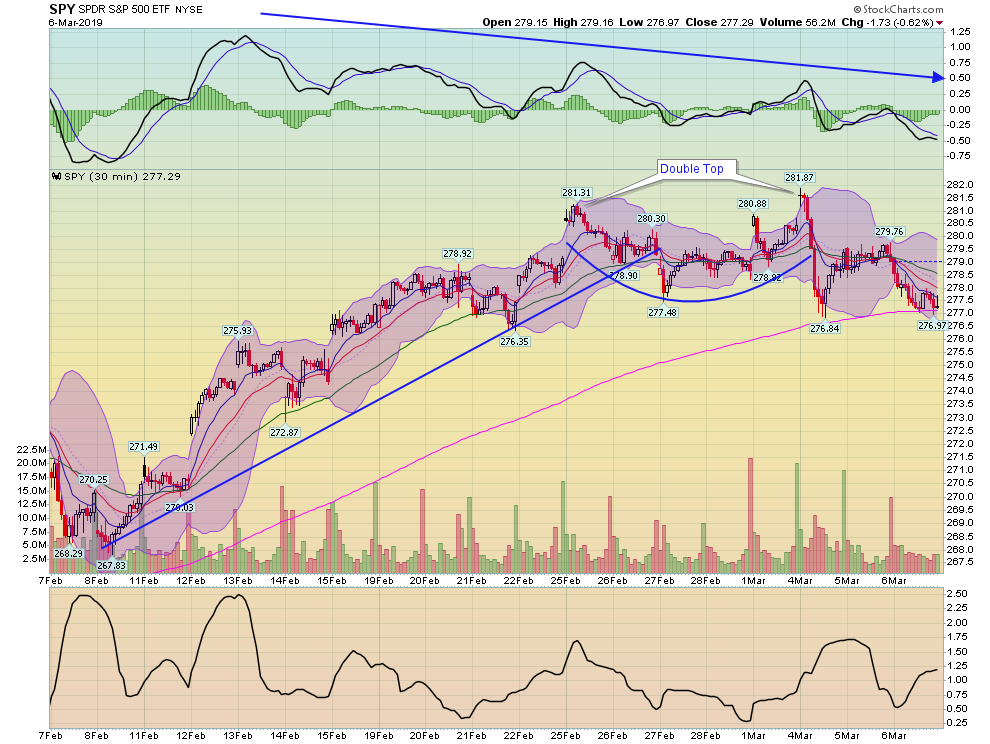
Yesterday, I noted that the markets were doing a "slow-motion roll-over" with the transports, small, and mid-caps leading the way lower. That trend continued today. The 30-day charts offer the best view of the trend.
The transports consolidated between Feb. 19-25. They dropped to the 200-minute average on the 27th, then traded sideways again for an additional three days. They broke support on March 4 and have been moving lower since.
The small caps formed an inverse rounding top between Feb. 25-March 1. They've been moving lower since. Also, note that momentum has been declining for the last 30 days.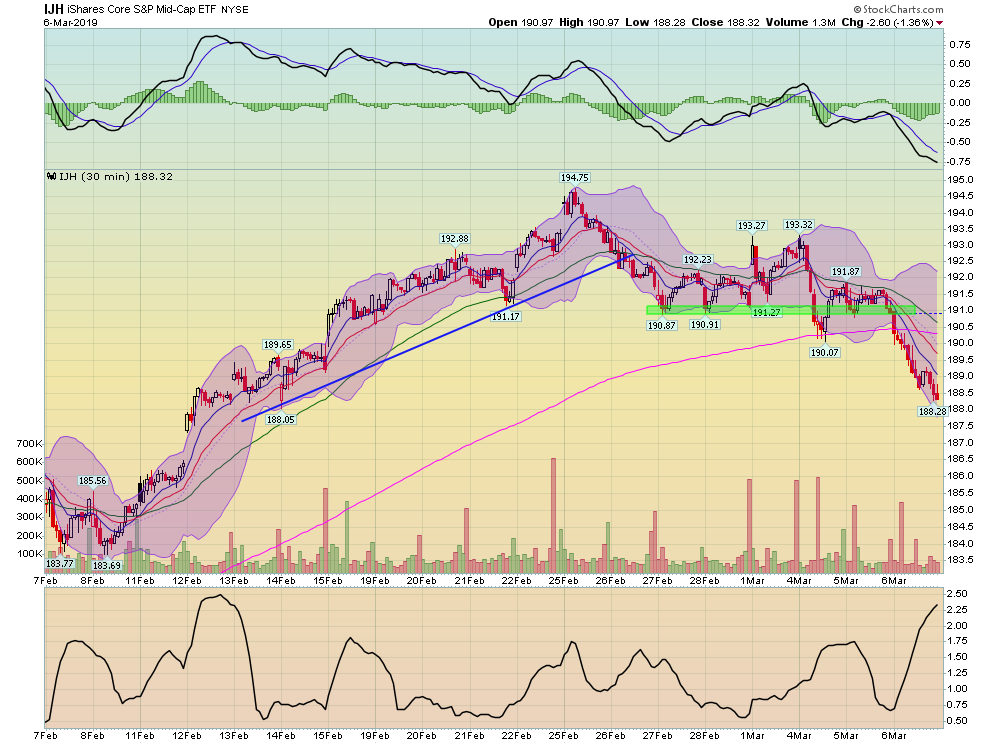
The IJH's pattern is very similar to the IWM's. Note that the shorter EMAs are all moving lower, with the 10 and 20-minute EMA below the 200-minute EMA. Prices are below all the EMAs, which will continue to pull them lower.
Then we have the SPY, which formed a double top before moving lower. Prices are now at the 200-day EMA with declining momentum.
All signs are that the markets will continue moving lower.
Disclosure: I/we have no positions in any stocks mentioned, and no plans to initiate any positions within the next 72 hours. I wrote this article myself, and it expresses my own opinions. I am not receiving compensation for it (other than from Seeking Alpha). I have no business relationship with any company whose stock is mentioned in this article.

