Summary
- The disaster that is Brexit continues.
- German growth in 2019 is projected to be weak; Chinese growth continues to slow.
- The markets were near unchanged today.
The disaster that is Brexit continues. Teresa May barely beat back a Parliamentary attempt to take the Brexit process away from her; the vote was 314-312. Parliament also voted for a delay in the process:
Lawmakers voted 412 to 202 on Thursday to seek a delay in Britain’s withdrawal from the European Union, a move that means the country almost certainly will not leave the bloc on schedule on March 29.
According to the BBC, EU President Trusk will ask for a "long extension" which has to be approved by the EU. At this point, it looks as though we'll be dealing with Brexit uncertainty for an extended period of time.
The long-end of the Treasury market is betting on slower growth:
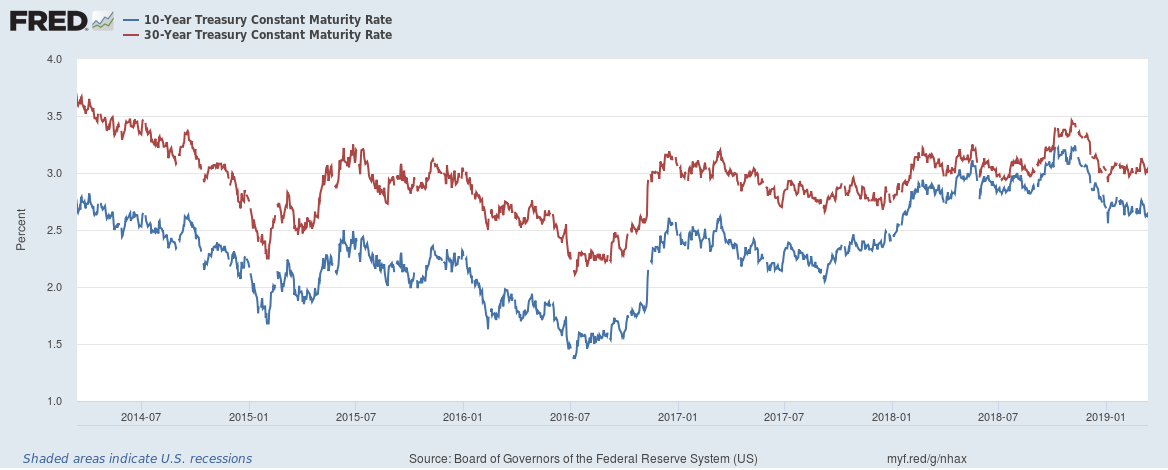
Since the end of 2018, the 30-year bond has dropped 54 basis points while the 10-year has moved 64 basis points lower (absolute basis). If the government shutdown was the only reason for the decline, rates should have increased by now. The fact they're still lower indicates traders see little to no inflationary pressure, which is another way of saying "slowing growth".
Today we received additional economic numbers that raised concerns. Leading economic consultancy IFO halved their German GDP projection for 2019, dropping their estimate form 1.1% to .6%. Germany has been experiencing economic problems for the last 6 months. GDP contracted in 3Q18 and was stagnant in 4Q18. Recent industrial production numbers have been weak. Chinese data continues to be weaker as well.
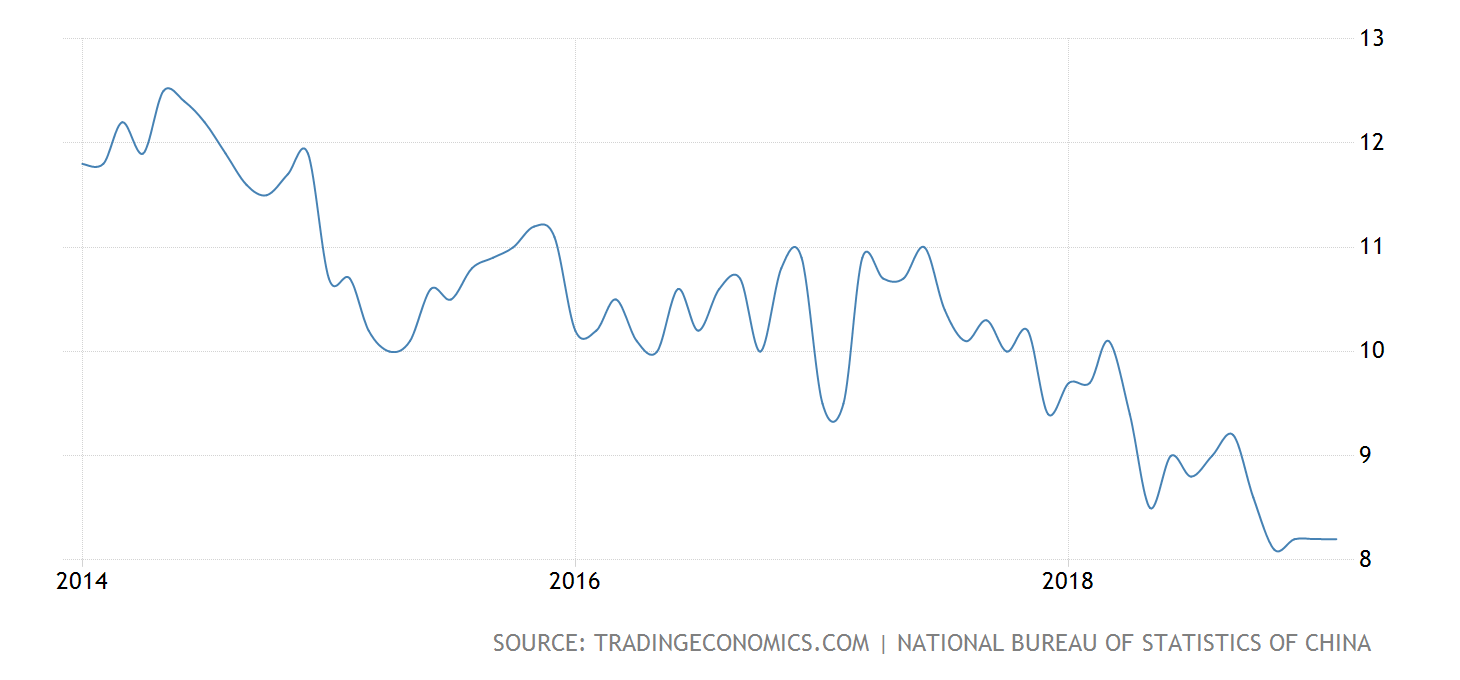
Retail sales are in a clear downtrend ...
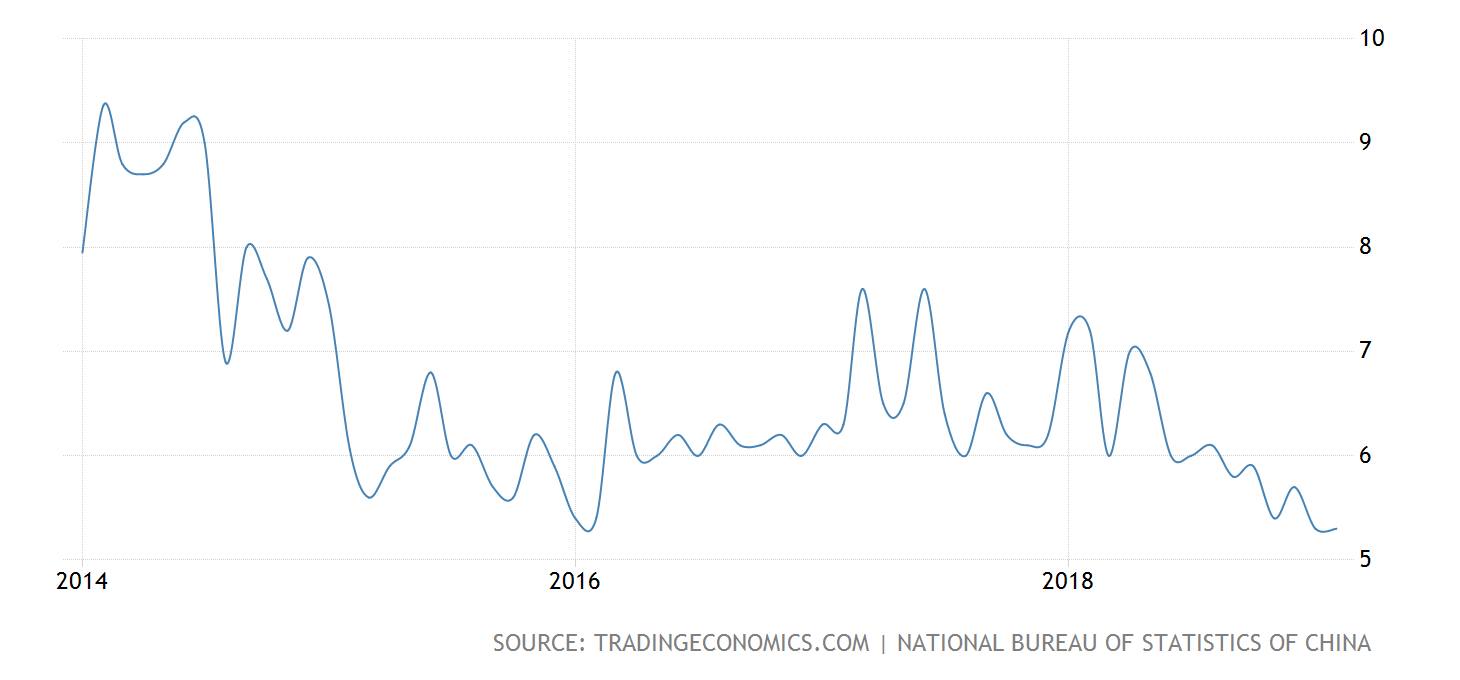
... as is industrial production.
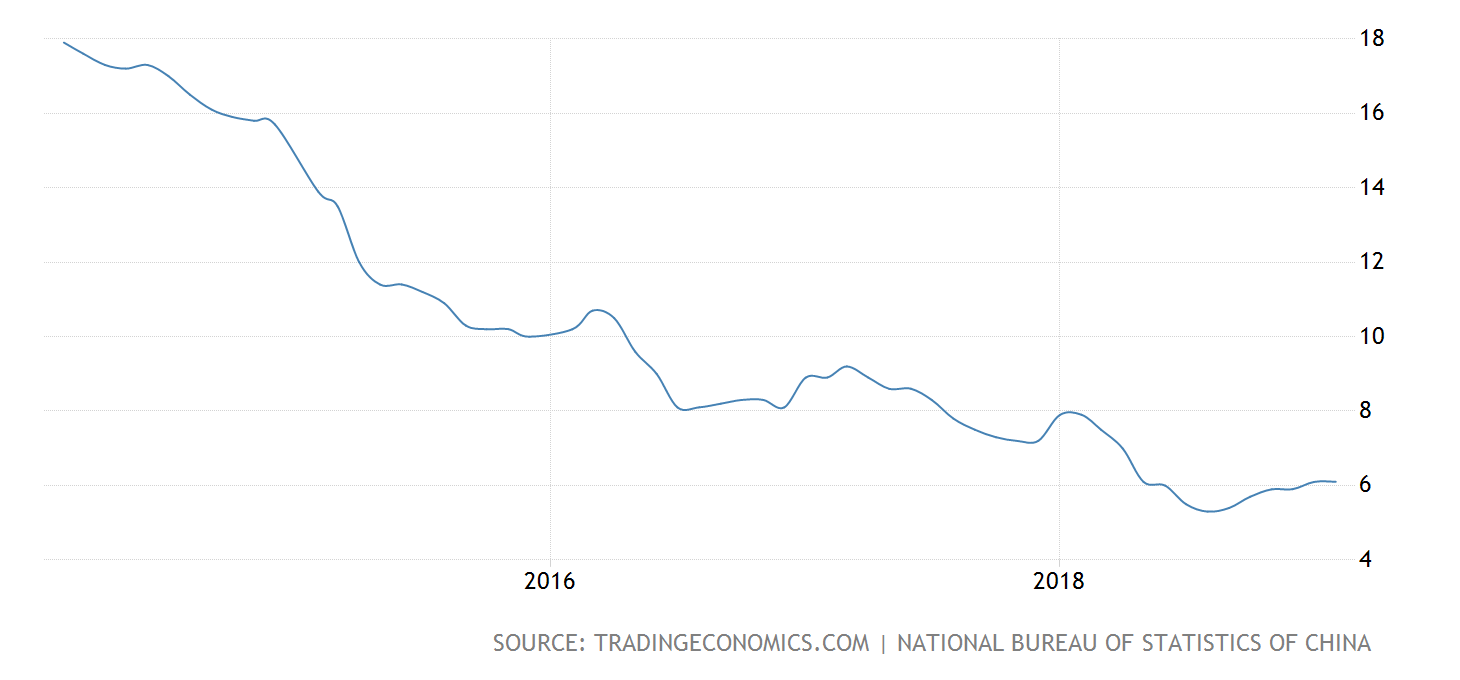
Fixed asset investment has risen a bit, but is still weak.
Today, the markets really didn't move that much. The larger caps fluctuated around 0; the iShares Russell 2000 (NYSE:IWM) was off -.45.
I want to return to a point that I've been stressing over the last week, which is that this rally really doesn't "feel" right. Let's look at a few more charts to explain what I mean.
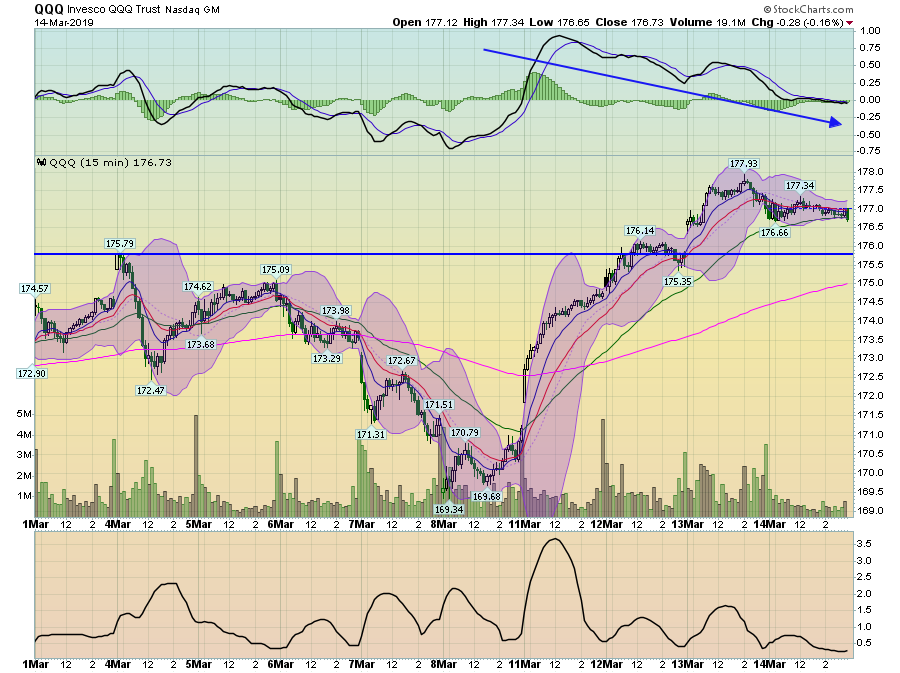
The 2-week Invesco QQQ Trust Series 1 (NASDAQ:QQQ) chart is solid. Prices have moved through highs from March 4. After reaching a new peak, they traded down to the 50-day EMA. The MACD is setting up for a solid move higher.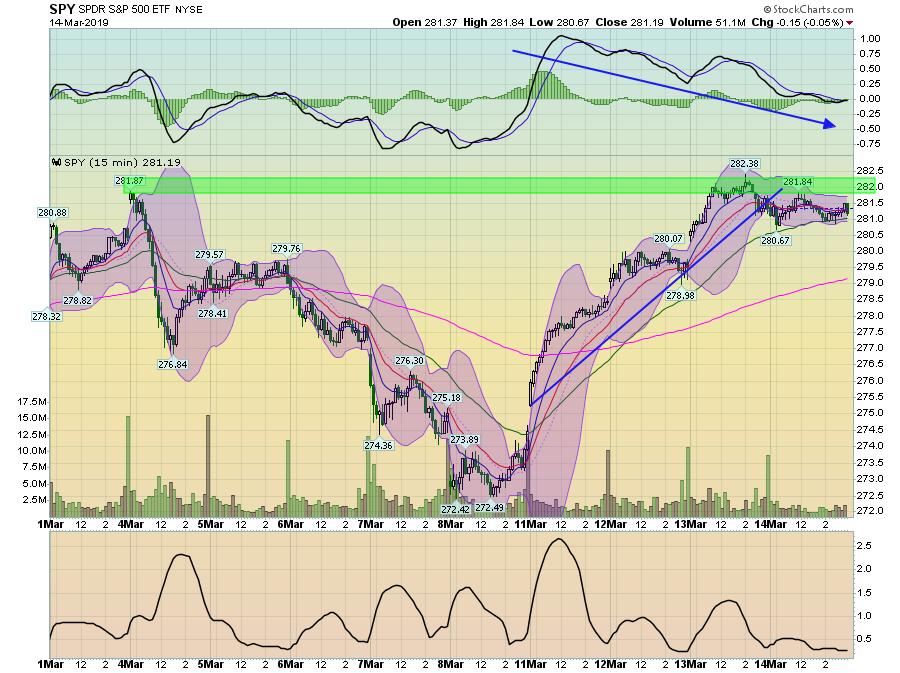
The SPY (NYSE:SPY) hit resistance at 281, where prices hit a high at the open on March 4. Prices have traded lower, and, like the QQQ, have hit support at the 50-day EMA. The MACD has moved lower, which gives the index room to run. This chart could be interpreted as an index getting ready for a second run higher. And the QQQ's performance could lead an analyst to believe that would happen soon.
iShares S&P Midcap 400 (NYSE:IJH)
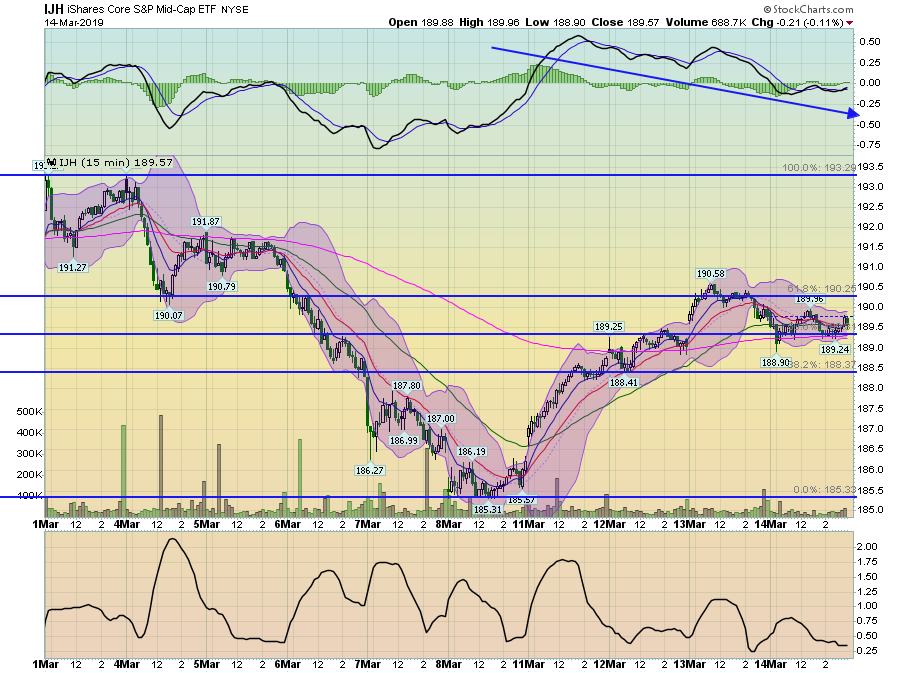
But then we have the mid-caps. They rallied to the 61.8% Fib level but fell back to the 50% Fib level and the 200-minute EMA. 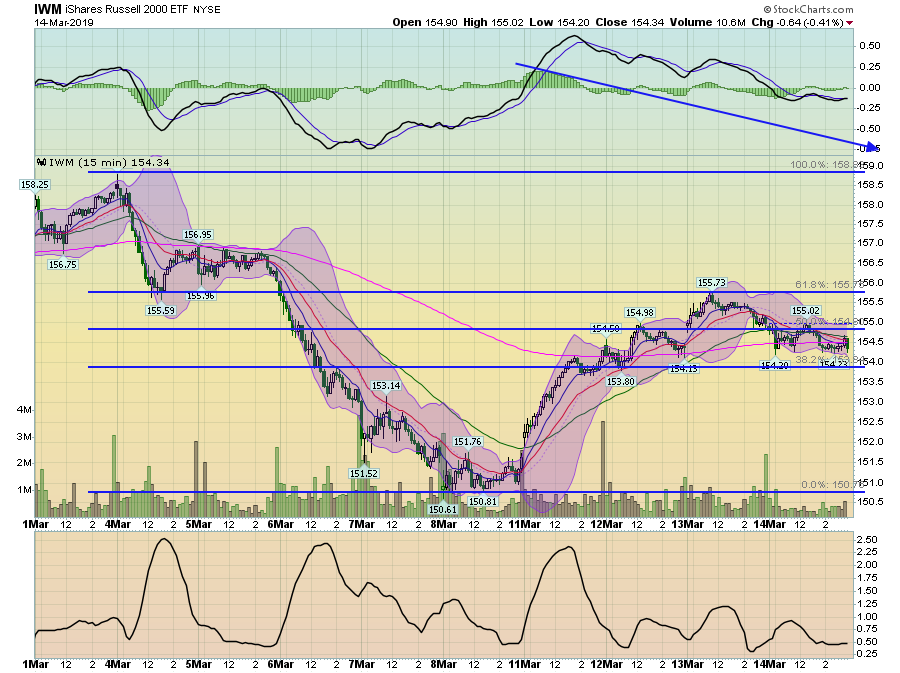
The IWM's pattern is following the IJH to a "t".
And then we have the Treasury market:
iShares 7-10 Year Treasury Bond (NASDAQ:IEF)
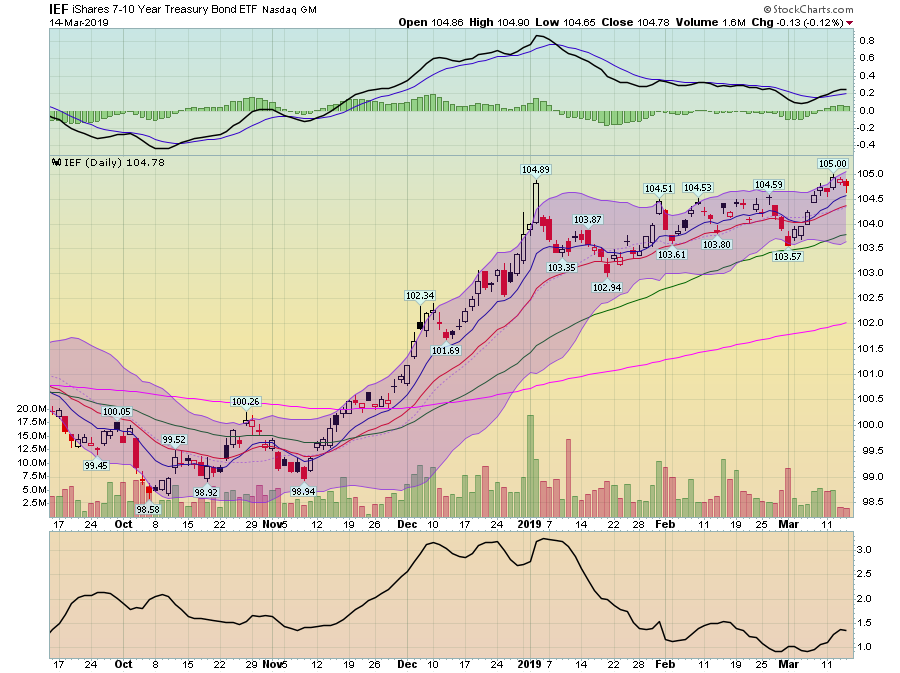
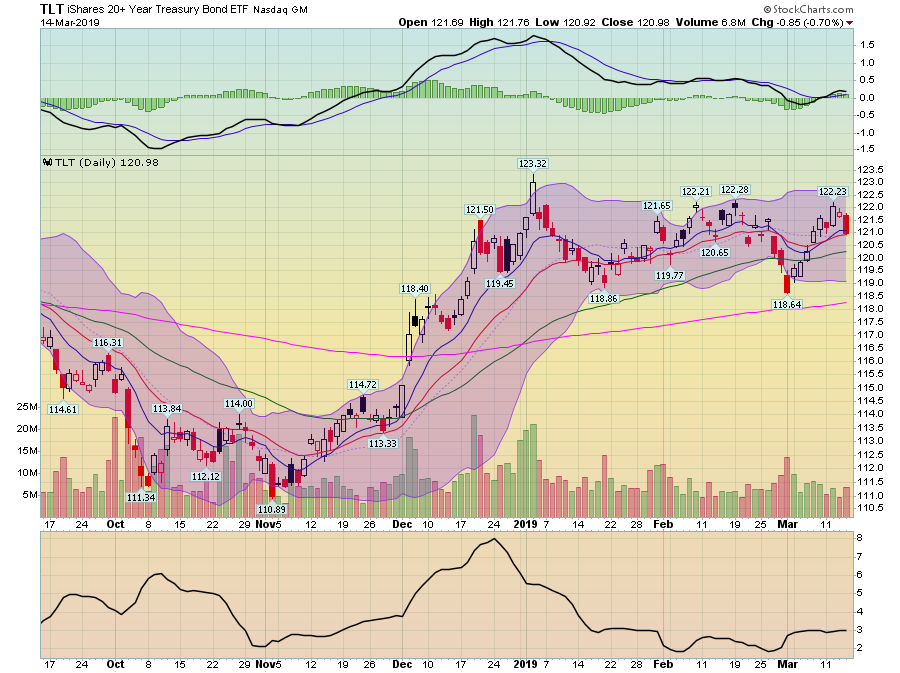
Both the belly of the curve (the IEF, top chart) and the long-end of the market (the iShares 20+ Year Treasury Bond (NASDAQ:TLT), bottom chart) are trading near 6-month highs.
Here's the problem. The rising SPY and QQQ says growth will continue at a strong pace. But the lack of performance form the mid and small caps says, "maybe not." And then we have the Treasury market, which is saying, "growth will be slow." One market has to be wrong. And I'm inclined to think it's the large caps.
Disclosure: I/we have no positions in any stocks mentioned, and no plans to initiate any positions within the next 72 hours. I wrote this article myself, and it expresses my own opinions. I am not receiving compensation for it (other than from Seeking Alpha). I have no business relationship with any company whose stock is mentioned in this article.
