Technically Speaking For March 11
Summary
- Inflation expectations are somewhat higher.
- Retail sales rebounded, but we're not out of the woods with this data set just yet.
- The indexes had a strong day, but the best charts for the day are from defensive sectors.
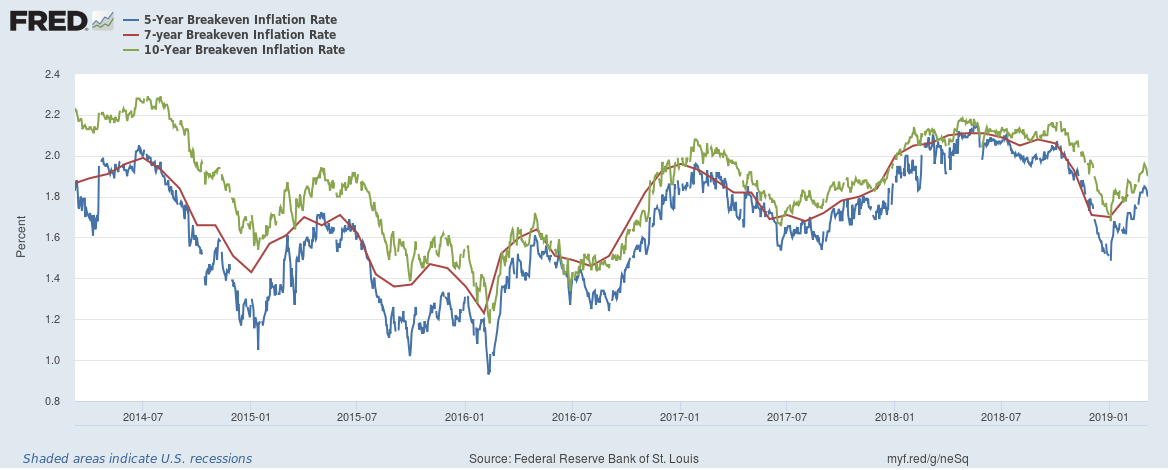
Inflation expectations are up modestly in the last few months:
5-year expectations are up 36 basis points while 10-year expectations increased 26 basis points (on an absolute basis). Both remain below the highs of 2018. Remember that inflation is directly linked to growth; the two rise and fall in tandem. Don't get too excited about the increase, however. The latest economic news has been weak (the ECB announced new stimulus measures; China is clearly slowing; three U.S. coincidental indicators have surprised to the downside) which will probably contain growth expectations going forward.
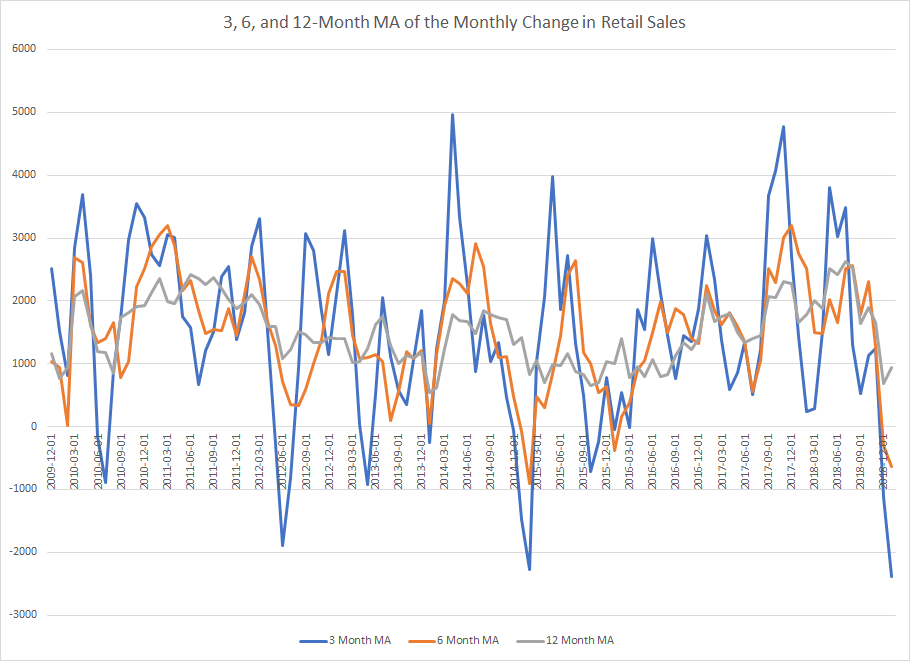
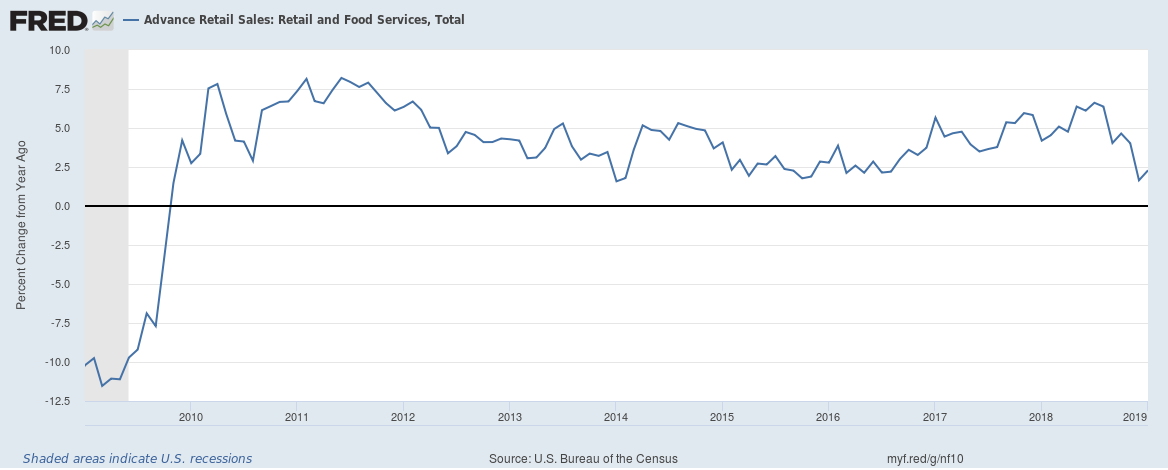
The latest retail sales report was modestly better. Sales were up .2% overall; they increased .9% ex-auto and 1.2% ex-auto and gas stations. Building material sales rose a strong 3.3% (but furniture store sales were off 1.2%). Health and personal care sales advance by 1.6% while sporting goods sales were 4.8% higher. Auto sales were the big losers, declining 2.4%. Let's look at this data from two perspectives:
Data from the St. Louis FRED System; Author's Calculations
Even using moving averages, the monthly change in retail jobs is still volatile. The 3 and 6-month moving average are both currently negative; this has happened twice in the last 10 years.
The Y/Y percentage change has been dropping since August of last year. This data has declined before, but it has not done so as sharply as the last six months.
In today's FT, Christine Lagarde of the IMF proposes a new way to tax companies. They are proposing:
- Some type of minimum tax for home country jurisdictions, and
- Some type of system for "routine" profits.
The OECD - which wrote the model tax treaty that governs all intra-country transactions - has been at work over the last few years on BEPS (Base Erosion and Profit Shifting). These proposals are supposed to reduce the income shifting techniques of high-tech companies. The IMF proposal adds to the discussion.
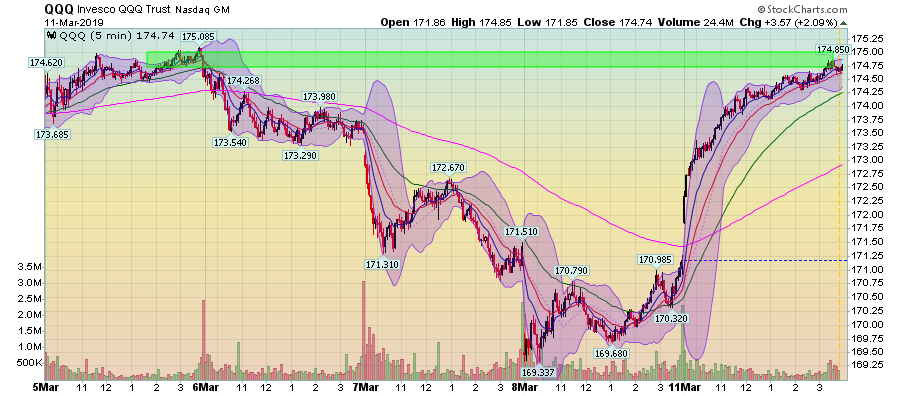
The markets had a solid day, despite the Boeing (NYSE:BA) news. Several mergers propelled the markets higher. The QQQs were the best performer, gaining 2.09%. The transports were next, rising 1.88%. There was a modest selloff in the Treasury market. Technology was the best performer due to mergers. Energy was the next best performing sector, thanks to bullish news about U.S. production. Utiliities were at the bottom of the pack, advancing .7%.
The 5-day chart of the QQQ shows that today, it erased most of last week's losses:
This is a strong rally. Prices gapped at the open and then continued higher for the remainder of the trading session. Prices hit resistance in the mid-174 area where there was a fair amount of price action on the 5th.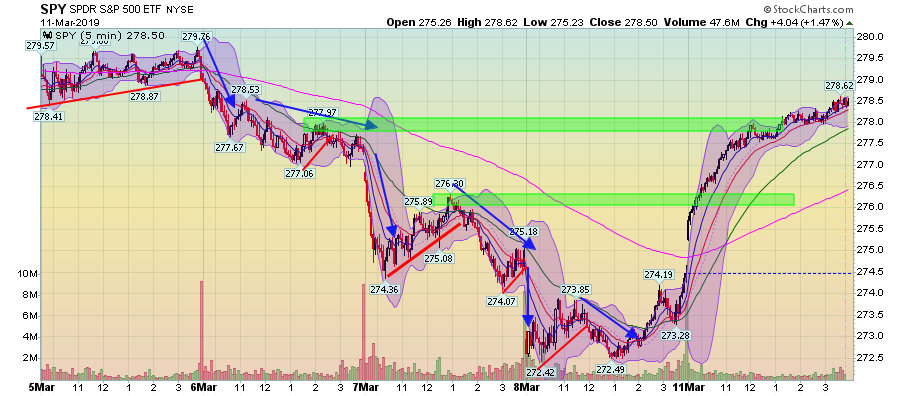
The previous four days contained a large number of down arrows, notated in blue. Today, the SPY gapped higher at the open and, like the QQQ, traded higher for the remainder of the session. Prices moved through two key areas of resistance at the 276 and 278 level.
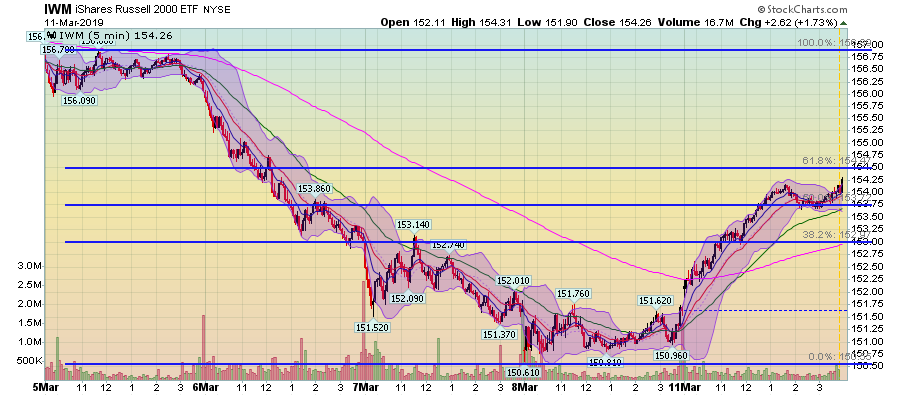
The IWM rallied with the other indexes. It also moved through two key areas of resistance and currently sits between the 50% and 61.8% Fibonacci levels.
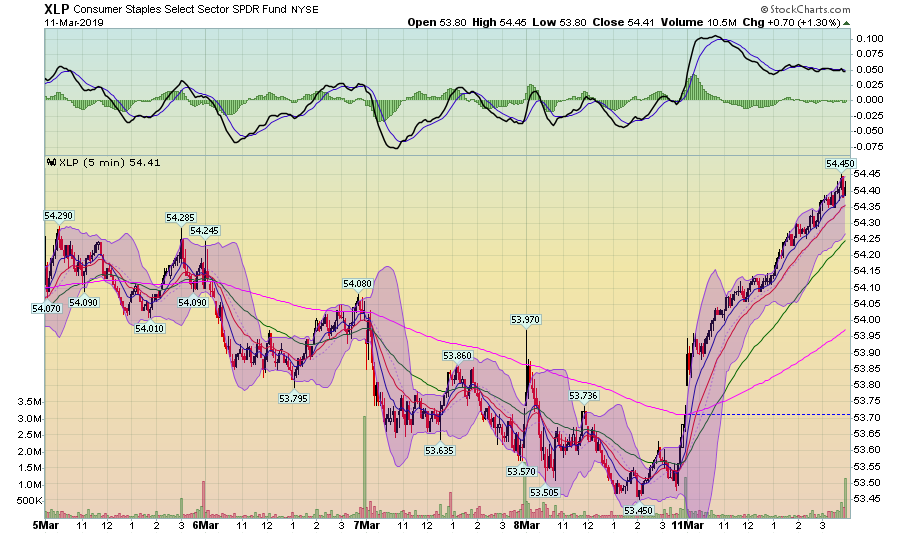
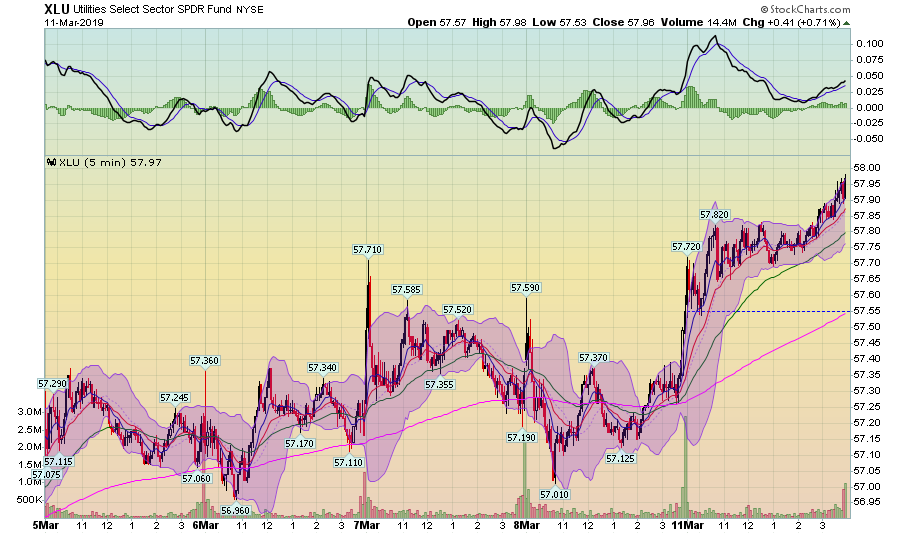
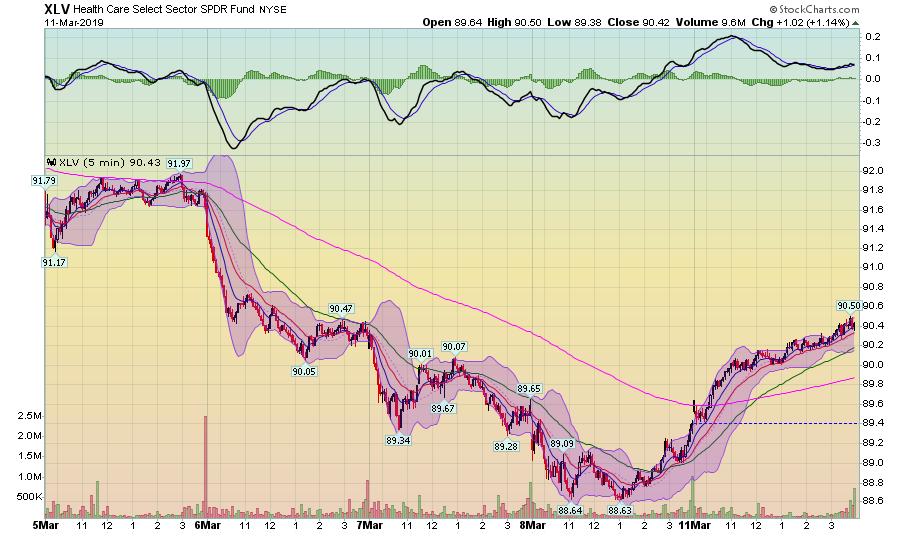
Beneath the surface, however, there is a potential worry. The best-looking industry charts from today's action are defensive sectors:
Consumer Staples gapped at the open then rallied strongly for the rest of the session.
Utilities jumped at the open, consolidated until 2PM, and then rallied into the close.
Healthcare has two trajectories. The first is a sharp rally at the open followed by a more gentle rally for the rest of the day.
Still, this was a great way to start a week, especially with last week's selloff.
Disclosure: I/we have no positions in any stocks mentioned, and no plans to initiate any positions within the next 72 hours. I wrote this article myself, and it expresses my own opinions. I am not receiving compensation for it (other than from Seeking Alpha). I have no business relationship with any company whose stock is mentioned in this article.

