Technically Speaking For June 17
Summary
- Global bond yields are tumbling lower.
- The latest Beige Book had a number of hedging comments regarding current economic developments.
- The markets continue to telegraph a slowdown.
According to the Financial Times, the U.S. Chamber of Commerce is lobbying the administration to re-open trade talks with China. Here is the key paragraph from their letter:
The U.S. Chamber is the latest major organization to note that trade uncertainty is hurting global growth. It joins the IMF and World Bank, who both recently noted that trade tensions have not only slowed growth but lowered growth projections. Several central banks (the RBA and Central Bank of India) have specifically noted trade problems issue in their latest rate announcements. For several months, the Markit PMI manufacturing data has stated that export orders are down. Regrettably, it's doubtful the current administration will change tactics; tariffs are hard-wired into its policy DNA.
Global bond yields are tumbling:
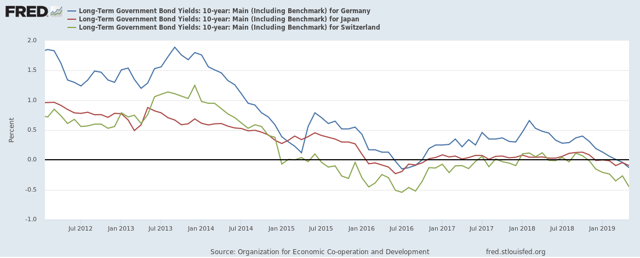
Above are the yields for long-term German, Japanese, and Swiss bonds. All three are now trading below 0%. This tells us that growth concerns are global. It also indicates that the markets increasingly think central banks are more likely to cut rates in the near future.
It's Fed week. Let's review with the following summation from the latest Beige Book, which was released on June 5 (emphasis added):
Economic activity expanded at a modest pace overall from April through mid-May, a slight improvement over the previous period. Almost all Districts reported some growth, and a few saw moderate gains in activity. Manufacturing reports were generally positive, but some Districts noted signs of slowing activity and a more uncertain outlook among contacts. Residential construction and real estate both showed overall growth, but both sectors saw wide variation in sentiment across Districts. Reports on consumer spending were generally positive but tempered. Tourism activity was stronger, especially in the Southeast, but vehicle sales were lower, according to reporting Districts. Loan demand was mixed but indicated growth. Agricultural conditions remained weak overall, but a few Districts reported some improvements. The outlook for the coming months was solidly positive but modest, with little variation among reporting Districts.
There's an awful lot of hedging (which I've italicized) in the above paragraph: manufacturing was good - but there are signs of slowing. Housing is good - but there's a wide variation across districts. All this hedging indicates that the Fed is hearing a number of "on the other hand" comments from the regional contacts which are used to compile the Beige Book.
My basic market thesis: the markets are most likely topping and continue to act in an end-of-the-economic-cycle manner. Bonds are rallying as traders increase their predictions that the Fed will lower rates soon. Micro and small-caps are underperforming larger-caps and defensive sectors (utilities, staples, and real estate) are generally outperforming more aggressive sectors.
Let's turn to today's performance table:
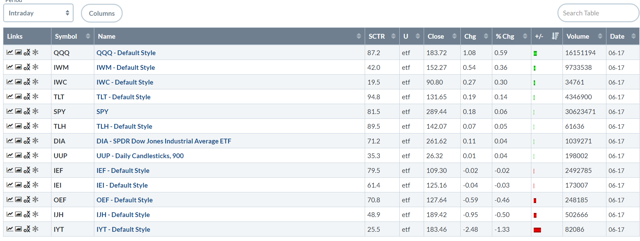
Not bad. The QQQs led the pack, moving about 0.6% higher. Then we have the small and micro-caps - which have needed to move higher - occupying the second and third spot. This is an especially healthy development. However, the TLTs (the long-end of the Treasury market) is the fourth best performer, and it's sandwiching the SPYs with the TLH. That's a less than bullish orientation.
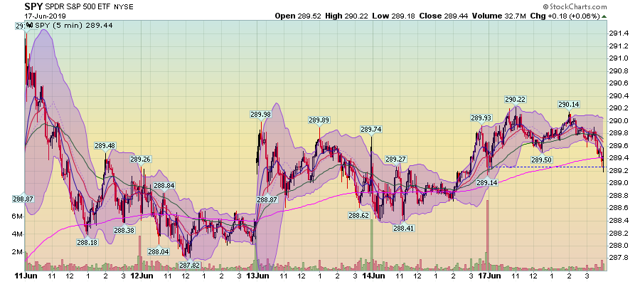
Let's turn to the charts, starting with the last five days for the SPY:
There really hasn't been much movement overall. The SPY moved lower on June 11 and has had a slightly upward sloping trend since. But overall, this is mostly statistical noise than meaningful movement. 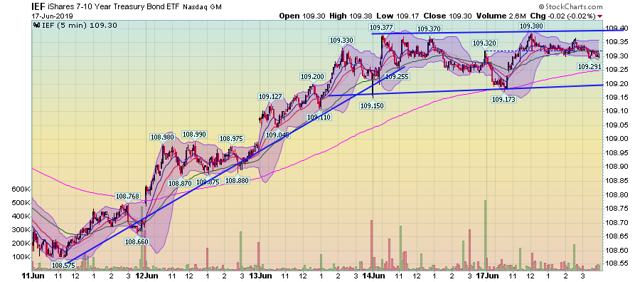
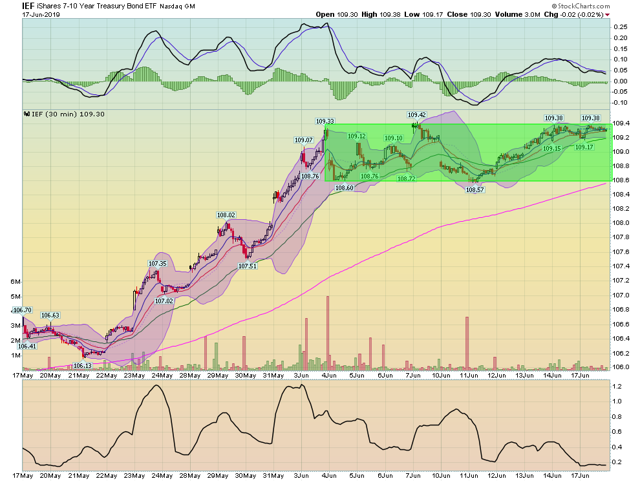
It's the Treasury market that has moved higher. Prices advanced between June 11-13 and have moved sideways over the last two trading sessions, consolidating gains.
The 30-day charts show that today's action is simply a continuation of recent trends.
The IEFs are continuing to move sideways after a strong run higher at the end of May.
As are the SPYs.
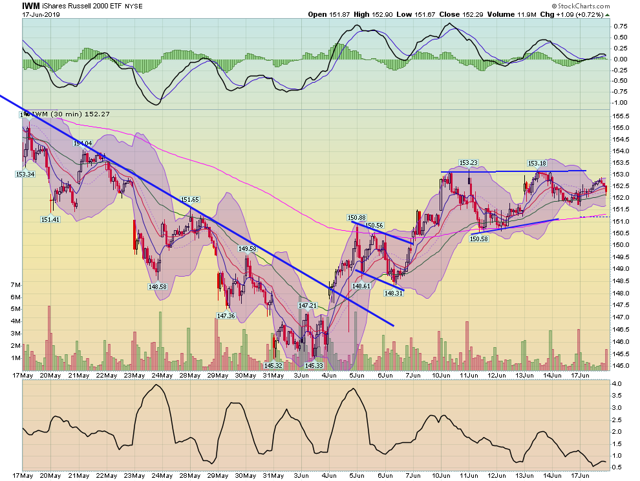
Meanwhile, the IWM is consolidating sideways, but about 2/3 of the way up from its late May selloff. The latter occurred while the SPY was moving higher.
And that is the problem. The Treasury market is consolidating after a rally - as is the SPY. Meanwhile, the IWM is having a difficult time making upward progress. In other words, the markets are continuing to send us the slowdown signal: the bond market is saying the Fed will cut rates and the stock market is saying the economy will slow.
Which stock should you buy in your very next trade?
AI computing powers are changing the stock market. Investing.com's ProPicks AI includes 6 winning stock portfolios chosen by our advanced AI. In 2024 alone, ProPicks AI identified 2 stocks that surged over 150%, 4 additional stocks that leaped over 30%, and 3 more that climbed over 25%. Which stock will be the next to soar?
Unlock ProPicks AI

