Summary
- The Conference Board's LEI index is contracted.
- Oil prices aren't a concern.
- Overall the charts are very messy right now.
The Conference Board's Leading Indicator Index declined in the latest report (emphasis added):
“The U.S. LEI fell in June, the first decline since last December, primarily driven by weaknesses in new orders for manufacturing, housing permits, and unemployment insurance claims,” said Ataman Ozyildirim, Senior Director of Economic Research at The Conference Board. “For the first time since late 2007, the yield spread made a small negative contribution. As the U.S. economy enters its eleventh year of expansion, the longest in U.S. history, the LEI suggests growth is likely to remain slow in the second half of the year.”
Here's a chart of the data from Briefing.com:
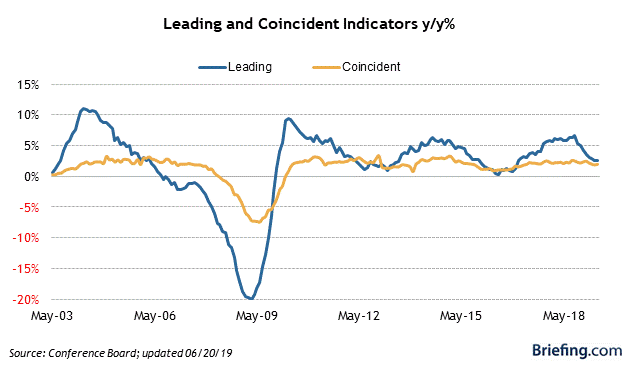
I break this data out into individual components in my Turning Points newsletter, where I have a 20% recession probability in the next 6-12 months (see here and here). 1-unit building permits have been declining for over a year; the belly of the yield curve has been modestly inverted since January; and, the 4-week moving average of initial unemployment claims appears to have bottomed, meaning it has nowhere to go but up -- and into a pre-recession pattern.
Despite the rising Middle East tensions, oil prices are still contained:
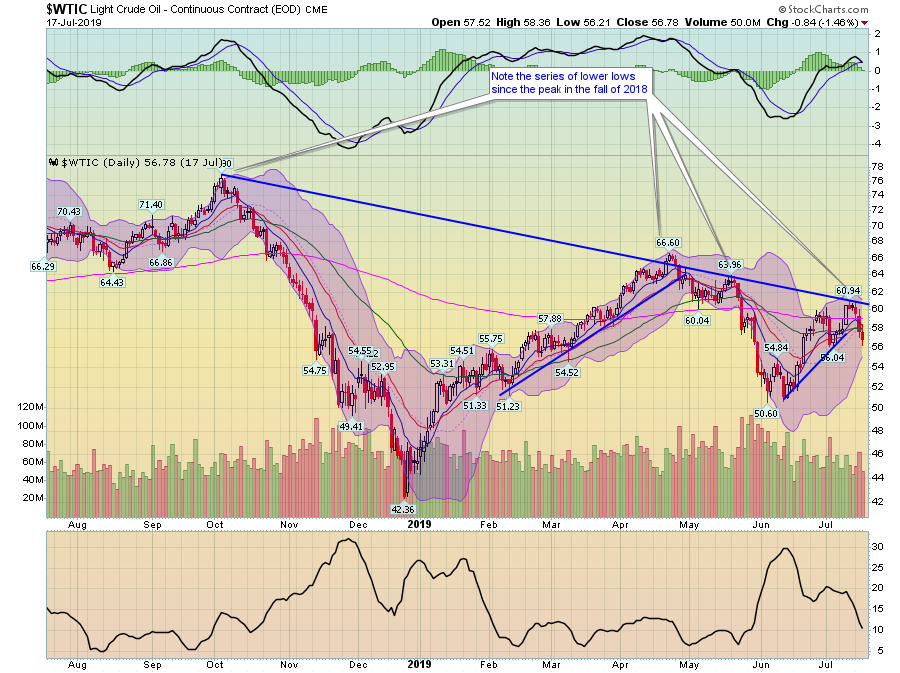
Oil prices have had two rallies since the very end of 2018. The first started in December 2018 and ended in late April 2019; prices rallied from 42.36 to 66.6 for a gain of 57%. The second rally only lasted a month and half (June through mid-July) with a much smaller 20% gain. Notice the series of lower highs that prices printed from October of last year to July 2019. As oil prices are a primary or secondary cause of most post-WWII recessions, this is a good development.
The two-month charts of international ETFs are mostly bullish:

Above are 12 charts of ETFs that track global equity markets. Most are rising. The UK (middle row, second from left), China (middle row, second from right) and Russia (bottom row, second from right) have stabilized in some manner. Stabilizing isn't fatal; it could just as easily mean that prices are consolidating for another move higher, although in the case of the UK and China that's doubtful.
Let's turn to today's performance table:
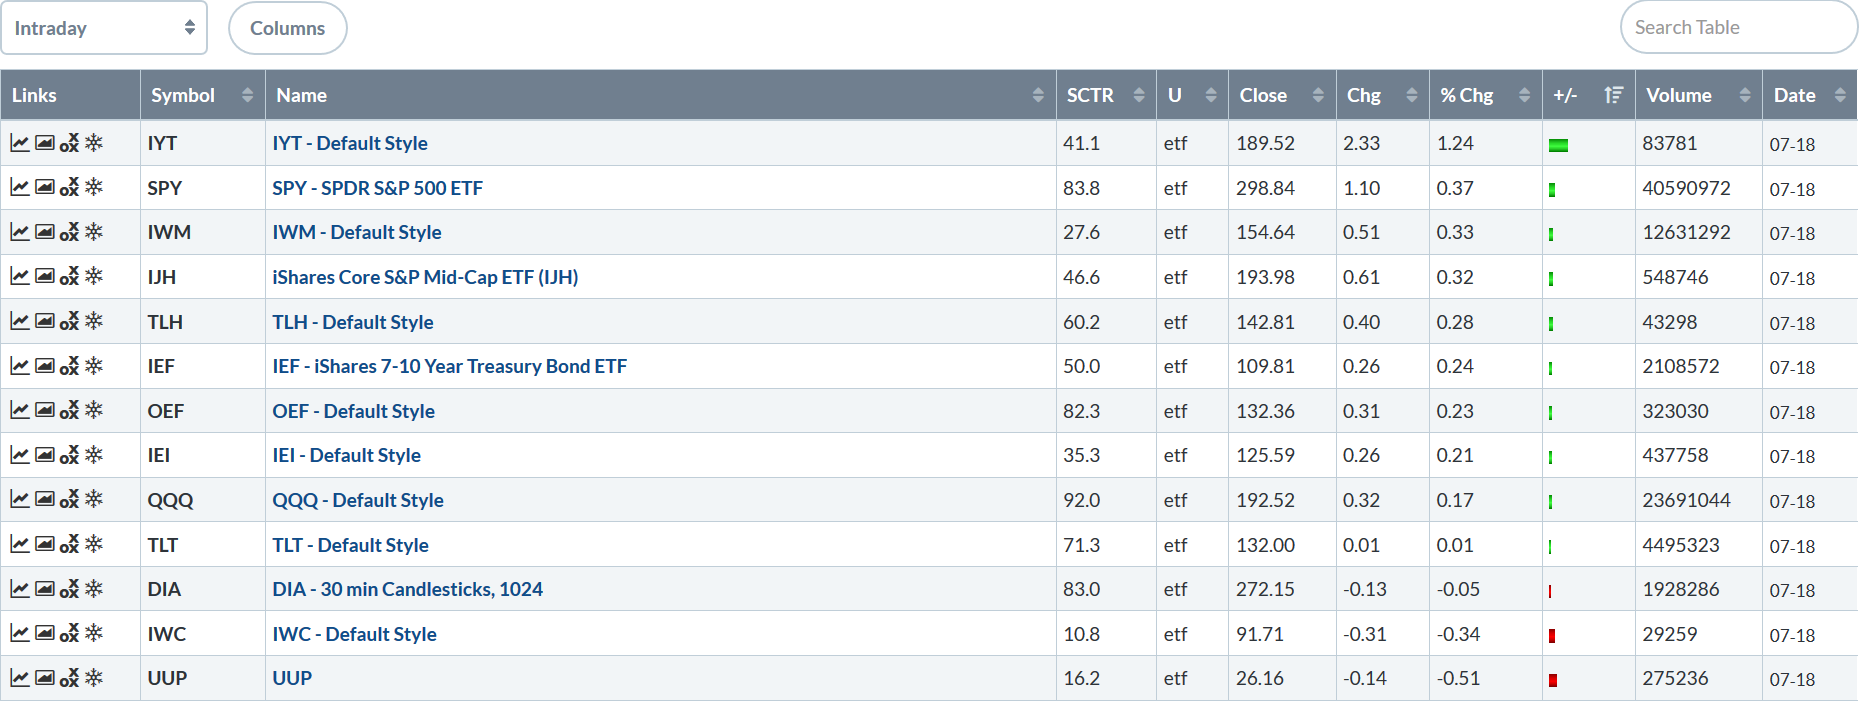
Once again, we have something of a nothing day. The transports popped over 1%, but after that, the gains get a bit sketchy. The SPYs and IWMs were up modestly, as were the mid-caps. The QQQs and DIAs hovered just above 0%.
Let's take a look at the charts, starting with the short-term and expanding out to the longer time frames.
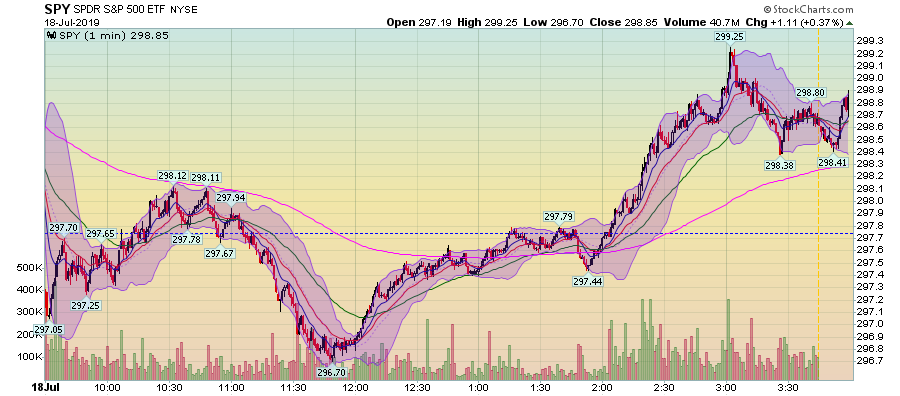
The SPY (NYSE:SPY) hovered around the unchanged level until 2PM, which it caught a bid. But prices weren't that much higher at the close.
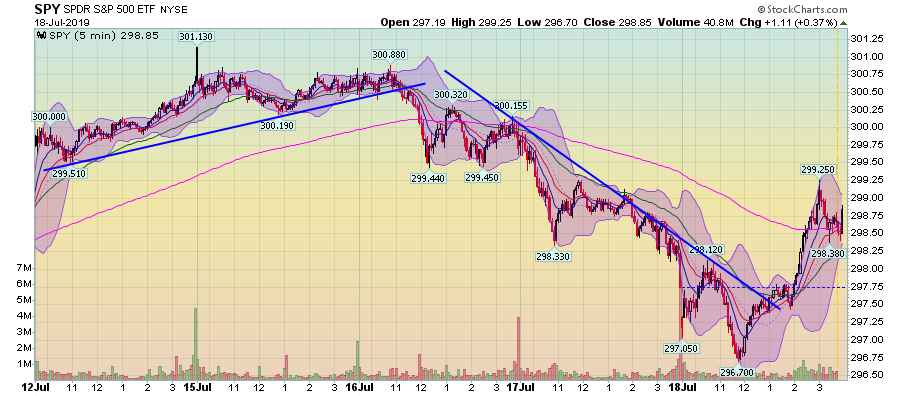
Pulling back to the 5-day time frame, the SPY has three trends: a modest uptrend from last Friday through Tuesday's open, a downtrend that lasted through this morning and, finally, today's end-of-the-session pop. The overall trend is modestly lower.
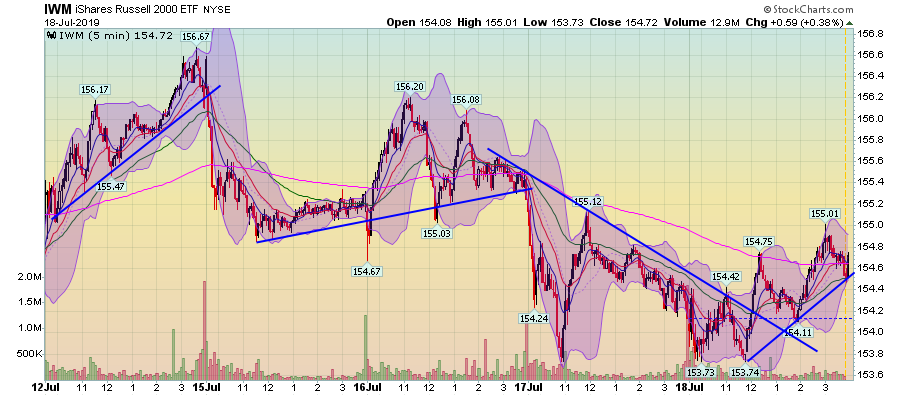
The IWM is also moving lower, but the chart is far messier. There's a fair amount of indecision above as traders continually reassess their trading positions.
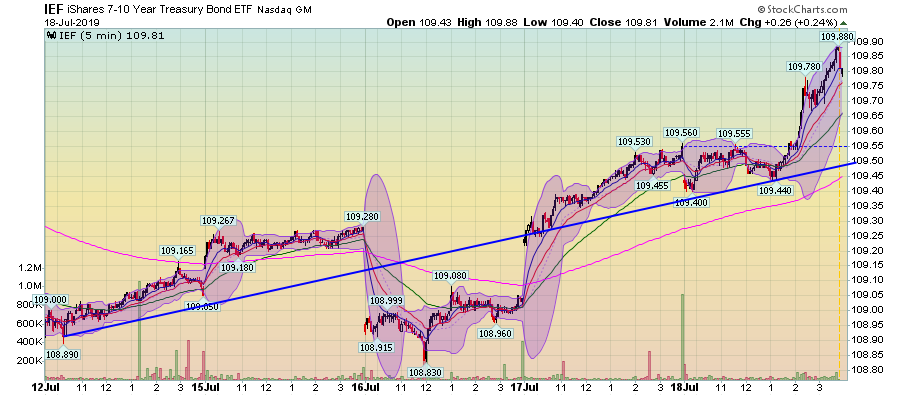
The last 5-minute chart is the IEF, which, with the exception of July 16th's trading, is in an uptrend.
There are two key 2-week charts:
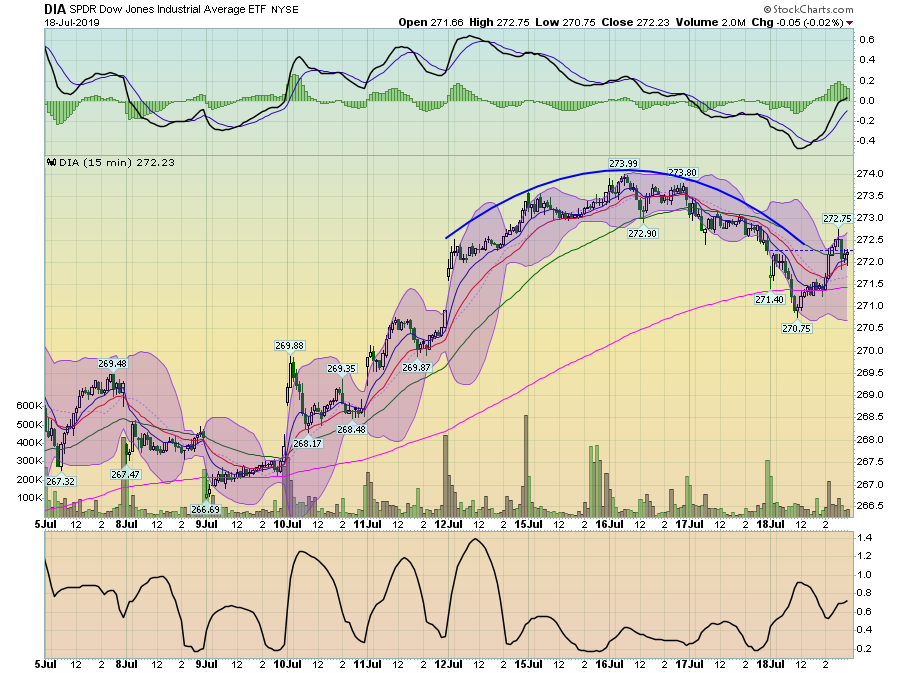
The DIA formed a rounding top between July 12-July 18. This usually means a pull-back is coming.
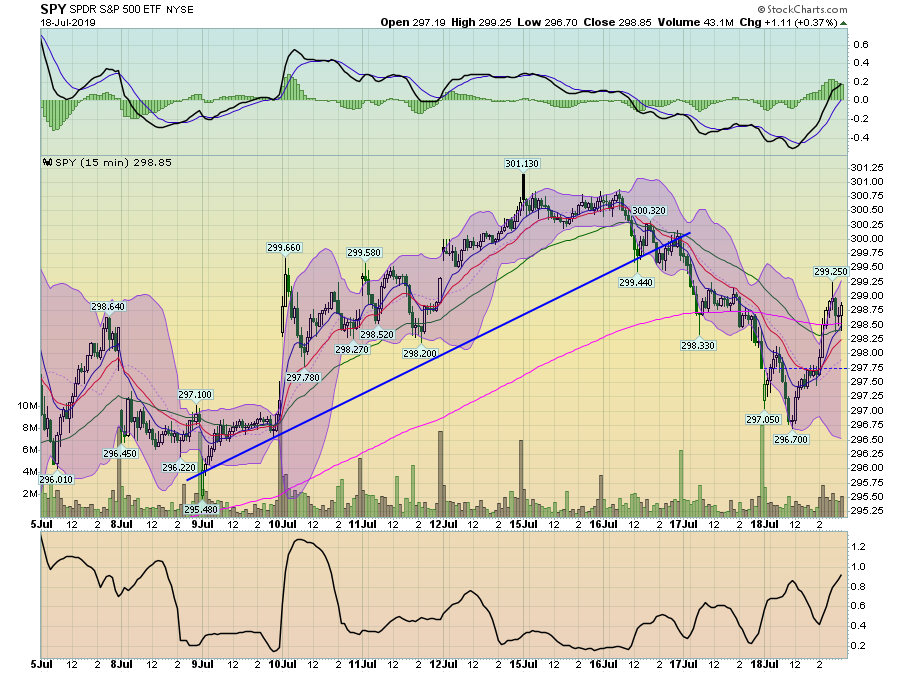
The SPY's had an uptrend between July 9 and July 16, which was broken earlier this week. Prices are slightly higher than July 5, but not much.
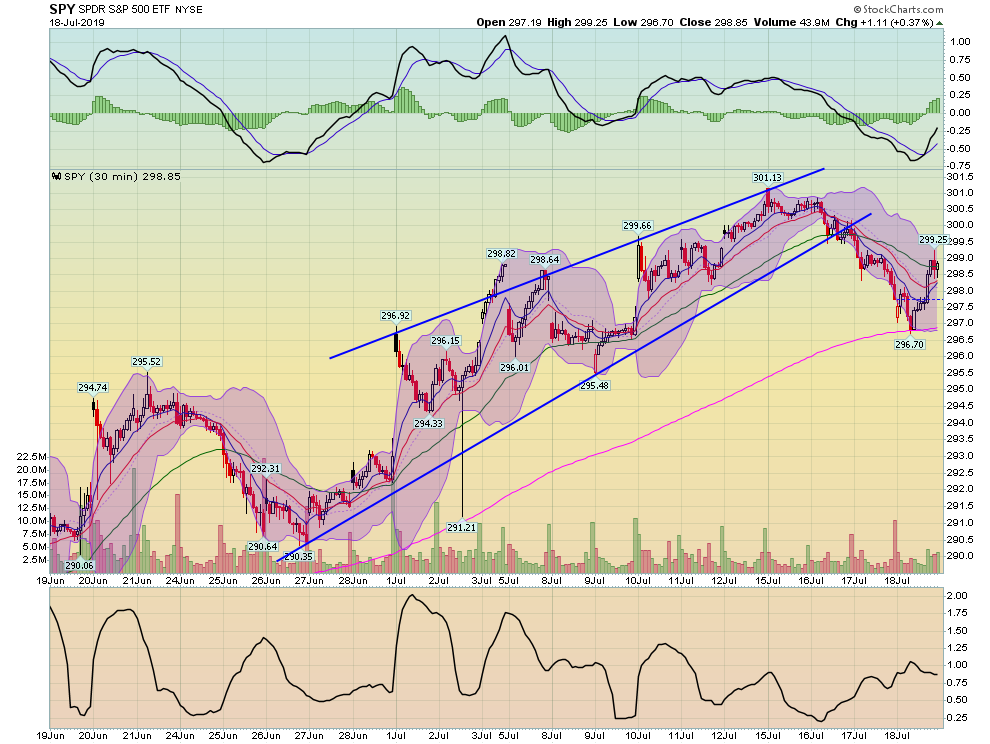
Finally is the SPY 30-minute chart which has a solid uptrend that started at the end of June, but which has now been broken.
The charts are very messy right now, which is probably a result of it being the "summer doldrums" when trading desks are lightly manned. It's hard to get a sense of the short-term trend. But look to yesterday's post, which contained long-term charts which continue to indicate we're most likely in a slow-motion top.
