Summary- EU sentiment is weakening.
- The latest manufacturing PMI showed a solid bounce from the previous weakness.
- The markets continue to advance with a solid rally.
EU sentiment remains weak. The following is from the latest Sentix report:
The overall index (top line) has consistently declined for the last six months, as has the current conditions index (middle line). Future expectations have been weak since September. There are good reasons for this concern: the latest Markit Economics manufacturing PMIs for Germany and Italy indicated a contraction while the regions overall PMI was barely above expansion (50.5).
The latest ISM PMI index rebounded from a weak January report. The overall PMI rose 2.3 to 56.6. But the big rebound in new orders is especially heartening. In the January report, this number dropped 11 points to a barely growing 51.3. In this report, that number rebounded a very healthy 6.9 point to 58.2. The tone of the anecdotal comments, however, remains mixed:
- “Unlike in the last few years, we are experiencing a first-quarter slowdown.” (Paper Products)
- “Steady supply and production environment.” (Computer & Electronic Products)
- “Concerns about oil prices are fueling questions of how strong the economy will be the first half of 2019.” (Chemical Products)
- “Overall, business continues to be good; however, margins are being squeezed.” (Transportation Equipment)
- “The federal government shutdown is impacting our ability to get new products launched. All wines need TTB [Alcohol and Tobacco Tax and Trade Bureau] approval. We are reforecasting accordingly.” (Food, Beverage & Tobacco Products)
- “We continue to enjoy the benefits of a strong general economy. We are busy and maintain a backlog of sales orders.” (Machinery)
- “Incoming orders have been steady, but we’re starting to see signs of slowing going into February and March.” (Furniture & Related Products)
- “Business conditions are good, and our demand and production are tracking to our forecasted growth levels for the year.” (Miscellaneous Manufacturing)
- “Going to be a very strong spring. Business levels will be just as good [compared to] the same time frame in 2018.” (Fabricated Metal Products)
- “Steel tariffs continue to put upward pressure on prices of downstream materials.” (Petroleum & Coal Products)
The US government has been very shy about anti-trust enforcement since its loss to Microsoft (NASDAQ:MSFT) in the 1990s. That may be changing. According to the Financial Times, there are several competing ideas for dealing with big tech. Senator Mark Warner is drafting legislation requiring tech companies to disclose to individuals how much the company is selling individual data for; others are looking to re-invigorate the DOJ's anti-trust division for more robust efforts. As for the latter, because it's been years since any truly meaningful litigation, I have to wonder about the quality of the government's counsel.
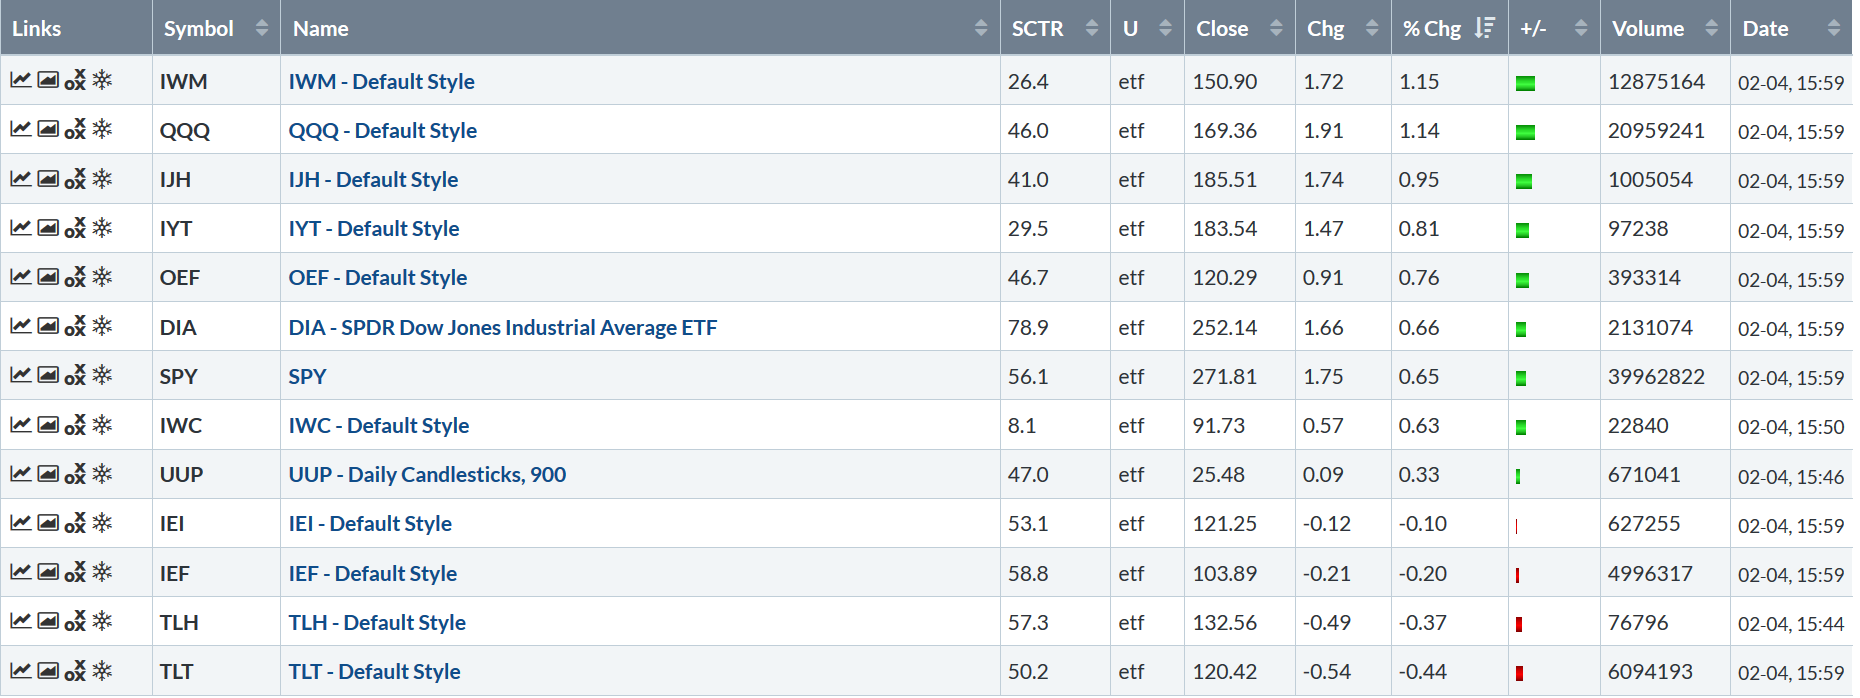
Let's turn to today's performance table:
This latest rally has been full of days like this -- prices rising by .5%-1% or slightly above. Today the IWM was the top performer, followed by the QQQ. The QQQ's strength is a good sign; tech has been lagging of late and without its participation, the market can't make significant moves higher. Mid-caps rounded out the top three performers.
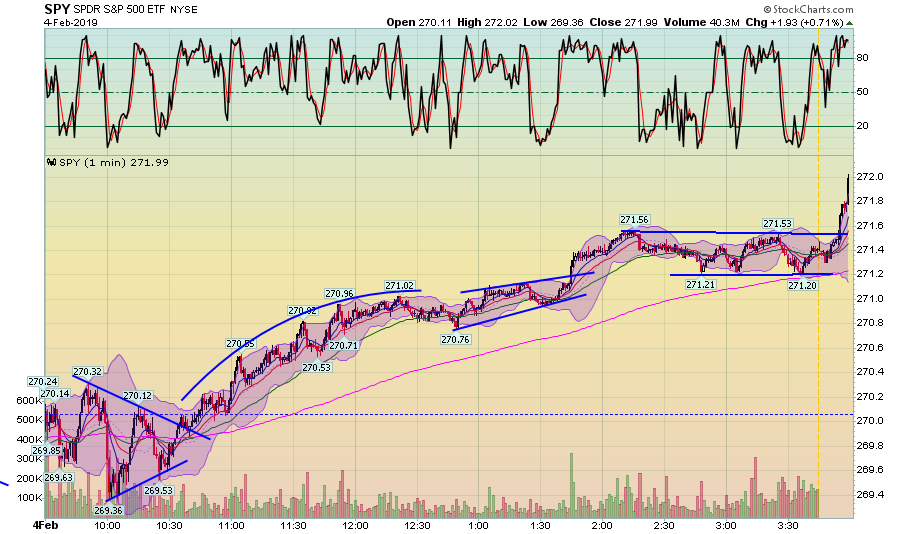
Let's take a look at the charts, which have a lot bullishness.
Today's chart is a great example of a bullish chart. At the open, prices consolidated below Friday's close. They next rallied in a small parabola followed by a slightly upward sloping consolidation pattern. They inched higher and consolidated again until the very end of trading when there was a nice upward spike.
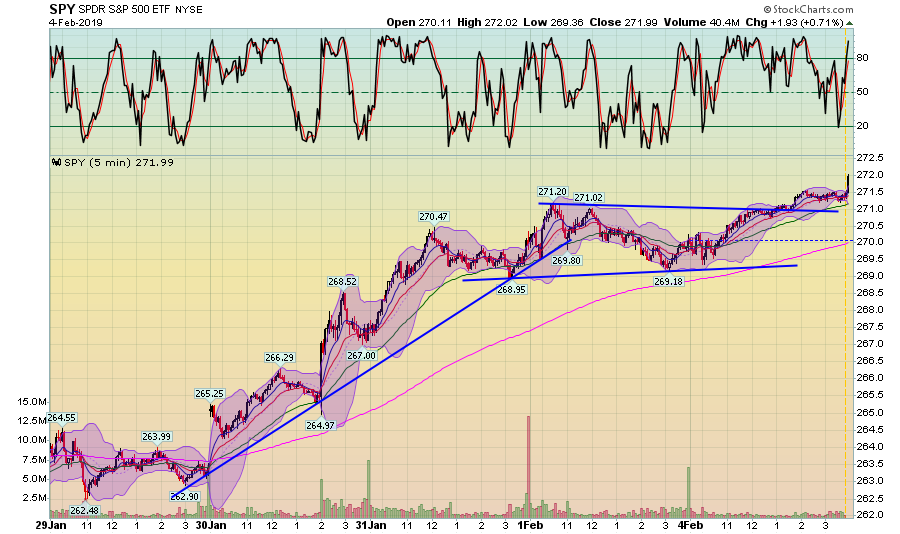
The five-day chart is just as nice:
This is a classic consolidation, rally, consolidation, and then a slight rally at the end.
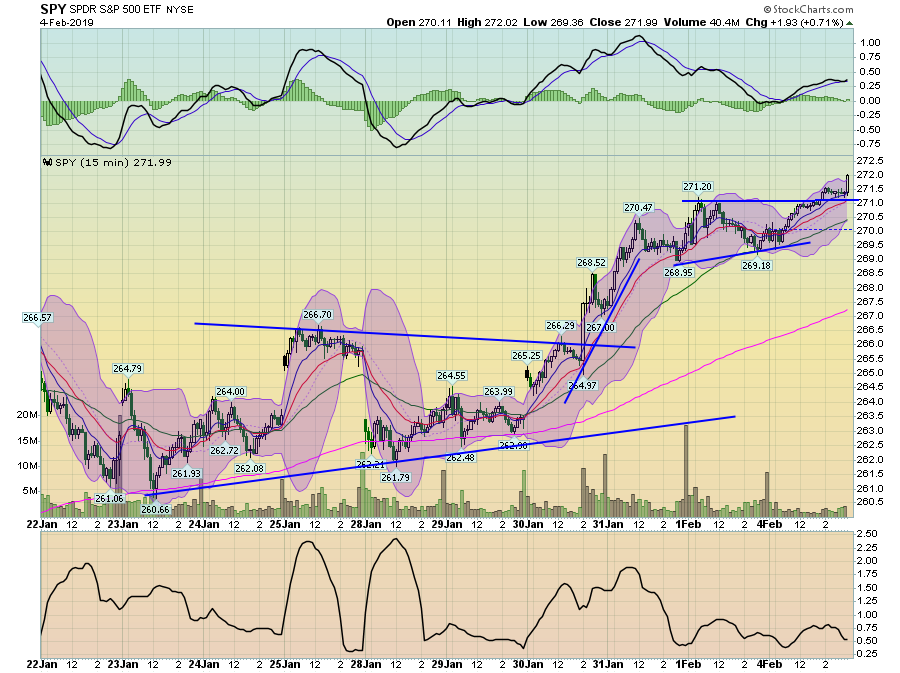
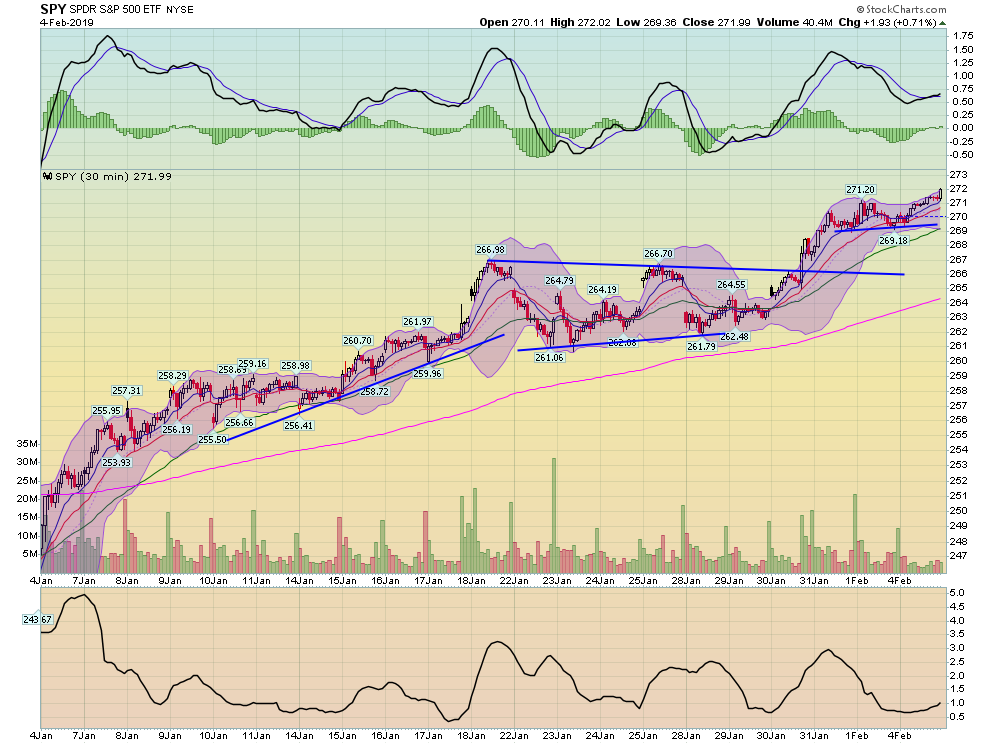
The two-week chart has a consolidation, rally, consolidation pattern over a longer time frame.
The 30-day chart also has a solid pattern of advances followed by consolidation.
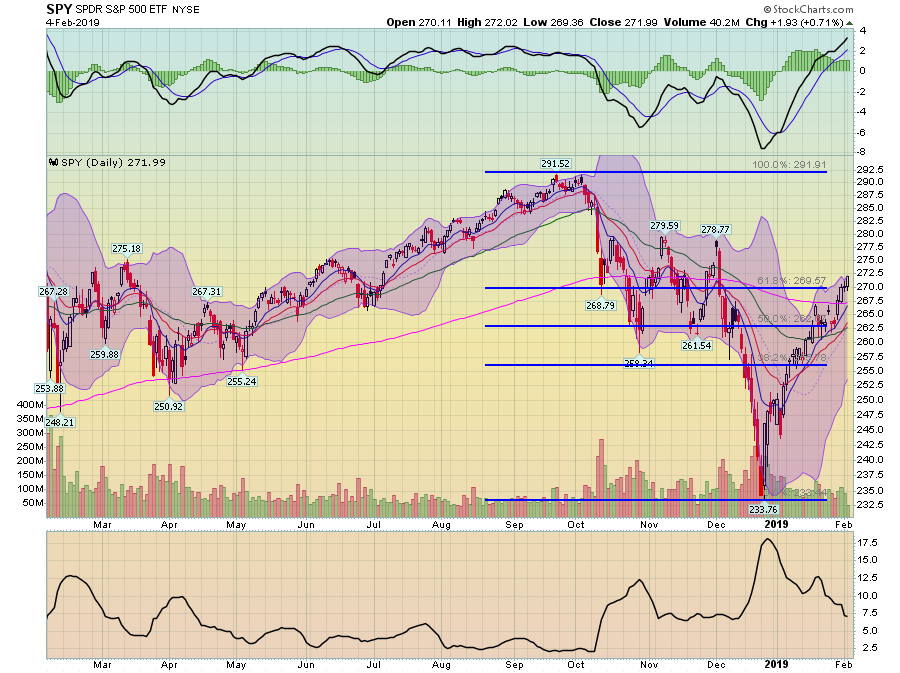
And then we have the daily chart, where prices have advanced through the 200-day EMA. The 10 and 20-day EMAs are now through the 50-day EMA; the 10-day EMA is about to move through the 200. Momentum is rising and volatility is declining.
This hasn't been the most exciting rally. But it's solidly built. The pattern of advances followed by consolidations allows for buyers and sellers to continually re-analyze their positions, granting them the time to take profits and establish new long positions. This is a rally that could have legs over the spring.
Disclosure: I/we have no positions in any stocks mentioned, and no plans to initiate any positions within the next 72 hours. I wrote this article myself, and it expresses my own opinions. I am not receiving compensation for it (other than from Seeking Alpha). I have no business relationship with any company whose stock is mentioned in this article.


