Summary
- NY Fed President Williams recently argued that further rate hikes are necessary.
- Asian news points towards continued Chinese weakness.
- The markets had modest gains today.
NY Fed President Williams on interest rates (emphasis added):
New York Fed President John Williams on Tuesday said he was comfortable with the level U.S. interest rates are at now and that he sees no need to raise them again unless economic growth or inflation shifts to an unexpectedly higher gear.
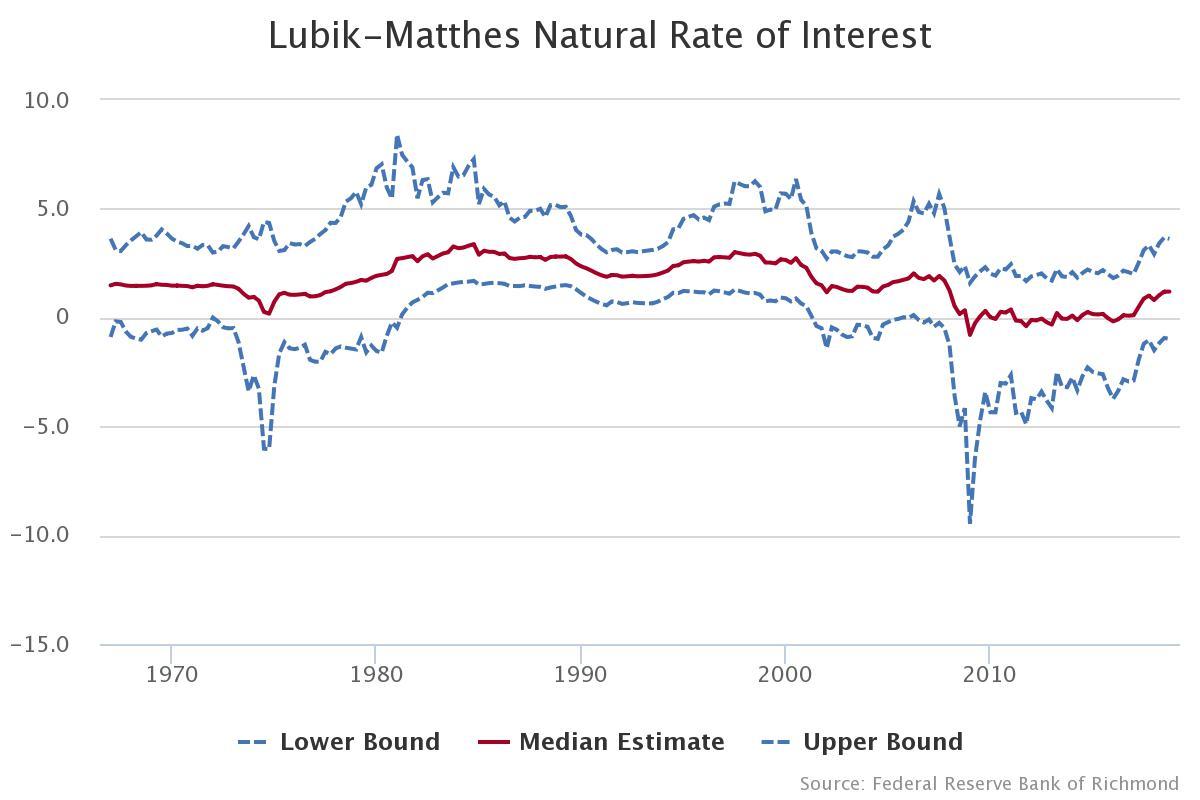
This continues the trend of Fed Presidents becoming dovish. To compare current rates to r-star, here's a chart from the Richmond Fed using the Lubik-Matthes computations:
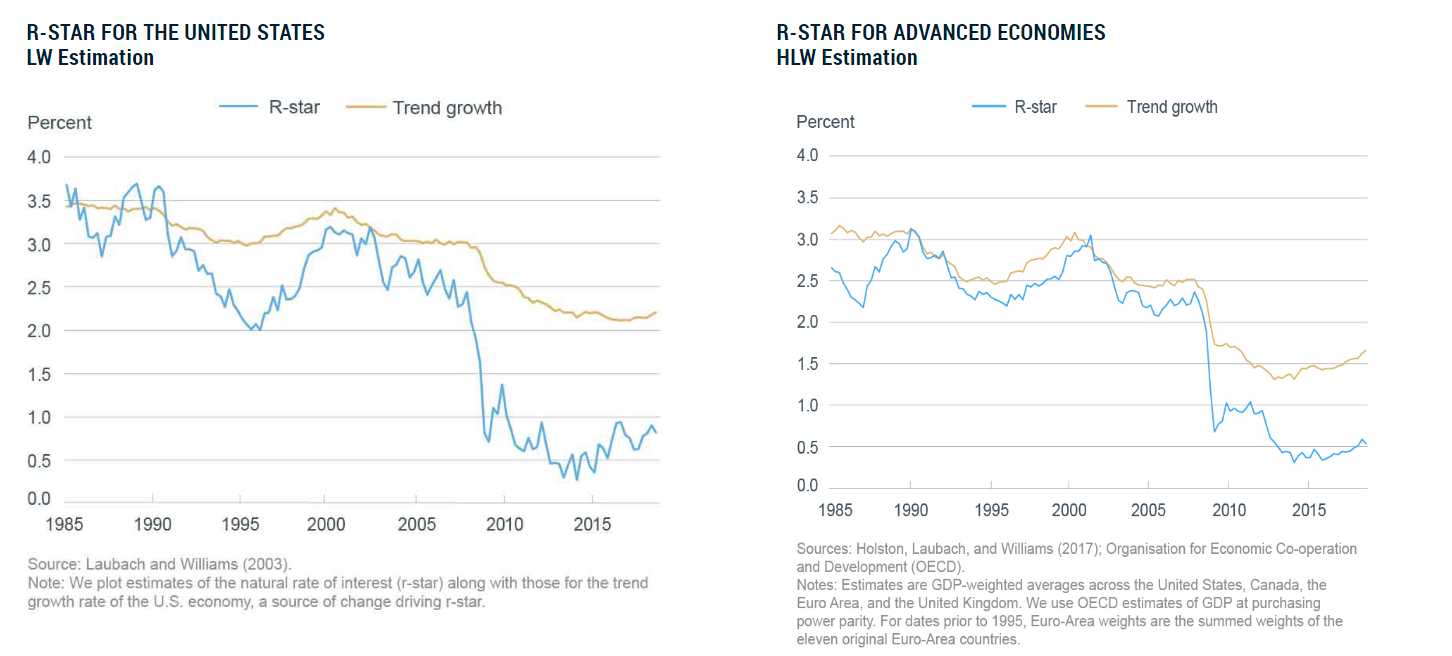
The median rate is 1.19%, so the current 2.25%-2.5% rate is in the upper half of the above model. Here are two charts from the NY Fed showing the result of other models:
The chart on the left is right below 1% while the chart on the right is slightly above .5%. Assuming a spread of 1.25% above and below each level, then current rates are still in the upper half of the projected ranges.
The latest export figures from Japan reported an 8.4% decline. Chinese exports - which account of 32% of exports - were off a whopping 17.4%. Figures from other Asian countries were just as concerning: Hong Kong -21.2%, Taiwan -11%, Korea -11%, Singapore -19.5%. This continues the string of weaker news from Asian countries, all of which point to a sharper Chinese slowdown than previously thought.
Minutes from the latest RBA meeting confirm the Asian slowdown (emphasis added):
US exports to China and Chinese exports to the United States had fallen sharply in late 2018 as a result of earlier tariff increases. There had been ongoing speculation that the United States might impose tariffs on automotive imports, which would affect imports from Germany and Japan. Some economies, particularly in the east Asian region, had been affected by the trade tensions because they provide inputs to Chinese exports as part of global supply chains. A number of economies had also faced a moderation in export growth because Chinese domestic demand had slowed. However, members noted that there had also been reports of firms accelerating existing plans to shift production from China to other low-cost producers in the east Asian region.
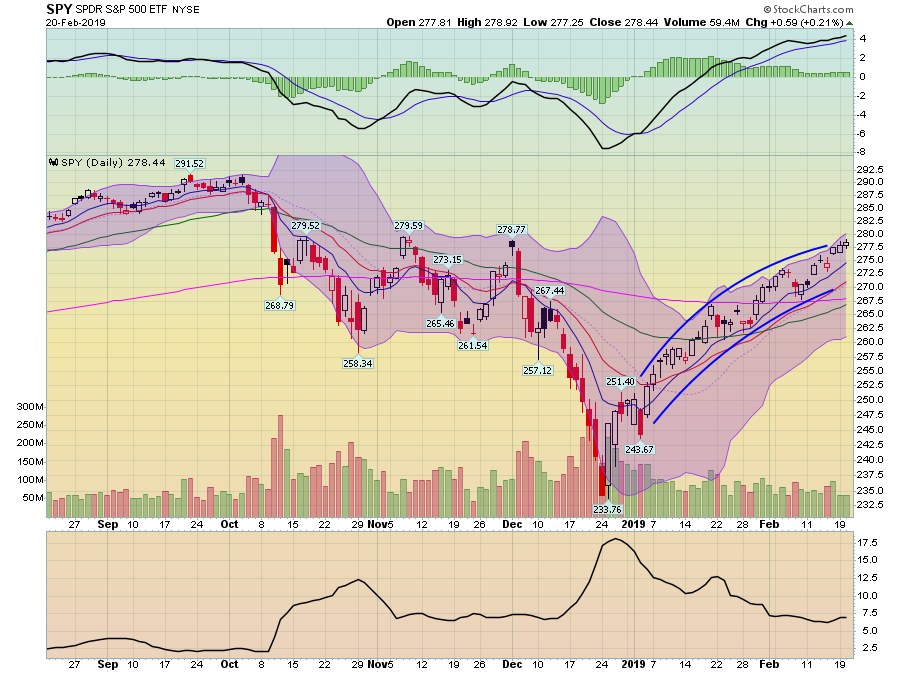
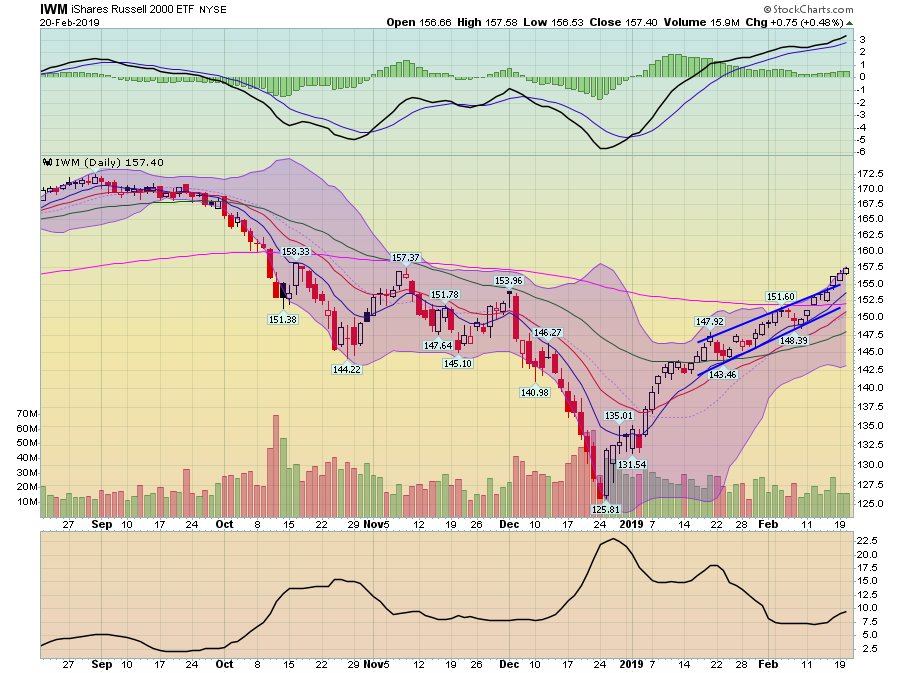
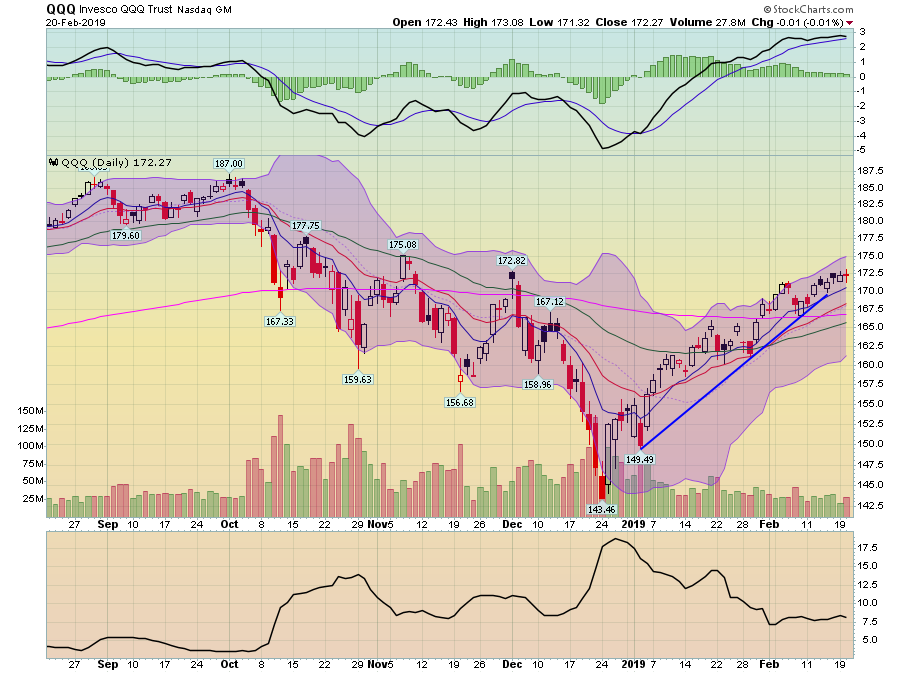
The markets were modestly higher today. Microcaps topped the list, rising .63%; mid-caps were up .40. The larger indexes were less than impressive: the SPYs increased .11 while the QQQs were down. Basic materials and financials were the two best performing sectors, rising 1.66% and .49%, respectively.
Yesterday I focused on the shorter charts. Today, I'll look at the daily charts for the major averages - most of which are in strong shape.
The SPY continues in a rounding channel pattern with prices currently trading near the top trend line. The technicals are solid: all the EMAs are rising with the shorter above the longer.
The IWM has many of the same characteristics - rising prices and EMAs that are increasing. Momentum is positive as well.
The QQQs remains a modest weak spot. While they are still in an uptrend, the pace of increases has grown somewhat weaker over the last week or so while the size of the candles is somewhat disappointing. This isn't fatal, just a modest concern.
The overall uptrend remains intact. The shorter and long-term time frames are pointing toward continued gains.
Disclosure: I/we have no positions in any stocks mentioned, and no plans to initiate any positions within the next 72 hours. I wrote this article myself, and it expresses my own opinions. I am not receiving compensation for it (other than from Seeking Alpha). I have no business relationship with any company whose stock is mentioned in this article.

