Summary
- Vanguard says the probability of a recession is increasing.
- A new report argues the US is closer to higher inflation than we think.
- The bearishness in the market is starting to play out.
Are recession probabilities increasing? Vanguard thinks so. They think there is now a 30-40% the U.S. economy will start a recession by 2020. Vanguard's model is based on two key elements: the yield curve and the probability that lower-rated credits will experience a meltdown. For every recession since the 1950s, the U.S. yield curve inverted between 18-24 months before the start of a recession. Right now, the 10-Year-3-Month spread is fluctuating around 100 basis points. Assuming the Fed keeps raising rates (which, according to the latest Congressional testimony, is their policy), the curve could very well invert before 2020. And assuming that this event is still a harbinger of recession that means 2020 is a likely time for one to start.
Is Inflation making a stealth comeback? According to the latest CPI release, the Y/Y rate of overall/core inflation was 2.9%/2.4%, respectively. This is not the Fed's preferred inflation measure, however. They use the PCE price index which covers a wider swath of goods and services. However, a new analysis shows that the current uptick in inflation mirrors the events of the late 1960s which laid the economic groundwork for the high inflation of the 1970s. If this report's conclusions are correct, we could have a nasty correction coming our way. Cover me skeptical, however. Until the last 12-18 months, deflation was the primary price story in all the major developed countries. It still is in Japan; prices only recently rose above 2% in the EU. Between increasing international competition (which expands the number of suppliers, creating more competition and, therefore, lower prices) and the increased use of technology (which allows consumers and businesses to check prices in real time), I'm just not seeing an inflationary spike in the future. Regardless, it's still worth considering simply to get and digest an incredibly well-researched counter-argument.
Is the housing market signaling a slowdown? That depends who you ask. I wrote about this topic a few weeks ago and concluded:
To conclude, calls for a peak in the housing market appear premature. The economic backdrop is still very favorable. Mortgage rates are still low. New home sales have been weak solely due to a drop in sales in the West Census region. Existing home sales are moving sideways, probably due to low inventory and rising prices. Therefore, I think the argument that the housing market has peaked is premature.
Greg Robb over at Marketwatch came to the same conclusion in an article published today. However, according to real estate website Redfin, a slowdown is in the cards. I'm not sold on that story, but, as always, we'll have to wait for the data to emerge.
Throughout last week, I noted a number of charts were weak from a technical perspective. That weakness is carrying through to the charts. The macro backdrop - especially the lira situation - is not helping.
Let's start with today's price action:
SPDR S&P 500 (NYSE:SPY)
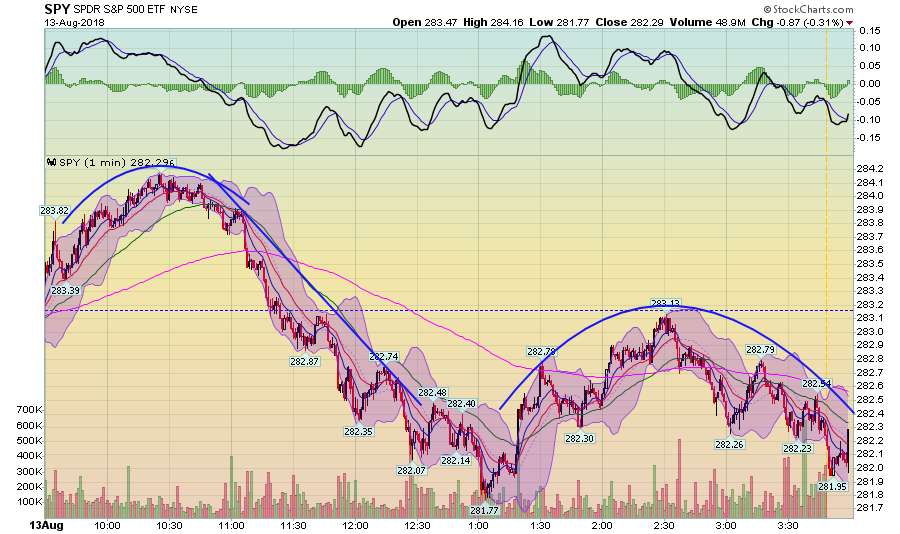
Despite the bad news from the EU, prices moved higher at the open. But they quickly rolled over and moved lower until the early afternoon. Prices tried to stage a rally after lunch but ran into resistance at the same price level as Friday's close.
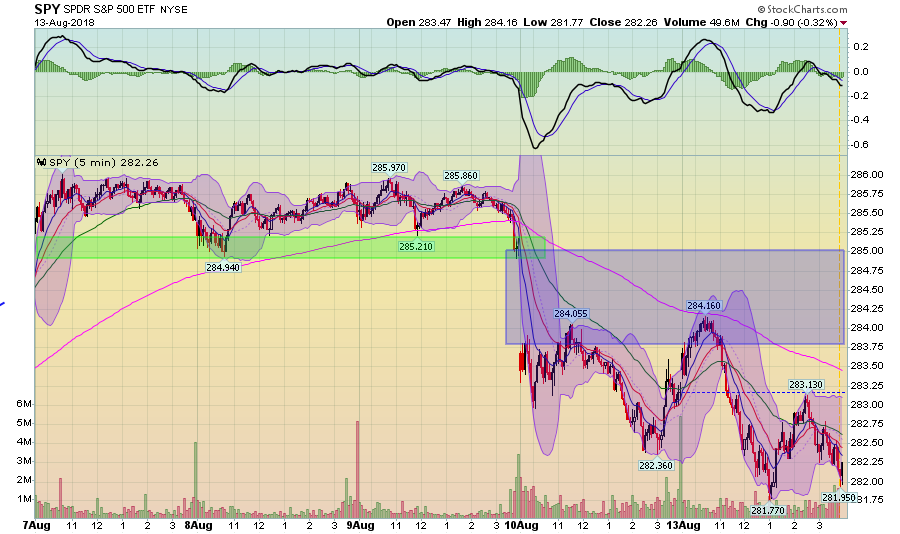
As I noted last week, a number of times (and which I refer to below) prices formed several spinning tops at the end of last week. This is a classic topping formation. The area above the green shaded area represents those spinning tops. Prices have gapped lower since Thursday's close - which we see in the shaded blue area.
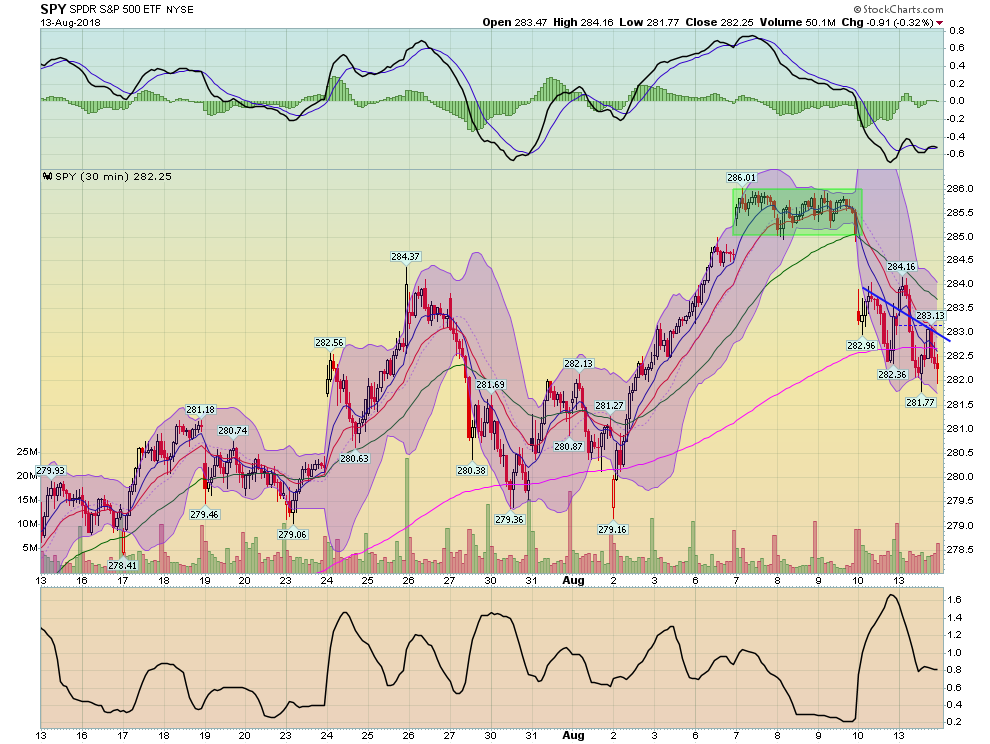
The 30-day chart shows the price action in even more detail. Pay particular attention to the gap higher between the 6th-7th hand and the gap lower between the 9th and 10th. This represents prices moving higher, printing the tops, and then gapping lower.
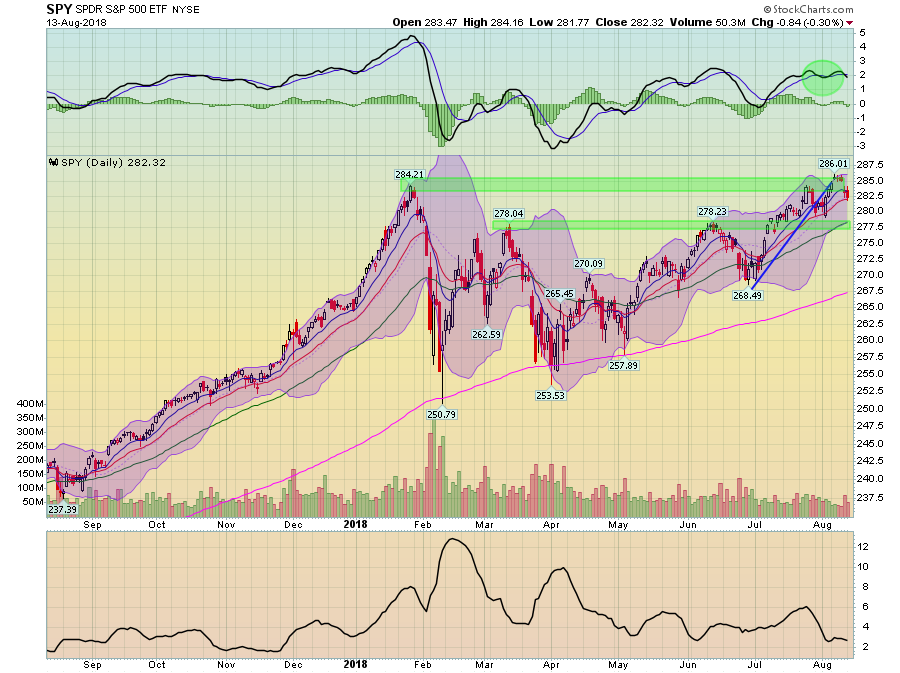
And the daily chart shows the near complete round-trip of prices. The trend line is broken; prices are now finding support at the 20-day EMA.
What's especially important in the daily chart is that prices have rallied to the highs from late January only to be rebuffed - at least for now. There is plenty of play in the MACD for prices to move higher, so this is not the end of the analysis. However, I think that assumes some significant and meaningful resolution to the Turkey situation, which doesn't seem to be forthcoming just yet.
Disclosure: I/we have no positions in any stocks mentioned, and no plans to initiate any positions within the next 72 hours.
I wrote this article myself, and it expresses my own opinions. I am not receiving compensation for it (other than from Seeking Alpha). I have no business relationship with any company whose stock is mentioned in this article.


