Technically Speaking For April 29
Summary
- Modern Monetary Theory doesn't look to be all that sound an idea outside of special economic circumstances.
- International equity markets are pointing towards higher international economic growth in the next 6-12 months.
- It looks like the small-cap indexes might be close to breaking through key resistance levels.
So - what is Modern Monetary Theory, which seems to have taken a weed-like hold on the left's economy thought? I have yet to find a really good answer. The theory seems to center on the idea that the government's power to print money allows it to do so ad infinitum in order to support policies that eventually lead to full employment. I think that Japan's post-bubble economy - where the government has a debt/GDP ratio of over 200% along with low-interest rates and zero inflation - started the thought process. The current U.S. experience of high debt and low-interest rates probably added fuel to the fire. In today's Financial Times, Gavyn Davies offers a key synopsis: the theory is more applicable in a low-interest rate, low inflation environments and less applicable in more normal (higher interest rate, higher inflation) environments.
Central to the new round of U.S. trade negotiations is an understandable desire to open up new markets for U.S. farmers. There's one problem with this line of negotiations, however: for reasons of national security, countries loathe becoming dependent on foreign food sources. Even a skilled and seasoned negotiator would find it difficult to get around this basic geopolitical reality. While China has agreed to buy more U.S. food exports, it has always been far more active in the international agricultural markets than other developing countries. Japan - which have always been far more closed to international food trade - is a much harder sell. This explains why Japan has refused to open its markets to U.S exports. I'm curious to see how this plays out in the overall negotiating strategy for the U.S.
Equity markets are leading economic indicators. Traders buy stocks in anticipation of future returns based on a growing economy that then fuels rising company earnings. According to ETFs that track regional equity markets, investors are projecting faster economic growth in the coming 6-12 months:

All Asia except Japan (left), emerging markets (second from left), and Europe (second from right) have all rallied after last year's selloff. Only Latin America (far right) has moved lower, but then only modestly so.
As I noted in my weekly summary, the markets are signaling slower economic growth. The Treasury market and large-cap rally at the expense of smaller-cap growth are both indicating investors see slower growth ahead.
However, it's also possible that the small-caps might be setting up for a technical break out.
Let's start with today's performance table:
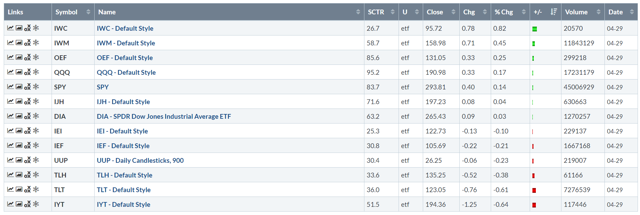
Today's performance was clearly "risk on" with the IWM up 0.82%, and the IWM gaining 0.45%. Boeing (NYSE:BA) brought the IYT down 1.25%. The Treasury market sold off a bit as well.
The 30-day charts show the difference in performance between large and small-cap indexes.
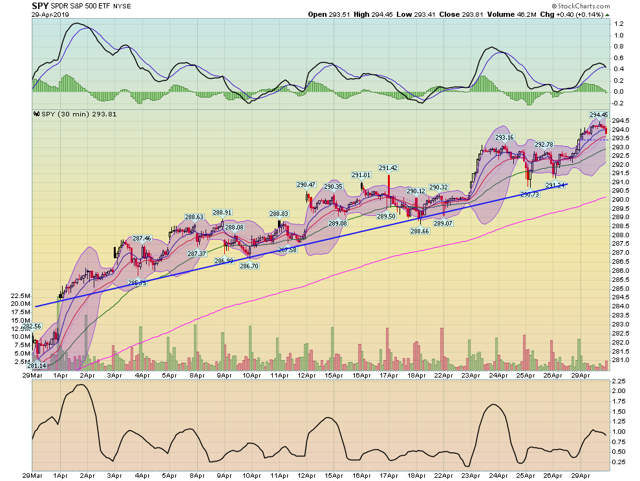
The SPY has been in an uptrend since the beginning of April. The chart has been in a rally/selloff model for 21 days. The 200-minute EMA shows this rally as well, as do the shorter EMAs.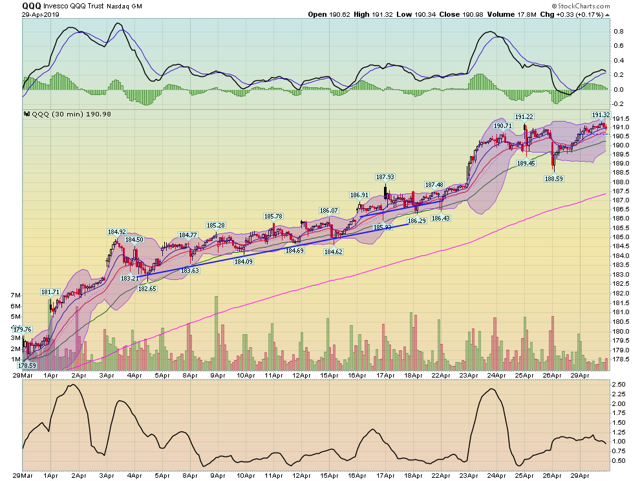
The QQQ is also in the middle of a 21-day rally, although it had a sharper increase at the beginning of last week.
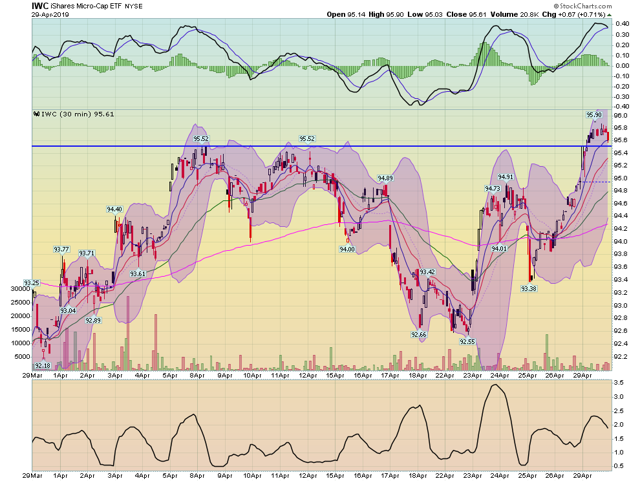
In contrast to the QQQ and SPY is the IWM. This index sold off in mid-April, trading near monthly lows. It has since rallied and is now just off monthly highs.
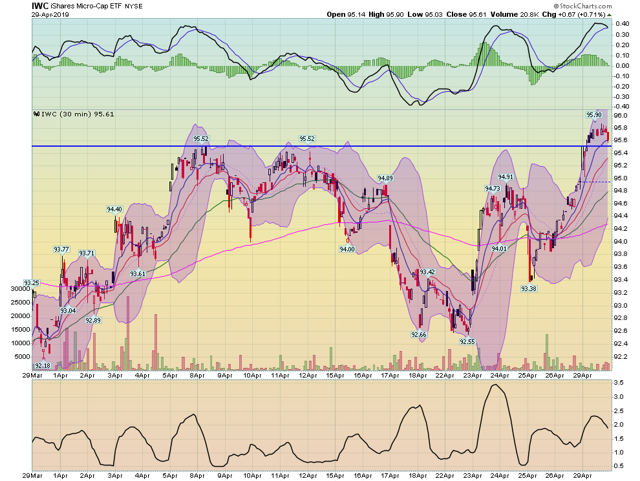
We see the same pattern in the IWC.
But on the daily charts of the small-caps, we see that prices are potentially poised to break-out.
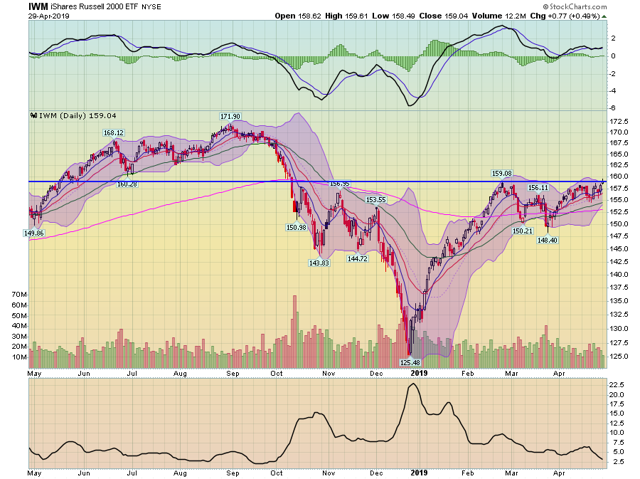
The IWM is right at resistance at the 159 level. A strong move into the 160 level would probably indicate a move higher to the mid-160s.
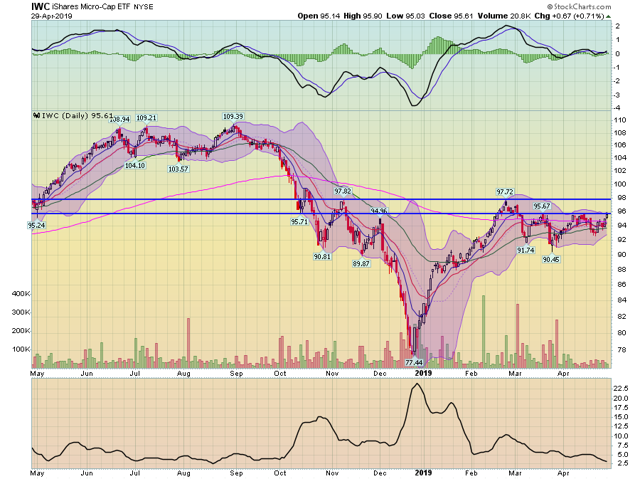
The IWC is right at resistance at the 96 level. This ETF has another area of resistance at the 97.5-98 level to get through.
The good news is that we're at the beginning of earnings season, so a few upsides, small-cap earnings surprises could help to move these indexes higher. The bad news is that the Q1 GDP print actually points to a much slower-growth GDP situation in the coming quarters, which is less supportive of smaller-cap companies.
Disclosure: I/we have no positions in any stocks mentioned, and no plans to initiate any positions within the next 72 hours. I wrote this article myself, and it expresses my own opinions. I am not receiving compensation for it (other than from Seeking Alpha). I have no business relationship with any company whose stock is mentioned in this article.
