Technically Speaking For April 16
Summary
- In a recent speech, Fed President Rosengren noted that the Fed is more likely to encounter deflation instead of inflation.
- The Dallas Fed argues that the rise of internet commerce and the gig economy have helped to contain inflationary pressures.
- The small and large-caps continue to have divergent performance, which isn't that encouraging.
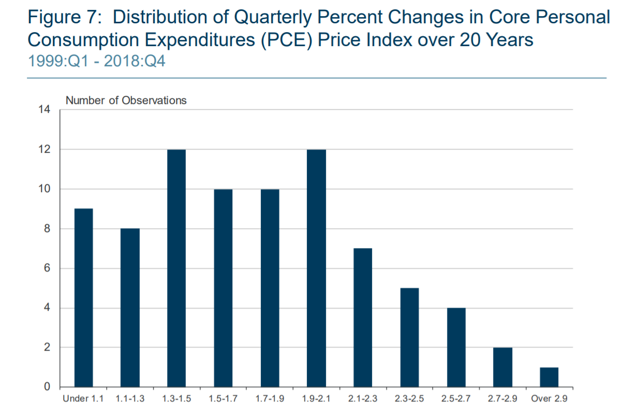
Boston Fed President Rosengren gave a presentation yesterday titled, "Monetary Policymaking in Today’s Environment: Finding “Policy Space” in a Low-Rate World". In it, he noted that, unlike Feds of the past, the central bank now has to contend with weak inflationary pressure, as illustrated in this chart:
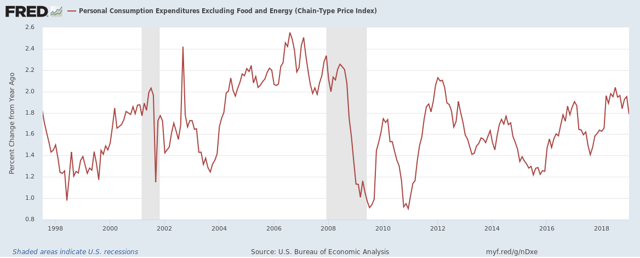
Since Q1 1999, PCE inflation has skewed below 2%, which means inflation hasn't been a problem. This chart from the FRED system shows the same data in a time series perspective:
The only time the core PCE price index was above 2% was the last four years of the early 2000s expansion. This data means that disinflation (a la Japan of the last 30 years) rather than inflation is far more likely which completely changes the Fed's overall policy-making equation.
That naturally leads to the question of, "why are price pressures so contained?" The Dallas Fed offers two potential answers in a recent research piece, where they argue that the rise of internet shopping and the gig economy have contributed to the decline in price pressures. I would add increased internet sales increases price transparency, making it more difficult for retailers to increase prices. The former - which continues to grow in importance and amount - allows consumers to purchase items non-locally, which reduces the monopoly power of a large local producer. The latter increases employment opportunities which, in turn, decreases wage negotiation power, lowering salary pressures. The Dallas Fed concludes:
However, modifying Phillips curve models to reflect online shopping and gig employment can help account for a flattening of the Phillips curve and a drop in the natural headline rate of unemployment. Nevertheless, these shopping and employment behavior changes are still new enough that the data are insufficient for full statistical analysis. It will take more observations and analyses to better identify the precise extent of these effects.
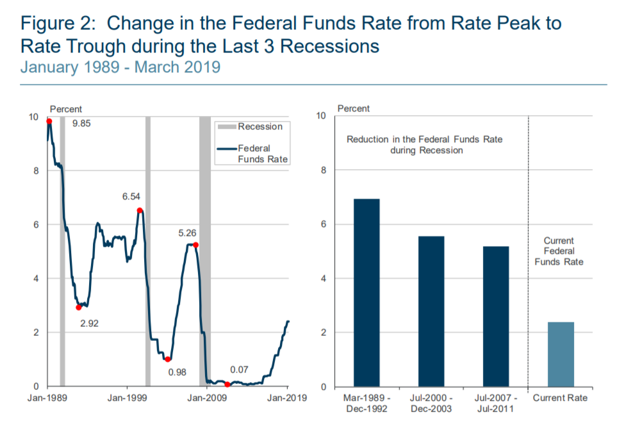
Returning to Rosengren's presentation, we have this slide:
In the last three recessions, the Fed has been able to reduce rates by at least 5%. Compare that the current Fed funds rate of 2%-2.25% -- half the level of the least small rate reduction in the last 30 years. That means that we probably haven't seen the last of quantitative easing.
My basic market thesis: The markets are "toppy"; the rally in the Treasury market and large-cap equity indexes and underperformance of the smaller-caps indicates traders are projecting weaker growth. For my thesis to change I need a Treasury market selloff and/or a stronger small-cap performance.
Let's look at today's performance table:
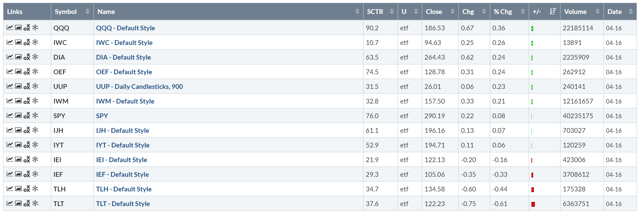
An odd day. The QQQ led the market higher, but the IWC was the second-best performer. However, the DIA and OEF were the next two highest performers. The IWMs did advance - just not to the same degree as the IWM. The Treasury market, however, did sell off.
The 1-day chart was less than inspiring:
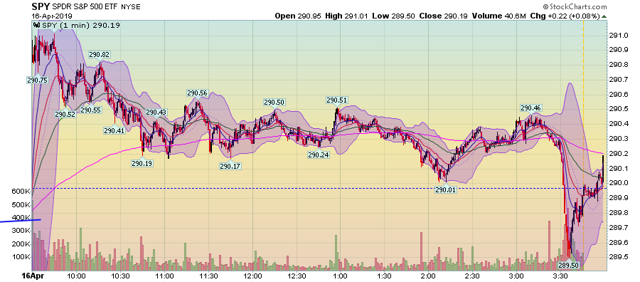
The SPY gapped higher at the open then trended sideways at a slightly lower level for most of the rest of the session. The market sold off sharply towards the end of trading but bounced back to end in slightly positive territory.
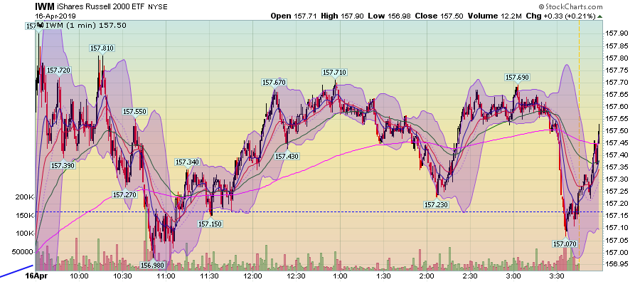
The IWM has a similar pattern. Notice how this index was once again contained by the 157 level.
However, it's really the two-week charts that continue to show a sharp difference in the performance between the larger and small-cap indexes.
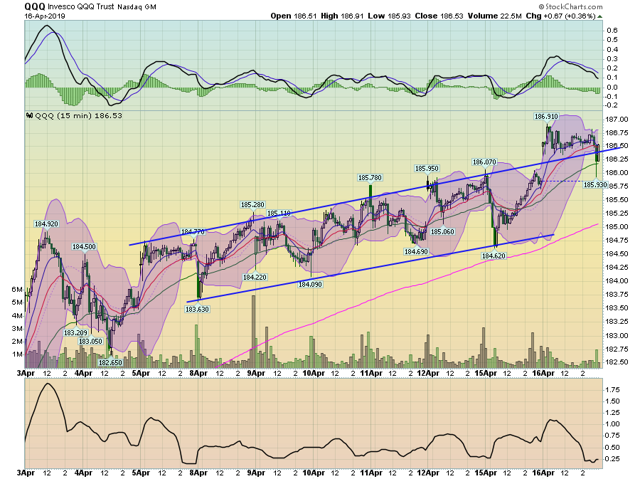
The QQQ continues to have the best chart - it's clearly in an uptrend. Prices are near two-week highs.
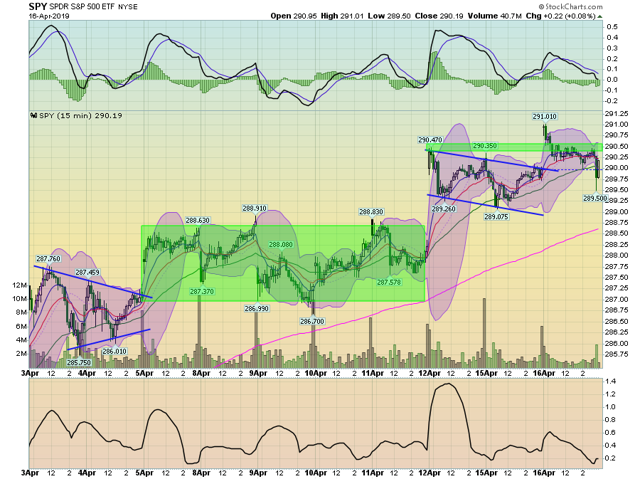
The SPY's chart is a bit uglier, but it still has an overall uptrend in place.
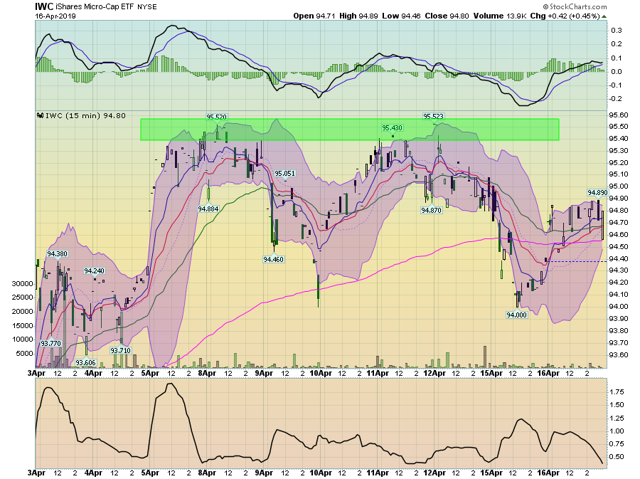
And then we have the IWC (micro-cap) which is below its two-week high.
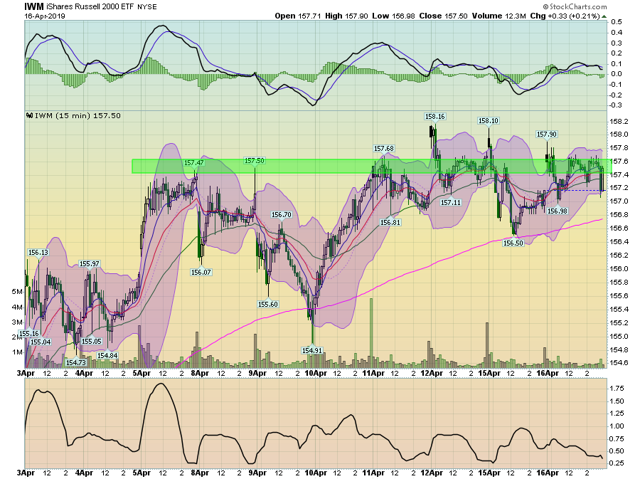
And the IWM continues to have problems with the 157 price level.
The divergence in performance between small and large-caps continues to be a very big problem for the market.
It could be argued that we're starting to see modest deterioration in the Treasury market:
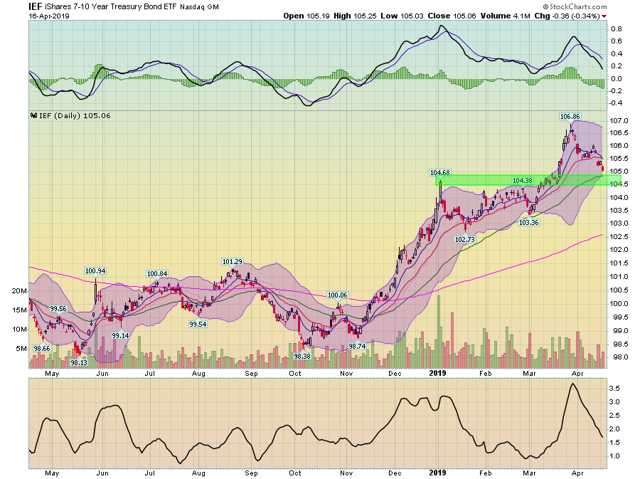
The IEF is down about two points from its high at the end of March ...
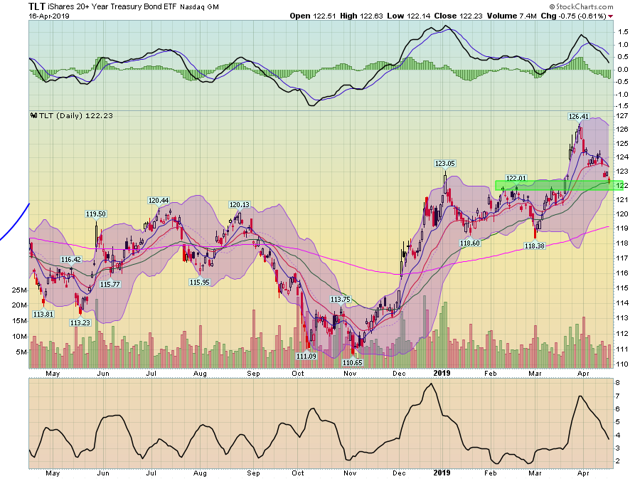
And the TLT is off about 4-5 points from its recent peak.
Still, the divergence between the small and large-cap stocks remains a significant concern for the markets.
Disclosure: I/we have no positions in any stocks mentioned, and no plans to initiate any positions within the next 72 hours. I wrote this article myself, and it expresses my own opinions. I am not receiving compensation for it (other than from Seeking Alpha). I have no business relationship with any company whose stock is mentioned in this article.

