
Technically Speaking For April 15-19
Summary
- While it's still too early to tell, it's possible that we're seeing a bottom in some economic data.
- Overall, the US news was modestly bullish this week.
- The stronger big-cap/weaker small-cap performance continues.
Emerging Markets
- Turkish unemployment rises to 14.7%
-
- Turkish industrial production down 5.1%
-
- Turkish retail sales down 4.9%.
- Brazil index of economic activity indicates Y/Y GDP growth of 2.49
- Indian wholesale price index at 3.18%
- South African retail sales up 1.1%.
Emerging Market conclusion: the "good news" is that EM weakness is contained. Perhaps the biggest issue remains the ongoing trade issues which hurt export-oriented EMs like South Africa and Brazil.
EU/UK/Canada
EU
- EU Construction increased by 3% M/M
- EU Sentiment up 4.5% M/M
- EU inflation at 1.4% Y/Y (core is .8%).
- Exports up 3.4% M/M.
- EU Manufacturing PMI 47.8; Service 52.5; composite 51.3
UK
- UK unemployment at 3.4%.
- UK inflation at 1.8%
- UK retail sales up 1.6% on a rolling 3-month basis.
Canada
- Bank of Canada's Business Outlook Survey is positive.
- Canadian auto sales were up modestly
- Canadian inflation up 1.9%
- Exports down 1.3%
- Manufacturing sales down .2%
EU/UK/Canada conclusion: there was some improvement in the EU data; sentiment - while negative - was up; Markit Services remain positive; construction advanced. But the ECB's public statement about economic weakness and its re-opening of a recession line of credit indicate there are problems. The UK is doing remarkably well considering how dysfunctional their political environment is. But it's possible that the Brexit hoopla pulled activity forward, meaning we could see a modest slump. Canada is in fair shape; it has recovered from the oil market slowdown a few years ago and is once again growing modestly.
China/Japan/Asia
China
- GDP +6.4% Y/Y
- Industrial production +8.5%
- Retail sales +8.7%
- Fixed asset investment +6.3%
Japan
- Retail sales increased .6% Y/Y
- Industrial production down 1.1% Y/Y
- Exports down 2.4% Y/Y.
- Manufacturing PMI at 49.5
China/Japan/Asia conclusion: there was a great deal of writing this week stating that the Chinese slowdown was over. As we only have one week of data, I'm not completely sold on that narrative. But the preliminary numbers are undoubtedly positive. Japan, on the other hand, is meandering into weakness. It's possible that their data is behind Chinese data by a few months. If that's true, we should see improvement by the end of the second quarter.
US Economic Releases of Note
Atlanta Fed's GDP Nowcast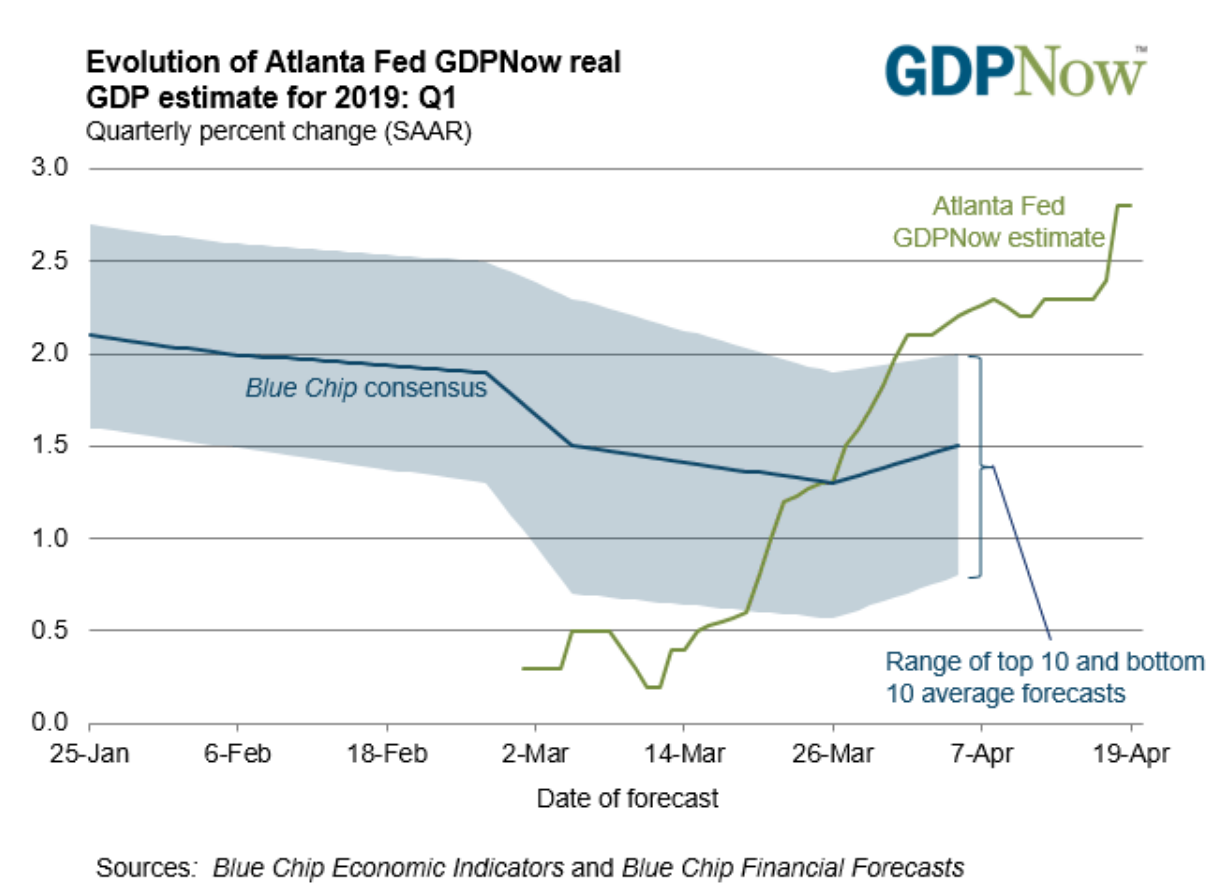
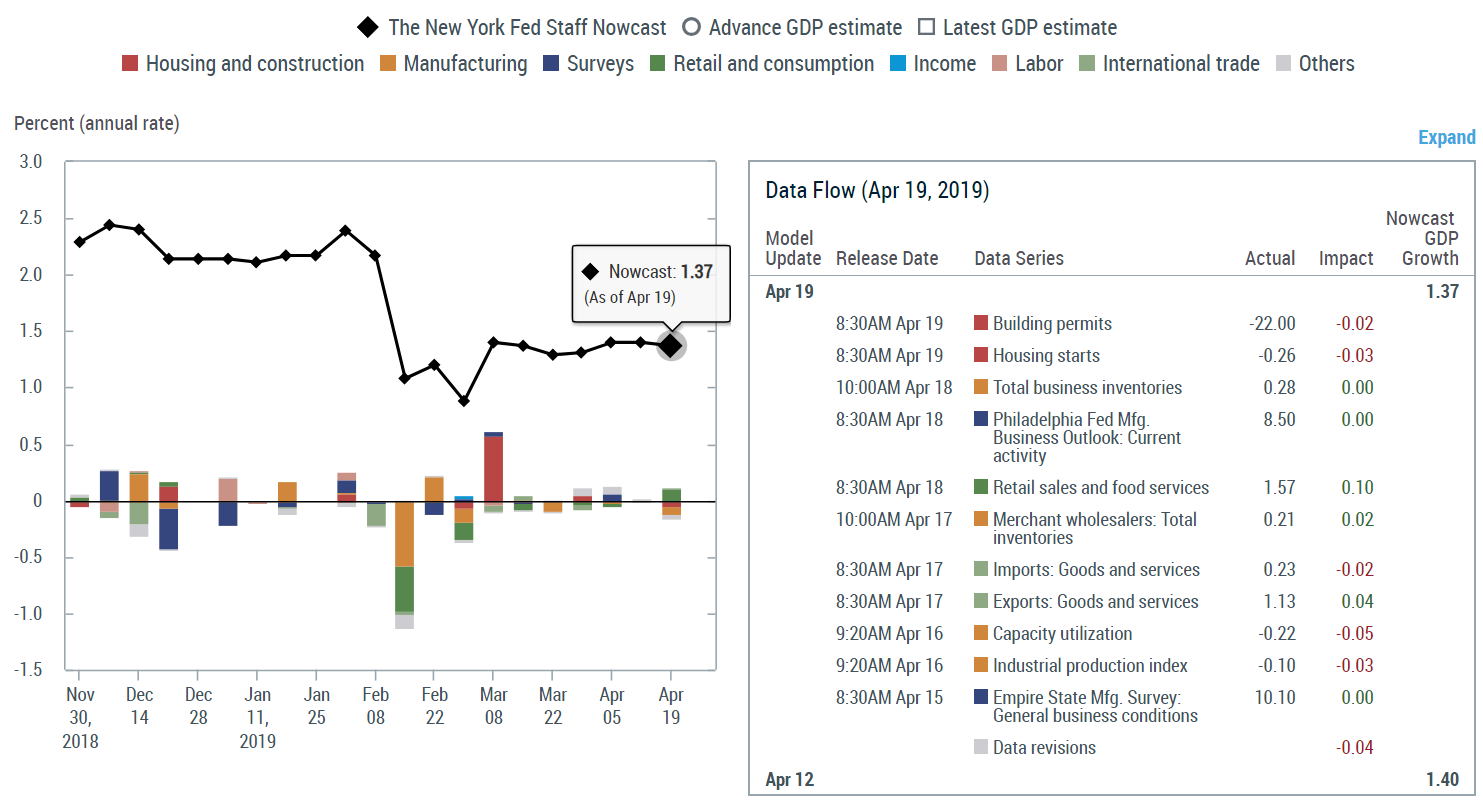
NY Fed's GDP Nowcast
Homebuilder sentiment is up modestly:
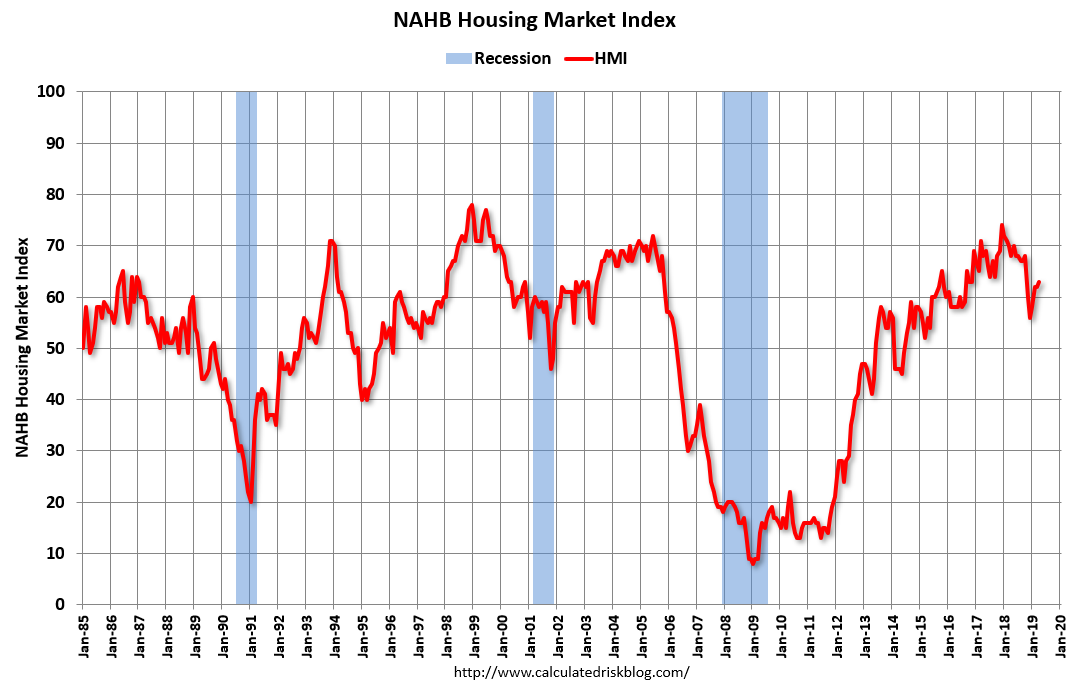
Chart from Calculated Risk
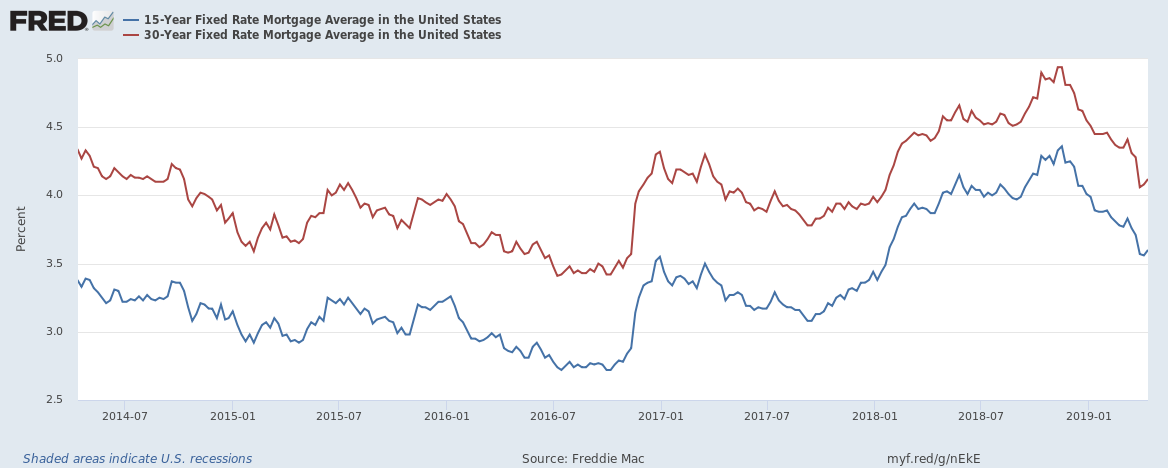
The drop in interest rates is a big reason for this:
The Federal Reserve released the latest industrial production number this week. This data remains a bit weak: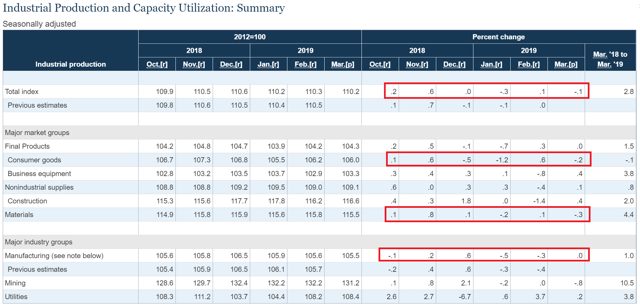
The topline number has been weak for the last six months; the strongest monthly increase was .6%; the next best reading was .2% with the remaining numbers just around 0%. Consumer goods number have also been soft; they've declined in three of the last four months and have only growth strongly in two of the last six readings. Materials and manufacturing output have also been disappointing.
Here are two charts of the overall number:
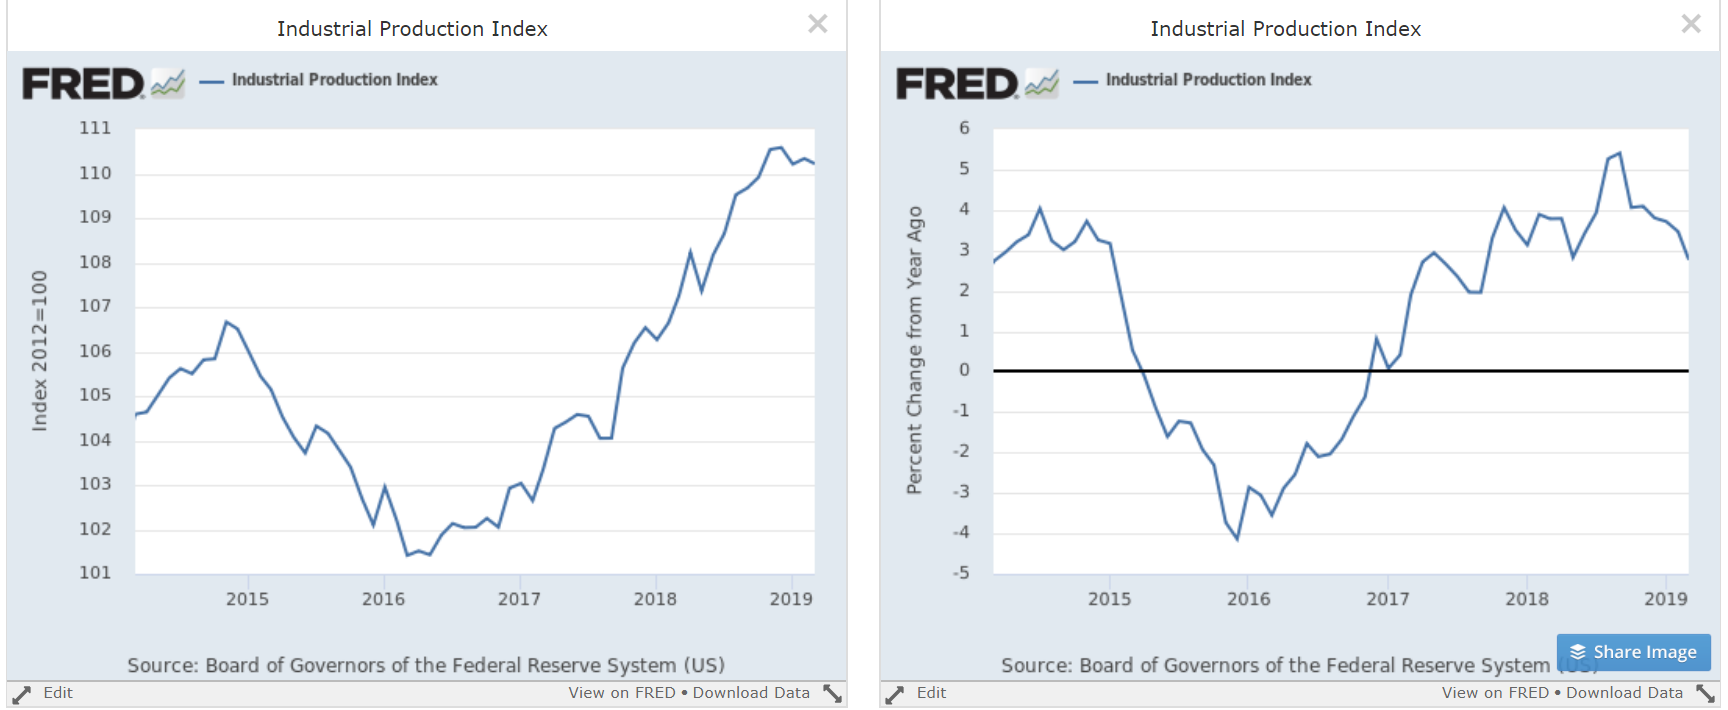
Industrial production has moved sideways for the last six months after a strong advance that started in early 2016 and gained steam over the last two years. The Y/Y pace of growth (right chart) is moving modestly lower, although it's still positive.
Retail sales rebounded, rising 1.6%. Best of all, the data has clearly rebounded: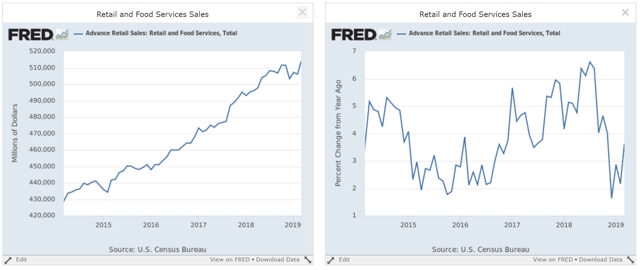 Total retail sales (left chart) are now at a cycle high while the Y/Y percentage change number (right chart) has improved.
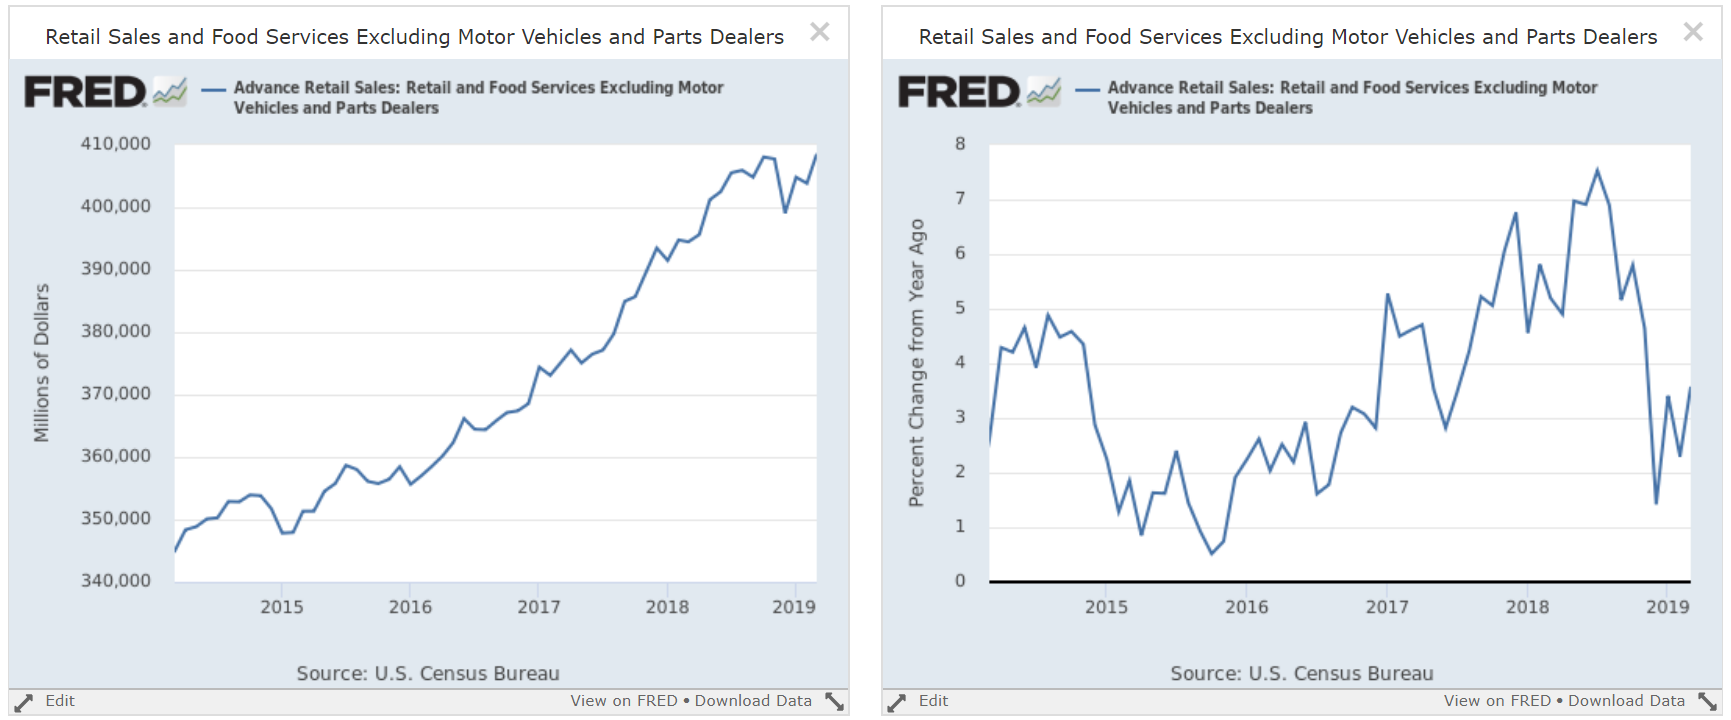
And, the improvement is not the result of a spike in car sales. When we take those purchases out of the data, we are still at a cycle high (left chart).
Building permits and starts came out this week. Permits are still moving modestly lower.
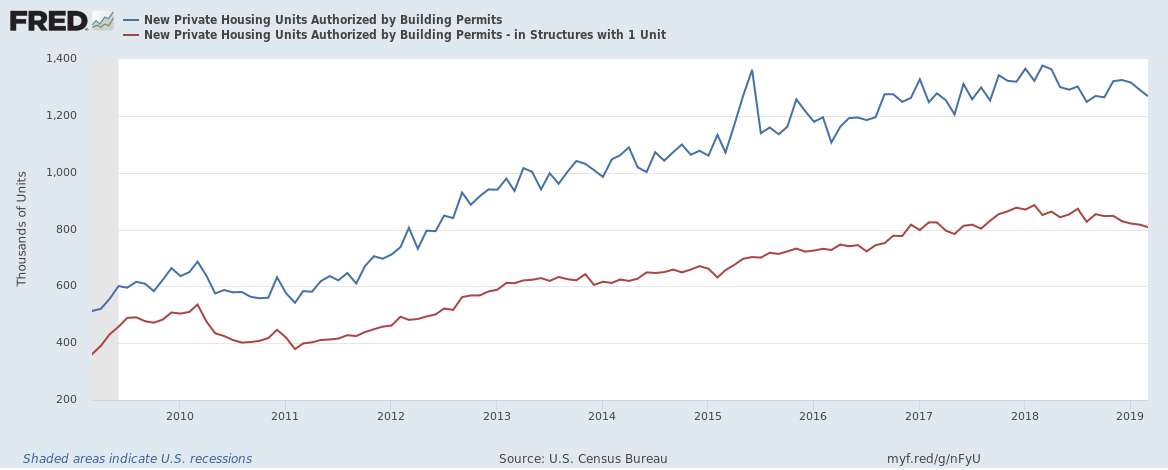 The decline in both overall (in blue) and 1-unit structures (in red) is modest, indicating that the Fed's rate hikes are having their desired effect. Just as importantly, the decline isn't fatal; this is a modest softening of the data.
Housing starts were mostly unchanged: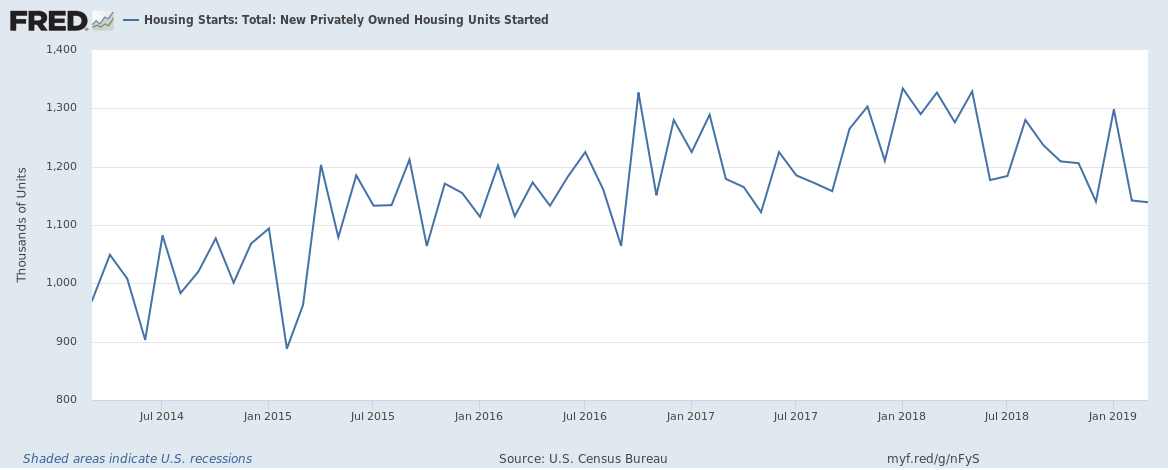 Like permits, the starts data is softer, but certainly not fatal.
US Conclusion: The data is modestly bullish. The best news was the rise in retail sales, which indicates that the consumer's recent slump was short-lived and probably caused by temporary factors (the government shutdown, bad weather, and the stock market swoon at the end of last year). Industrial production data is modestly concerning but when seen in the light of the continuing strength in the ISM data, isn't fatal. Housing is soft, but that is to be expected after taking the Fed's rate hikes into account. Overall, the economy appears to be coming out of the modest downturn in 4Q18-1Q19.
Central Bank Actions
There were no major central bank actions this week.
Market Activity
My basic market thesis: The markets are "toppy"; the rally in the Treasury market and large-cap equity indexes and underperformance of the smaller-caps indicates traders are projecting weaker growth. For my thesis to change, I need a Treasury market selloff and/or a stronger small-cap performance.
Let's turn to this week's performance table:

This was very much a "not much happened" week. But, once again, we have a big/small cap split. The DIA, QQQ, and SPY were all up modestly while the smaller-caps indexes were down. This divergence in performance is growing to be a very large problem for the market.
The charts show the problem in more detail. Let's start with the QQQ:

This week, the overall trend was modestly higher. However, the graph only covers four points of price action.

And, the 30-day QQQ chart is in a clear uptrend.

This week, the SPY moved more or less sideways, trading in a narrow 3-4 point range.

But the 30-day chart shows a clear uptrend.
But then performance gets a little dicier:
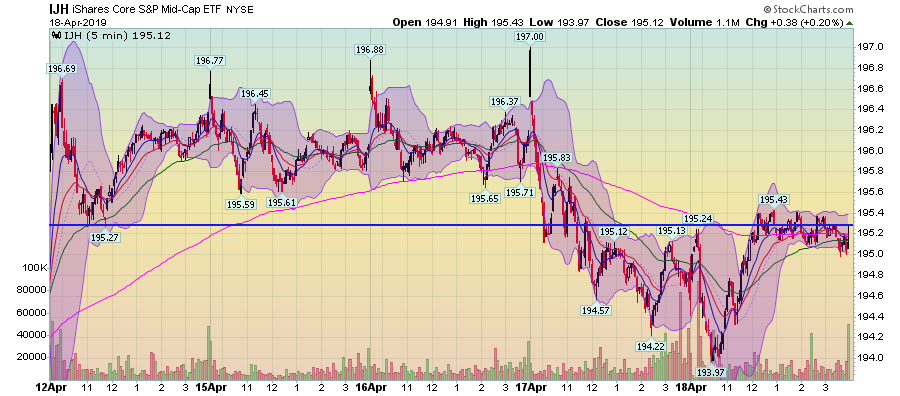
This week, the mid-caps traded in two narrow ranges. But on Thursday and Friday, the index was clearly weaker, trading below the 195 low established on Monday.
While the IJHs' overall 30-day trend is still higher, there are two trend breaks: the first on April 9 and the second on April 15.

The IWMs 5-day chart is similar to the IJH's above. The IWM was weaker on Thursday and Friday, with prices constrained by the 156.50 price level from Tuesday.
And on the 30-day chart, prices have been moving more sideways for the last two weeks.
While the IWC 30-day chart shows a modest sell-off in the last few days:

As we move from large to small cap, the performance progressively deteriorates, indicating a distinct and clear risk-off appetite among traders. But so long as it persists, it's difficult seeing the market make major upward headway. More than anything, the bulls need a great earnings season, which they're not likely to get. That means, we can expect more market meandering in the coming weeks.
Disclosure: I/we have no positions in any stocks mentioned, and no plans to initiate any positions within the next 72 hours. I wrote this article myself, and it expresses my own opinions. I am not receiving compensation for it (other than from Seeking Alpha). I have no business relationship with any company whose stock is mentioned in this article.